
Cardano (ADA) price has dropped roughly 7% since yesterday’s high to $0.258, breaking below the 20-day exponential moving average (EMA) with no significant buying response on the candle.
The last time ADA broke this same EMA level on Feb. 27, prices corrected by 13%. A head-and-shoulders pattern that has been forming since February now has its neckline just 9% below the current price, and a confirmed break would target a 20% decline.
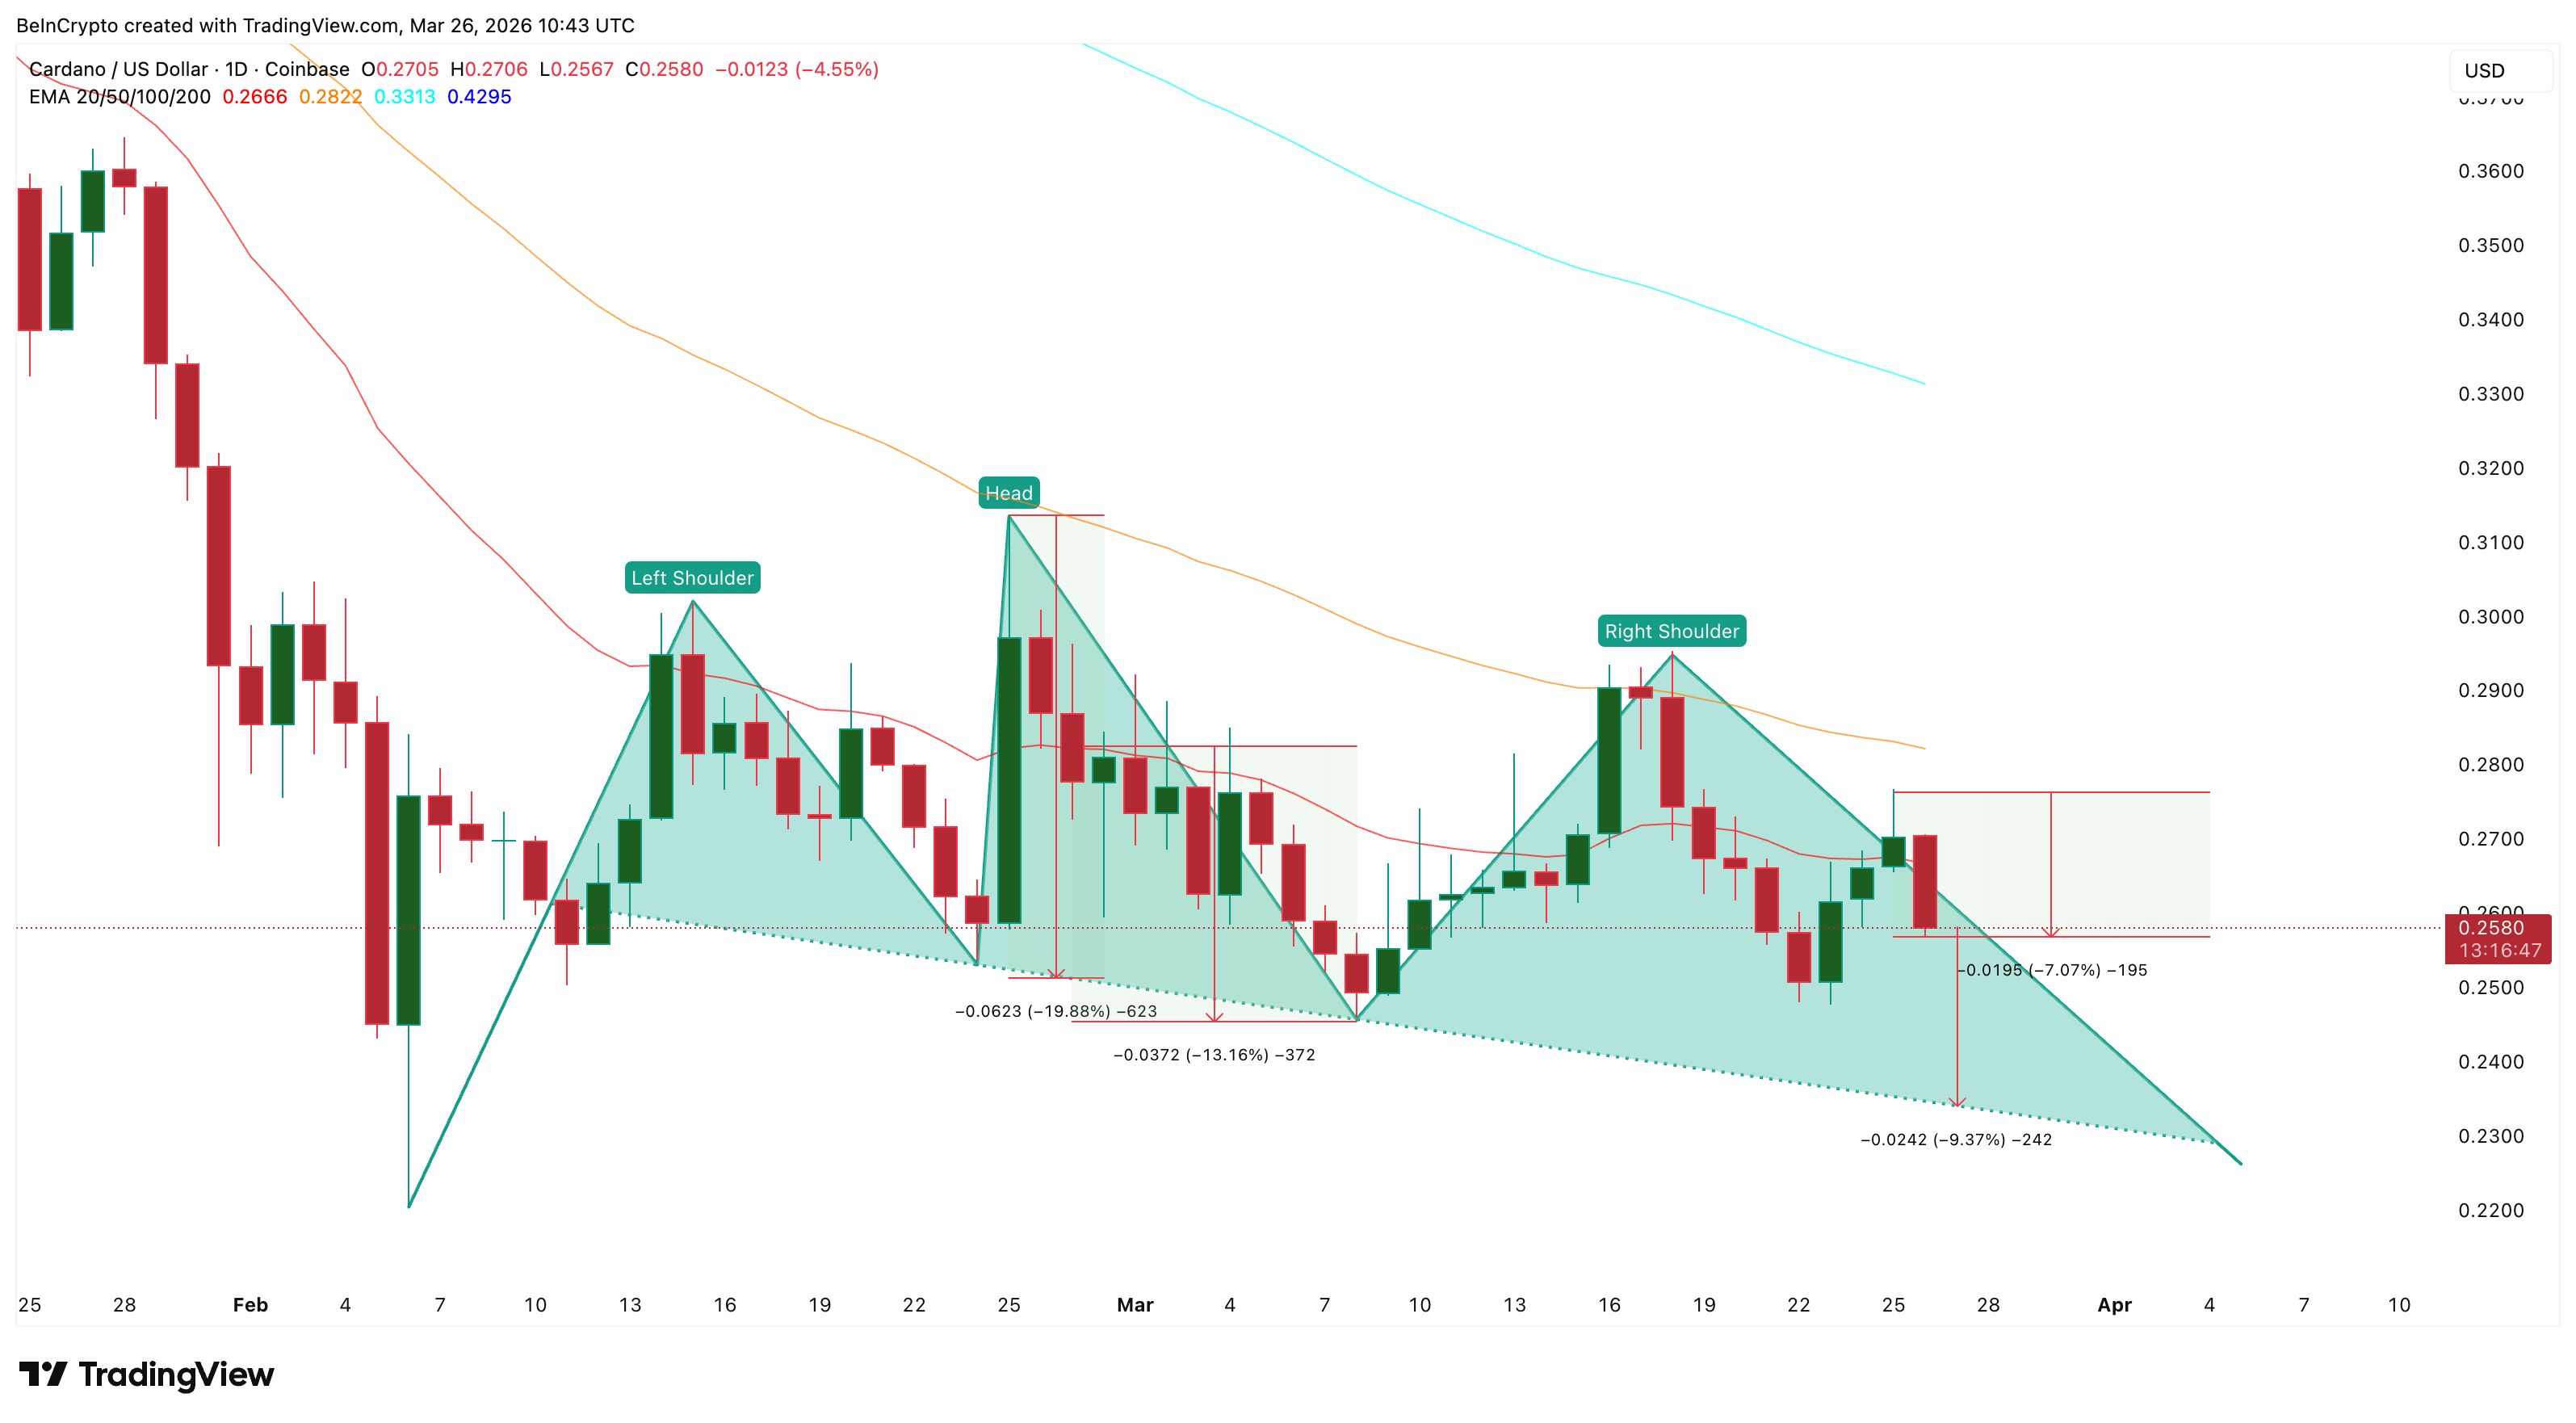
EMA Break and Head and Shoulders Push ADA Toward Neckline
The daily ADA price chart shows a head and shoulders formation with a near 20% breakdown projection.
Cardano price has already breached multiple support levels during today’s decline, but the most critical one is the 20-day Exponential Moving Average (EMA) line, a trend indicator, which gives greater weight to recent price movements and was broken at $0.266.
The previous 20-day EMA breakdown on Feb. 27 resulted in a 13% correction over the following days. The current drop of 7% from the right shoulder peak leaves roughly another 9% before the price reaches the neckline. If that level breaks on a daily close, the measured move target for the head-and-shoulders pattern projects a decline of roughly 20%, as highlighted earlier.
Want more token insights like this? Sign up for Editor Harsh Notariya’s Daily Crypto Newsletter here.
The pattern looks weak, and the EMA break adds urgency. However, one volume-based indicator suggests the slide may not go unchecked.
Dip Buyers Push Back, but Big Money Stays Away
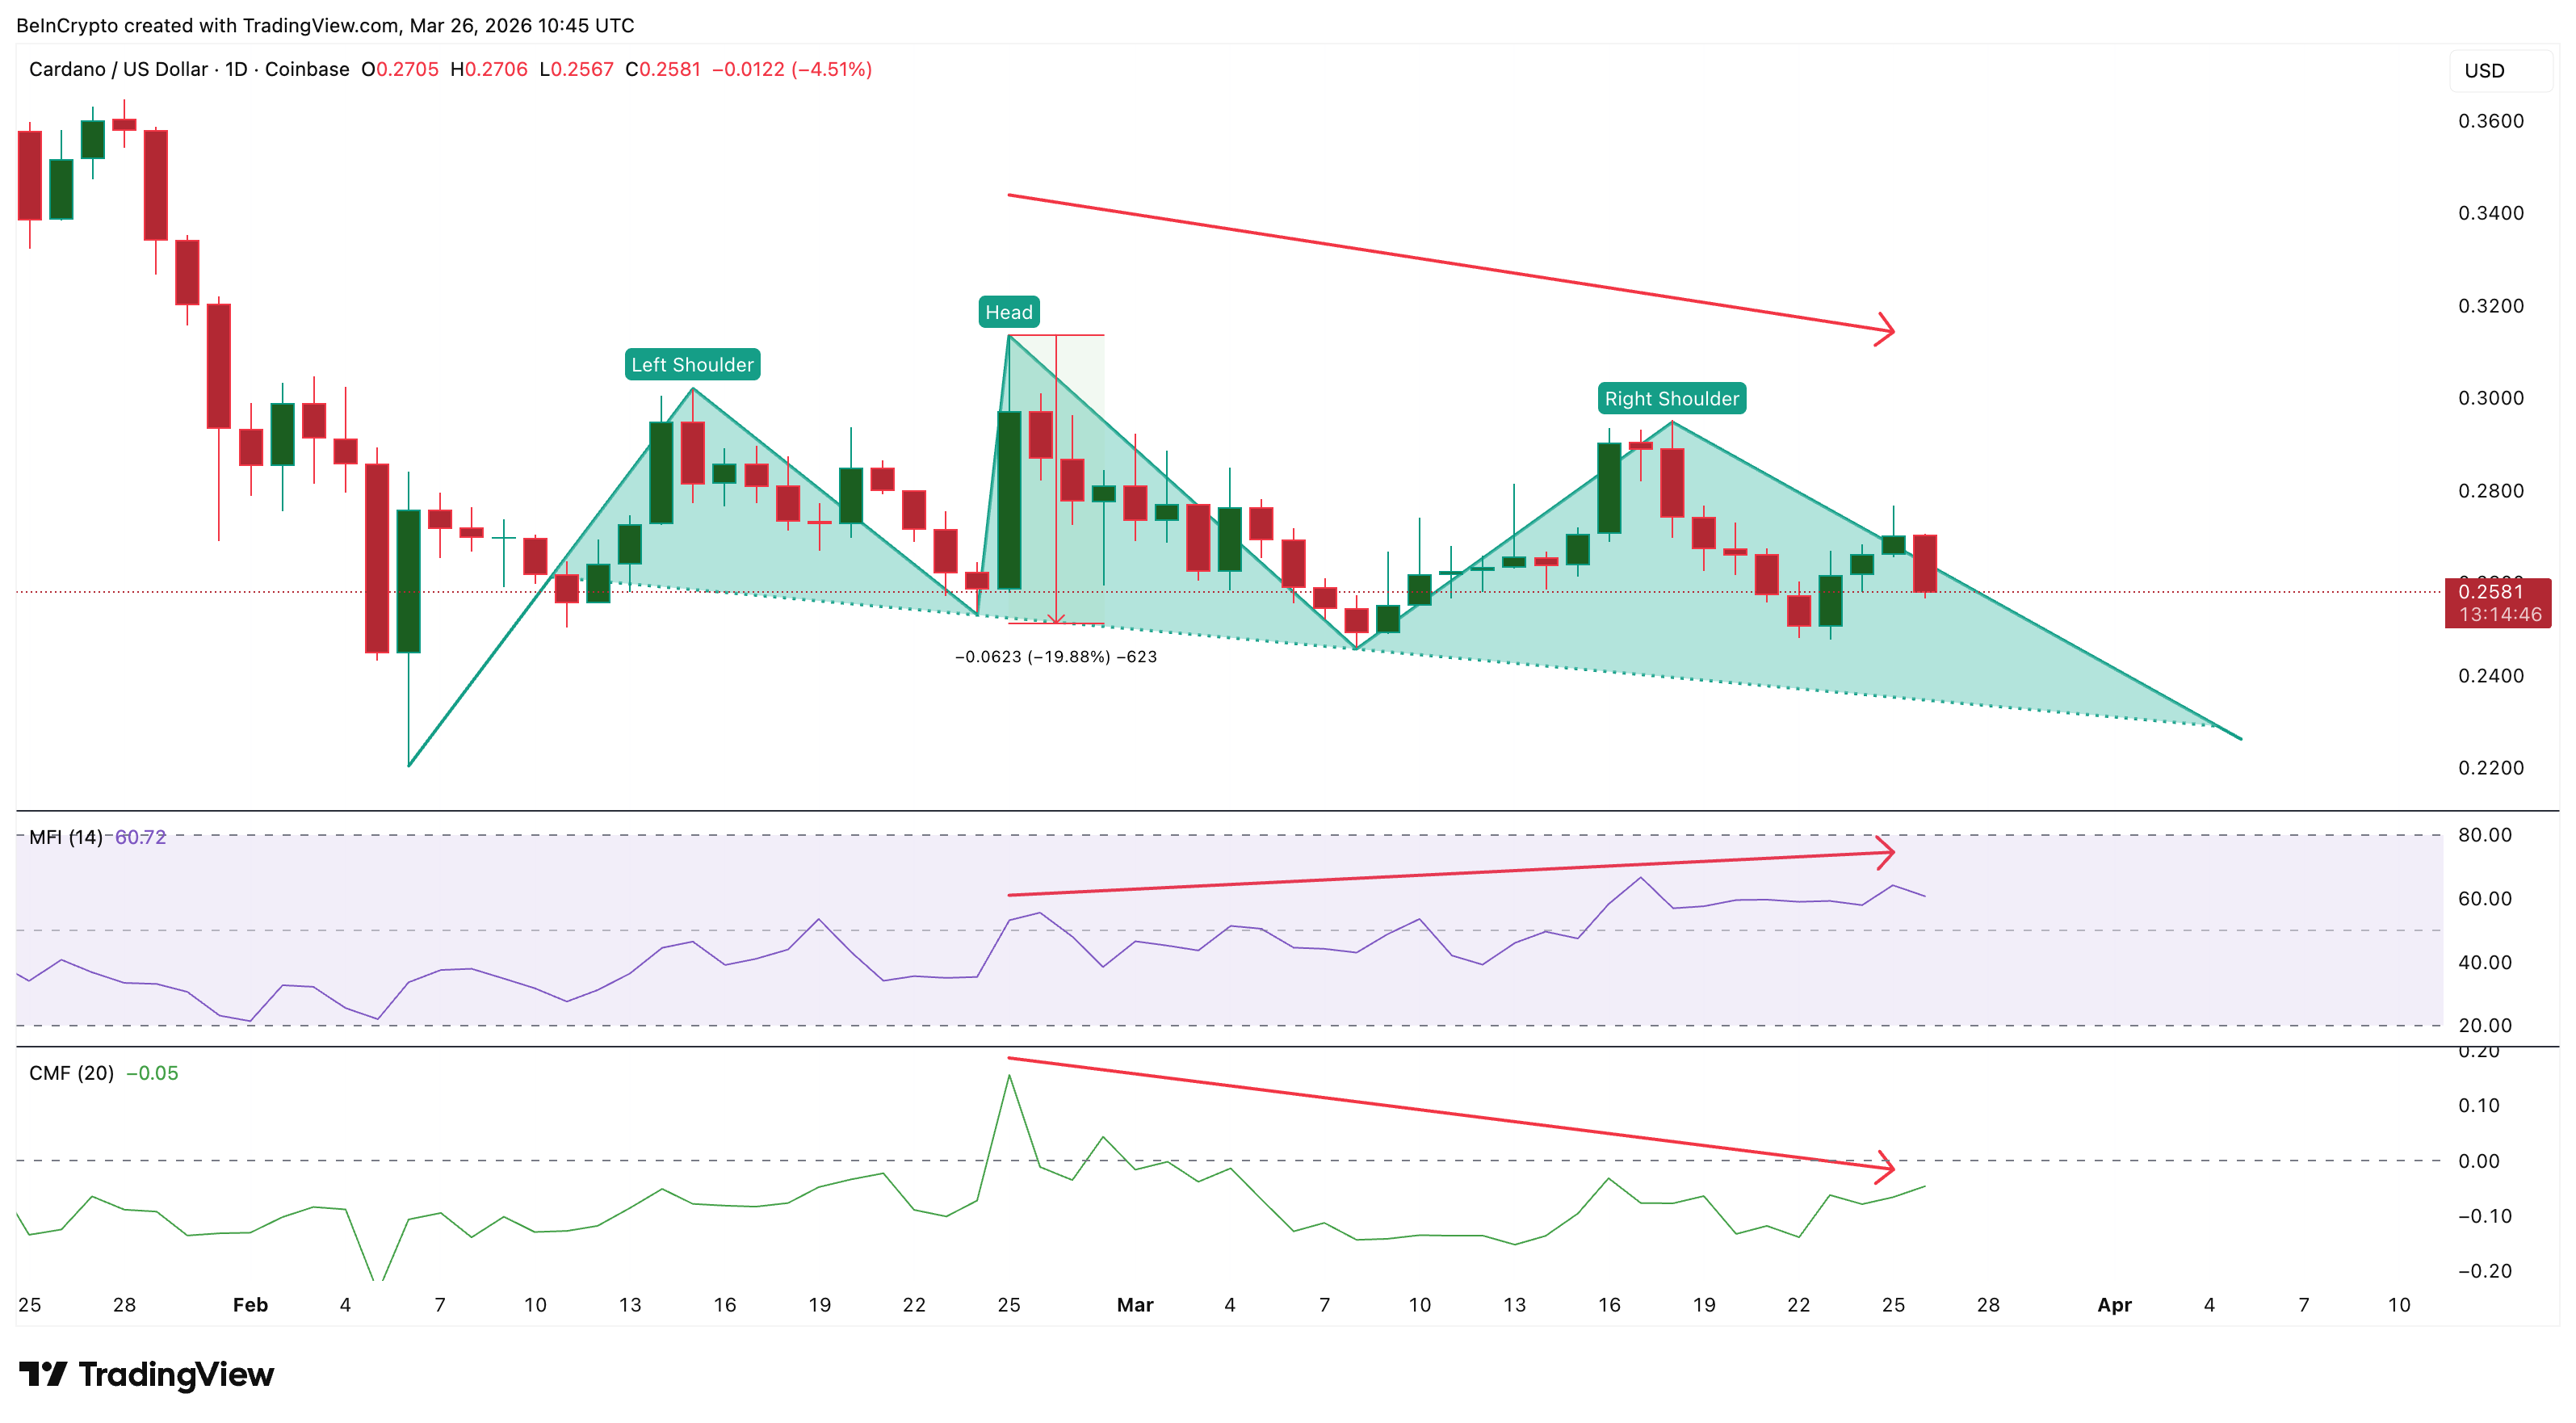
The Money Flow Index (MFI), an oscillator that combines price and volume to gauge dip buying activity, currently reads 60.72 on the daily chart. Between Feb. 25 and March 25, while the ADA price made lower highs, the MFI trended higher. That divergence indicates that volume-weighted buying activity is increasing even as price declines, a signal that dip buyers are absorbing the sell-off.
However, Chaikin Money Flow (CMF), a proxy for big money buying pressure, tells the opposite story. CMF sits at -0.05, below the zero line. Over the same period where MFI trended higher, CMF trended lower, falling from above zero to negative territory. Institutional-grade capital is not supporting the current price.
There is a small positive development. Since March 22, CMF has started to turn higher despite the price correction. If CMF crosses back above zero while MFI holds its uptrend, it would signal that both retail dip buyers and big money are aligned.
Without CMF confirmation, the MFI signal alone may not have enough strength to prevent the breakdown. On-chain profitability data adds more context to who might sell next.
Cardano Price Needs a Key Reclaim to Avoid Breakdown Risk
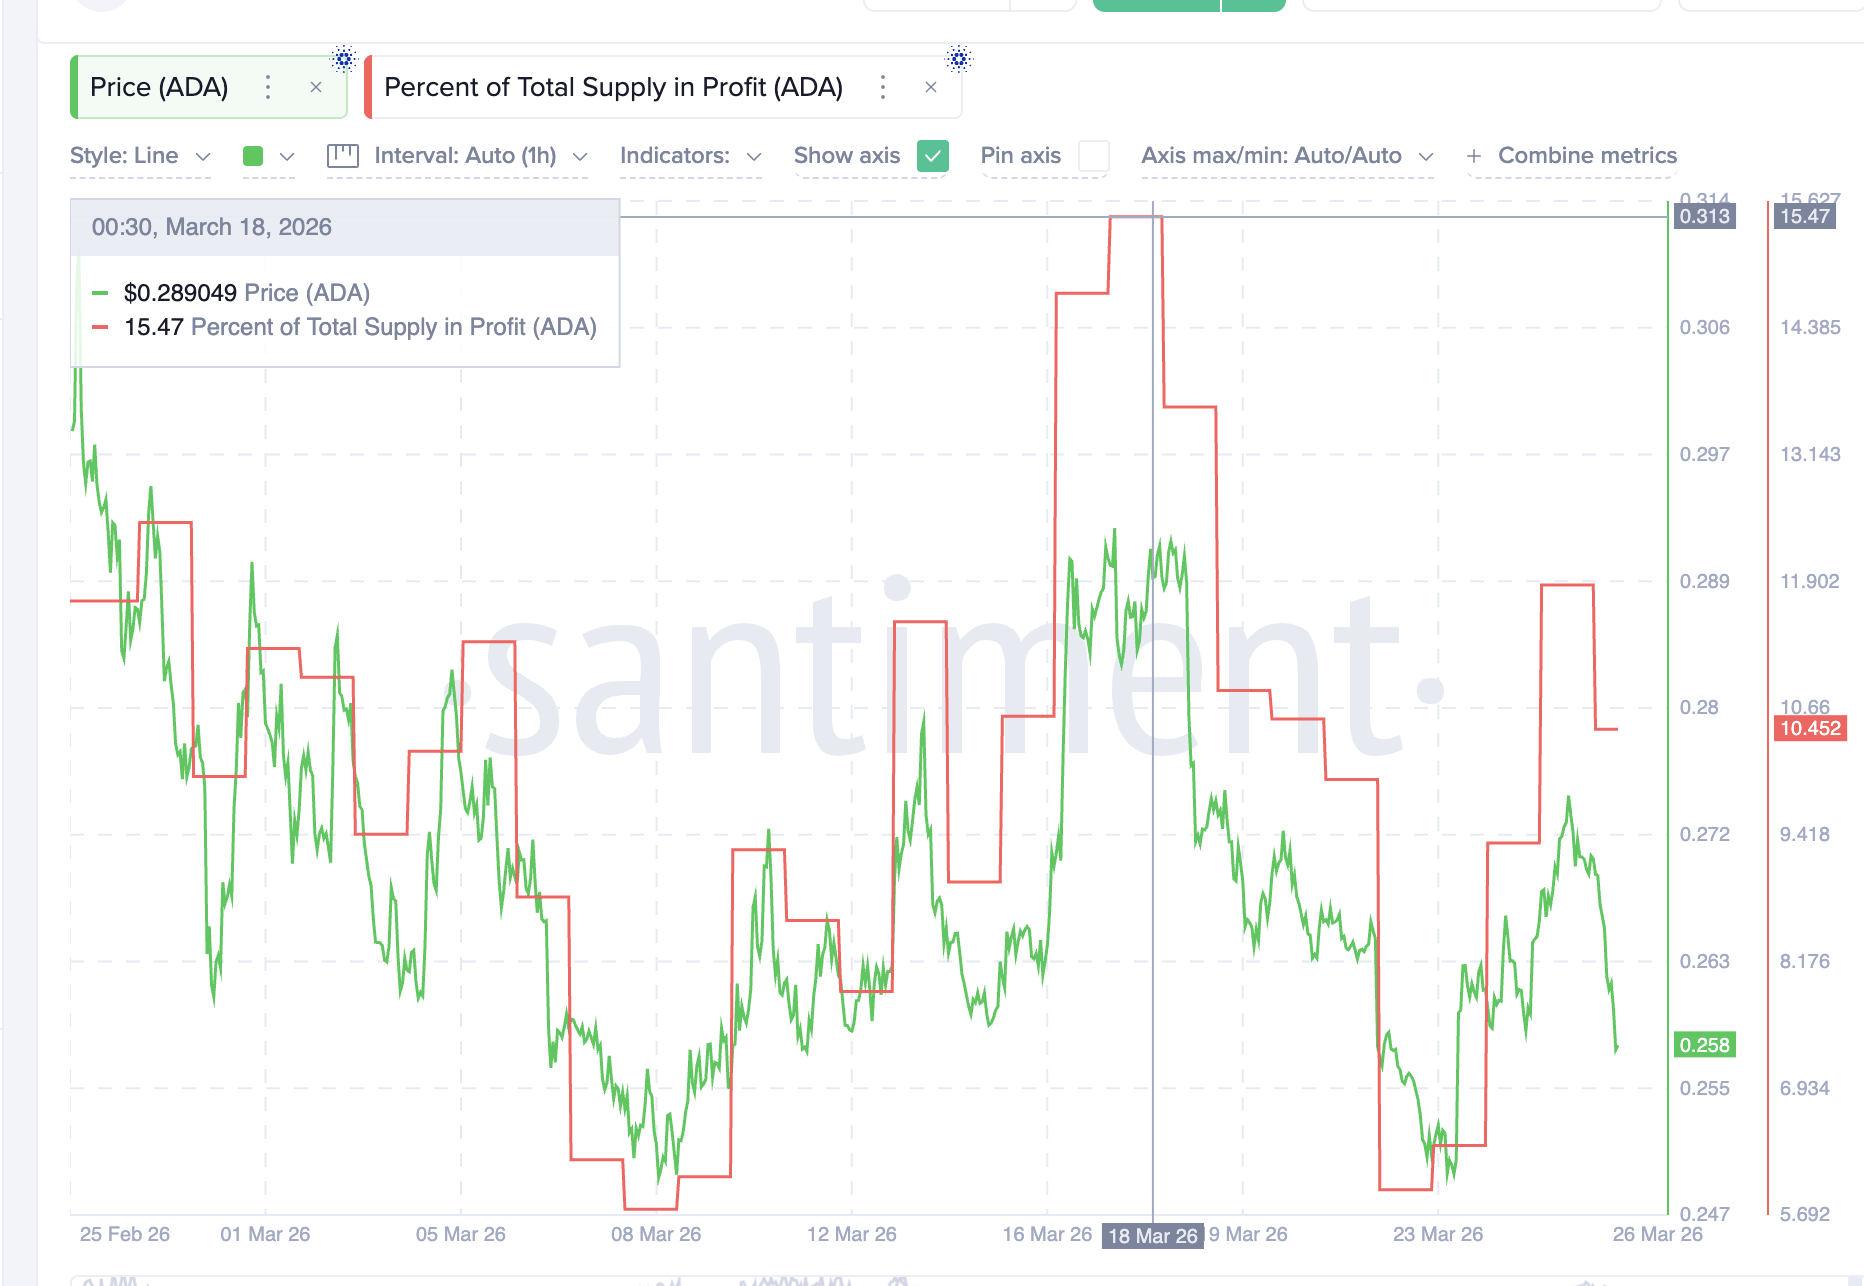
The percentage of ADA supply in profit, tracked by Santiment, has dropped to roughly 10.45% (at press time) from 15.47% on March 18. For context, profitability bottoms over the past month have occurred in the 5.7 to 5.9 zone. The current reading is still well above that range, suggesting additional selling pressure could materialize before a true floor forms.
On March 17, when the right shoulder peaked and triggered the correction that formed the descending leg, profitability was elevated. Current profitability remains above zero, meaning holders who bought during recent dips still carry some unrealized gains. If Cardano price continues to slide toward the neckline, those gains evaporate, and breakeven selling could accelerate the move.
For a recovery, ADA needs to reclaim $0.269, the 0.382 Fibonacci level that was lost today. Strength returns only above $0.295, which would invalidate the right shoulder. That move looks unlikely given that profitability remains elevated enough for holders to distribute, and CMF has not crossed zero.
On the downside, $0.253 a strong technical support. A daily close below it targets $0.241, then $0.227 (the neckline breach confirmation level). If institutional outflows persist, even the $0.185 level becomes a realistic target from the neckline.
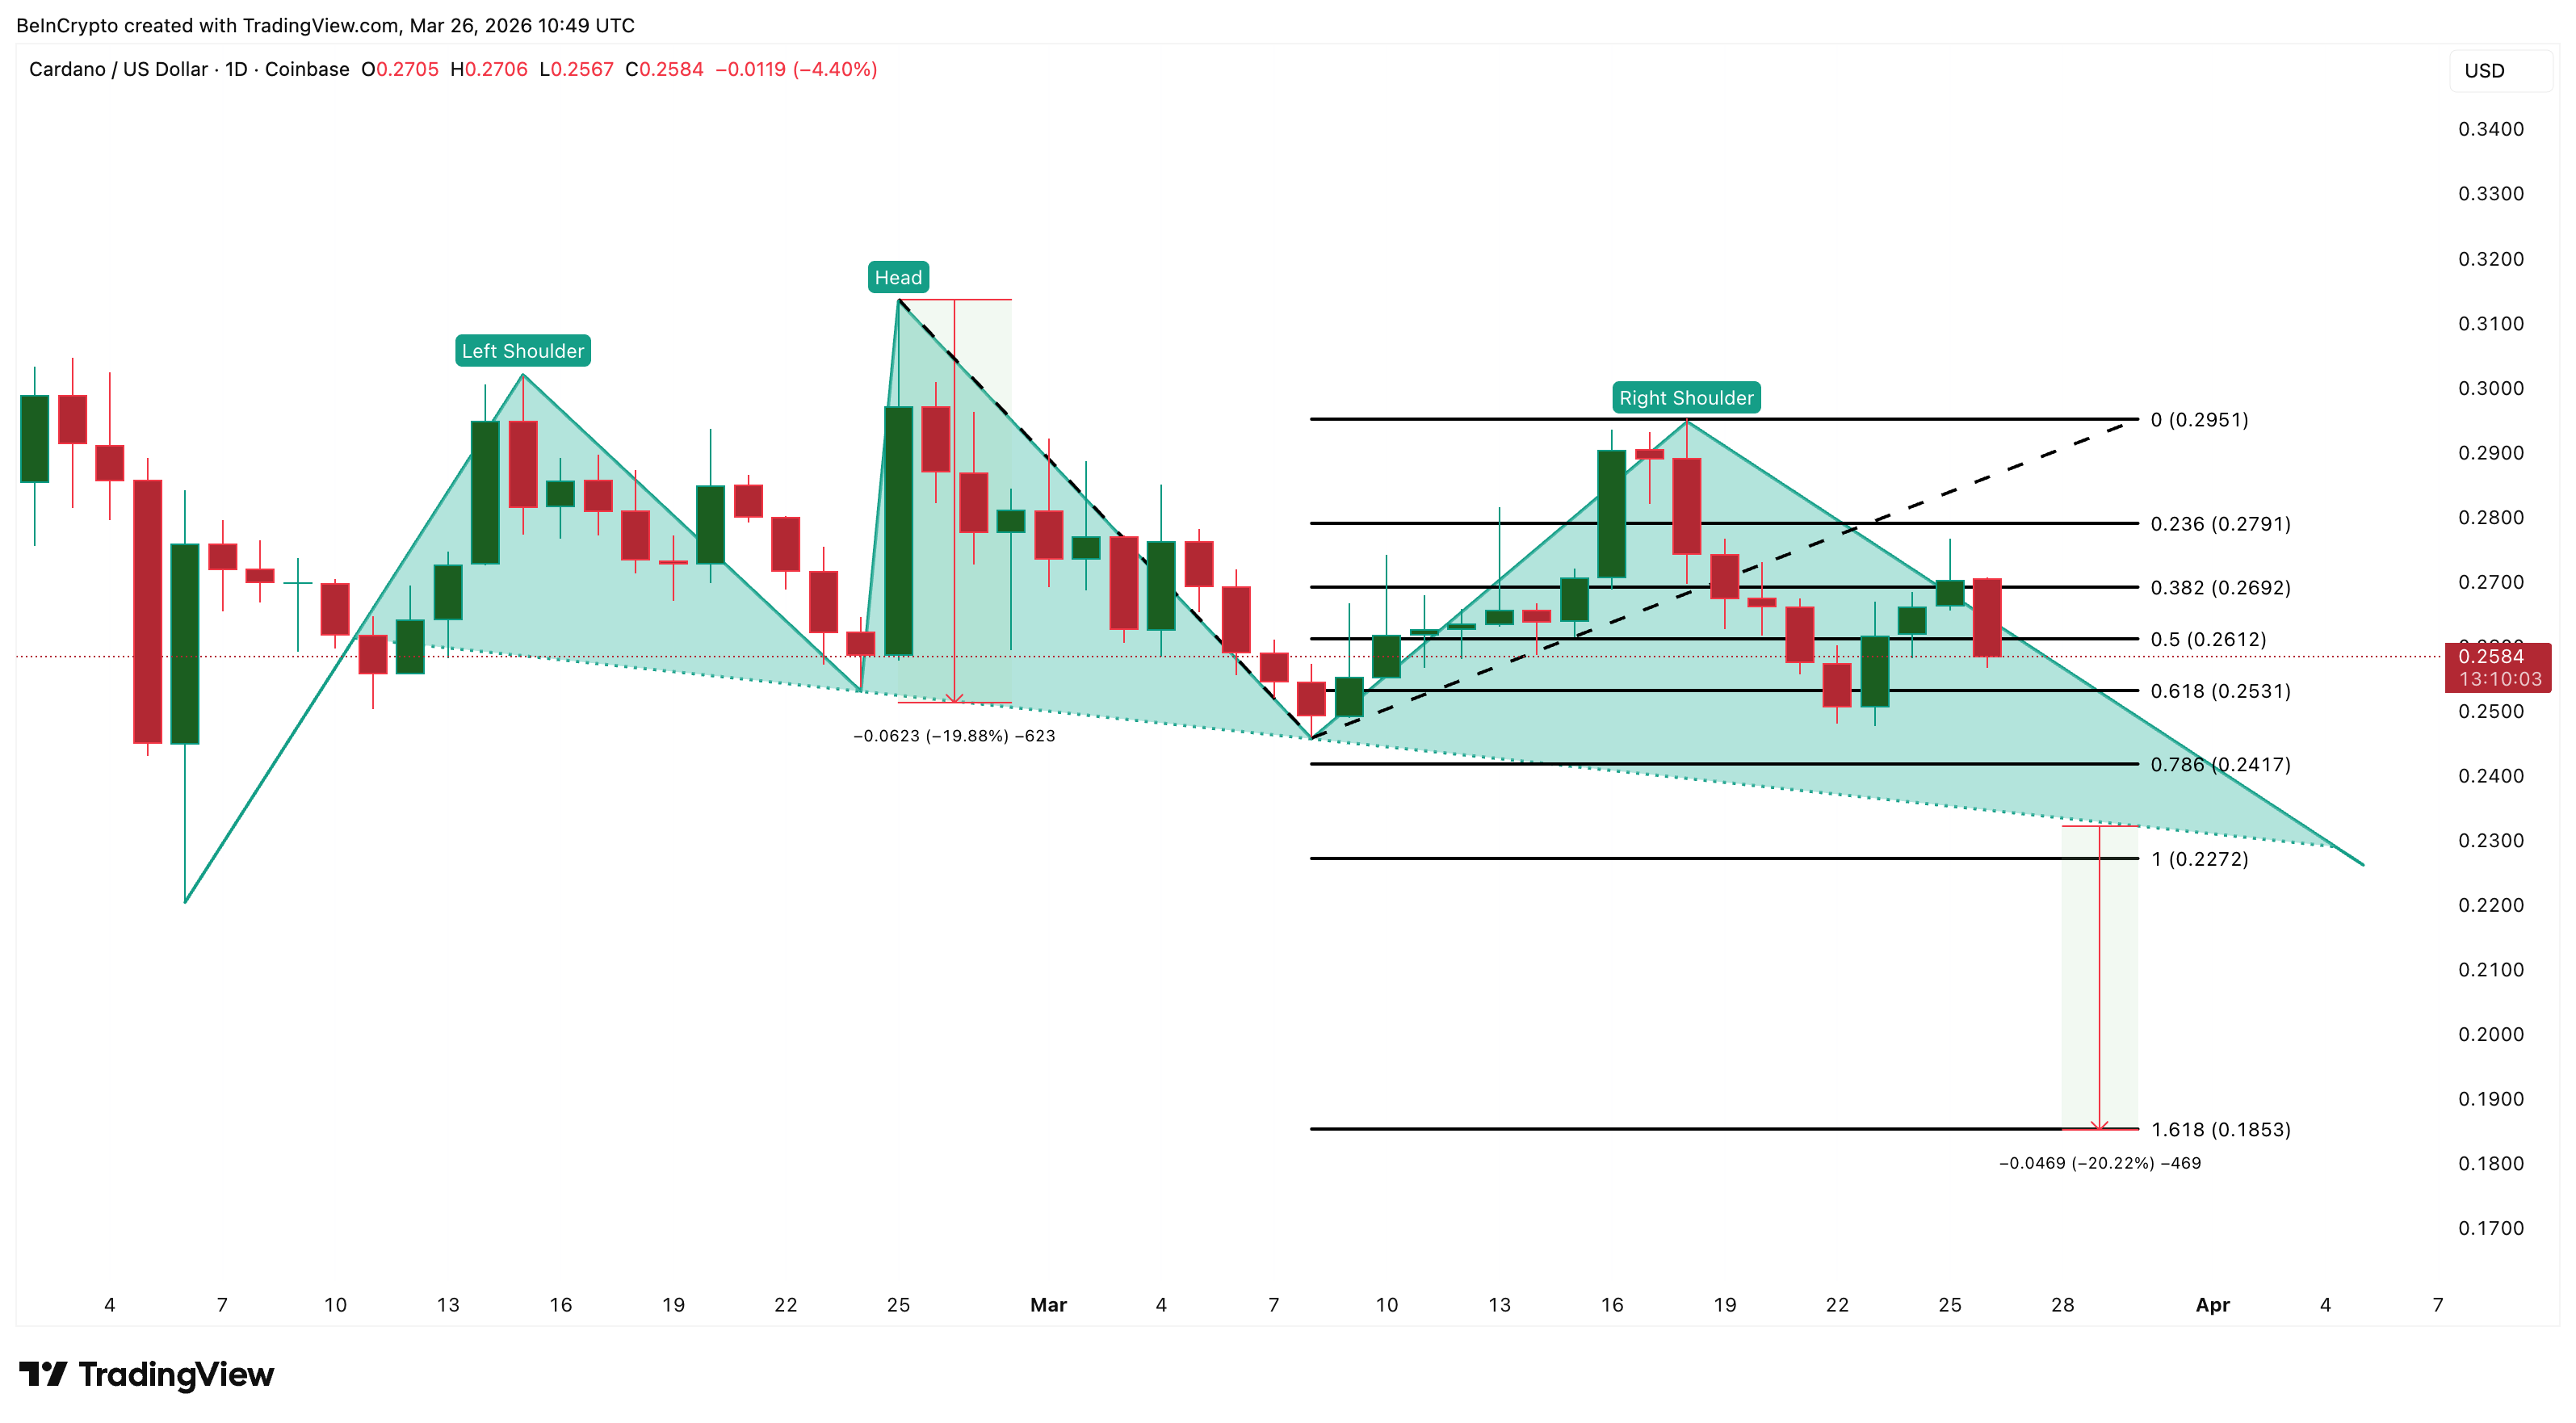
A daily close above $0.269 keeps the head and shoulders pattern from completing, while a break below $0.253 could trigger a 20% measured move toward $0.185, where the selling could finally exhaust.
