


The Cardano (ADA) price has been increasing since Sept 23. While the rise has been significant, the price has yet to move above a crucial resistance level.
Therefore, the current rally may be a retracement rather than the beginning of a new upward trend.
ADA Tests Resistance
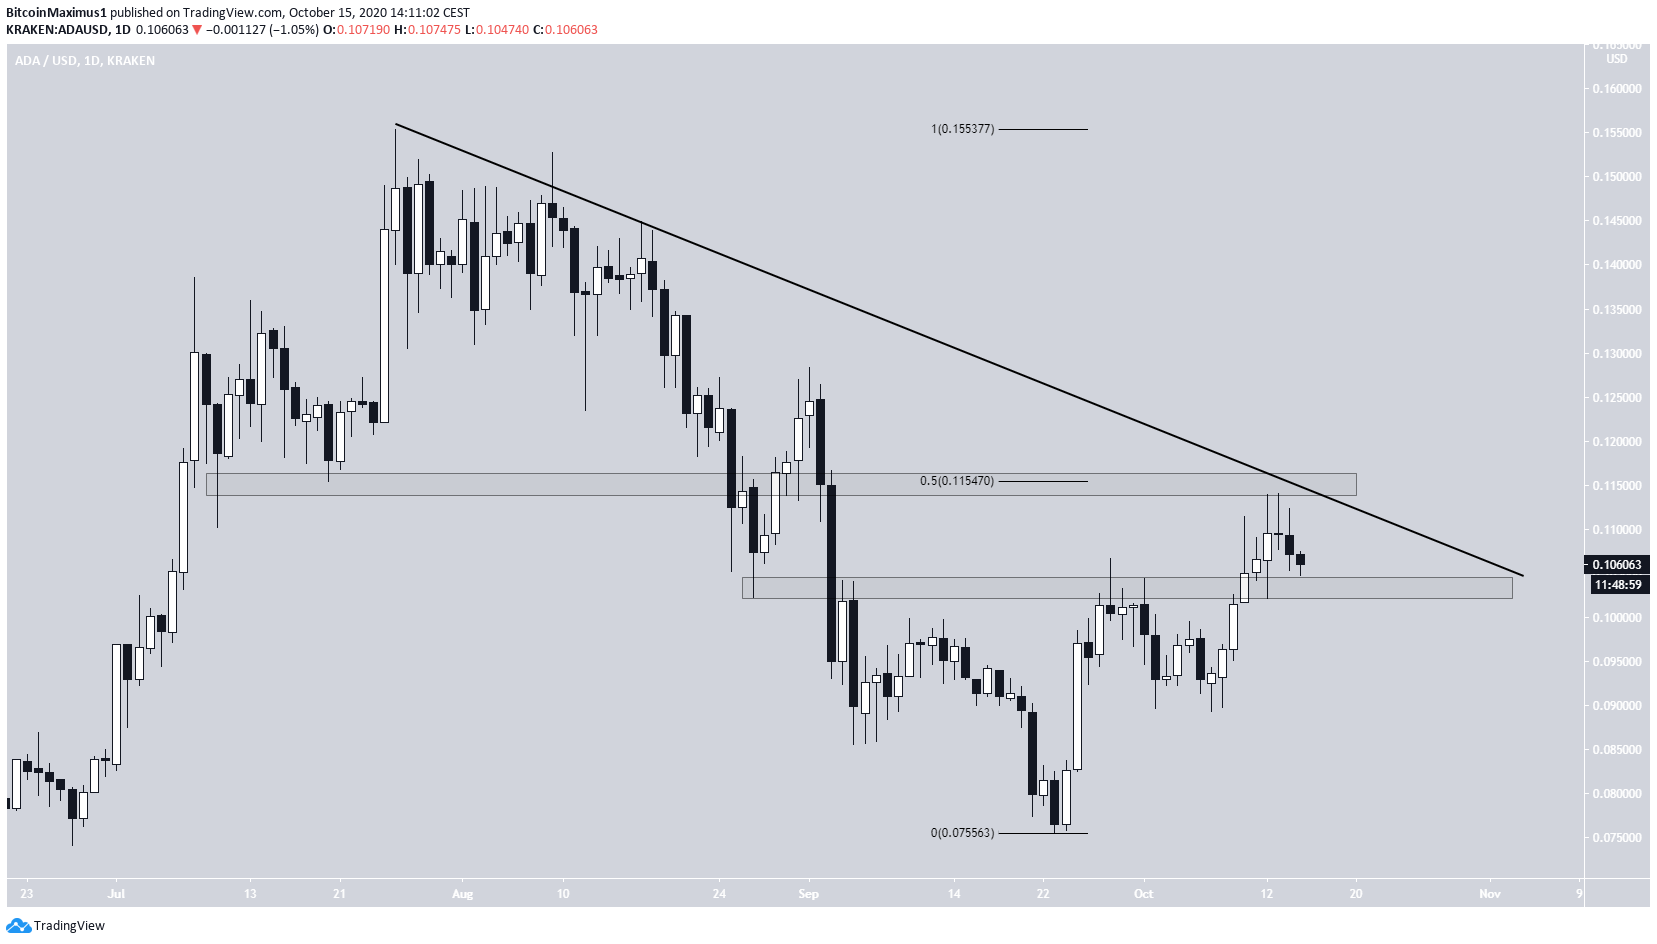
The ADA price has been moving downwards since it reached a high of $0.154 on July 24. The price reached a local low of $0.075 on Sept 23. Afterward, the price began an upward move that is still ongoing.
On Oct 13, the price reached a high of $0.114. This was significant since it validated both the 0.5 Fib level of the entire fall ($0.115) and a descending resistance line drawn since the previous July 24 high.
The price was rejected and is currently trading between the resistance area/line and the minor $0.103 support area.
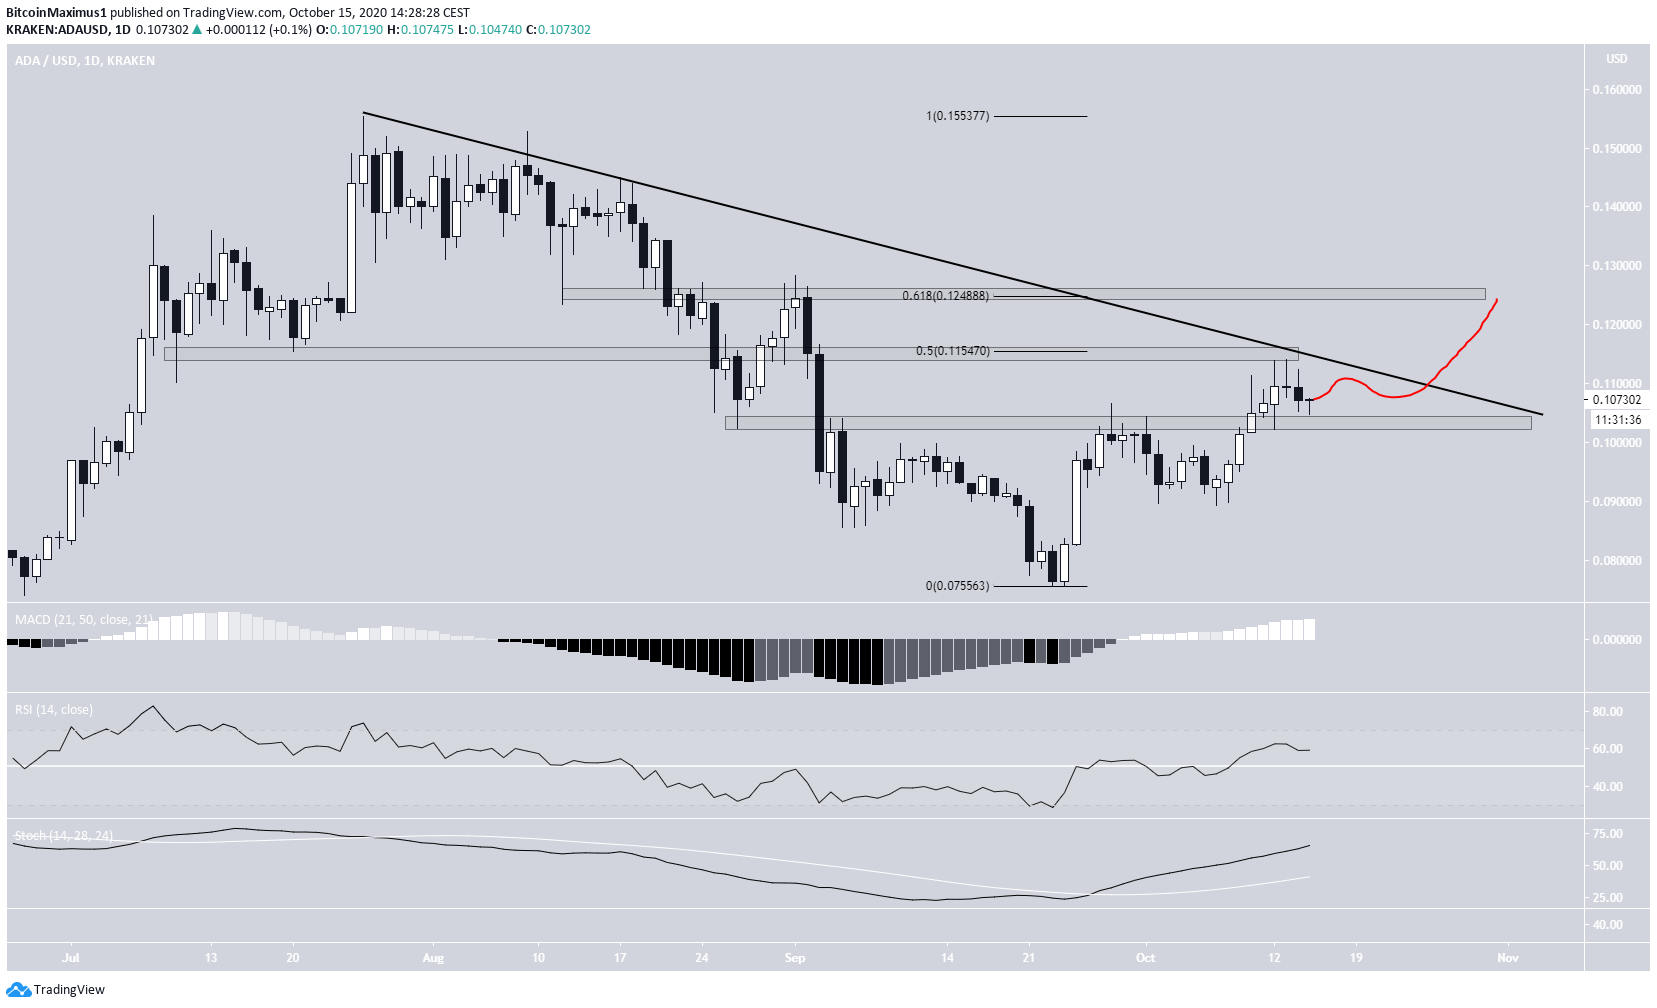
Technical indicators on the daily time-frame are bullish. All three of the MACD, RSI, and Stochastic Oscillator are increasing. In addition, there is no bearish divergence in place. The MACD has crossed into positive territory, and the Stochastic Oscillator has made a bullish cross.
Therefore, the most likely scenario would be a breakout and rally towards the next resistance area at $0.124.
Wave Count
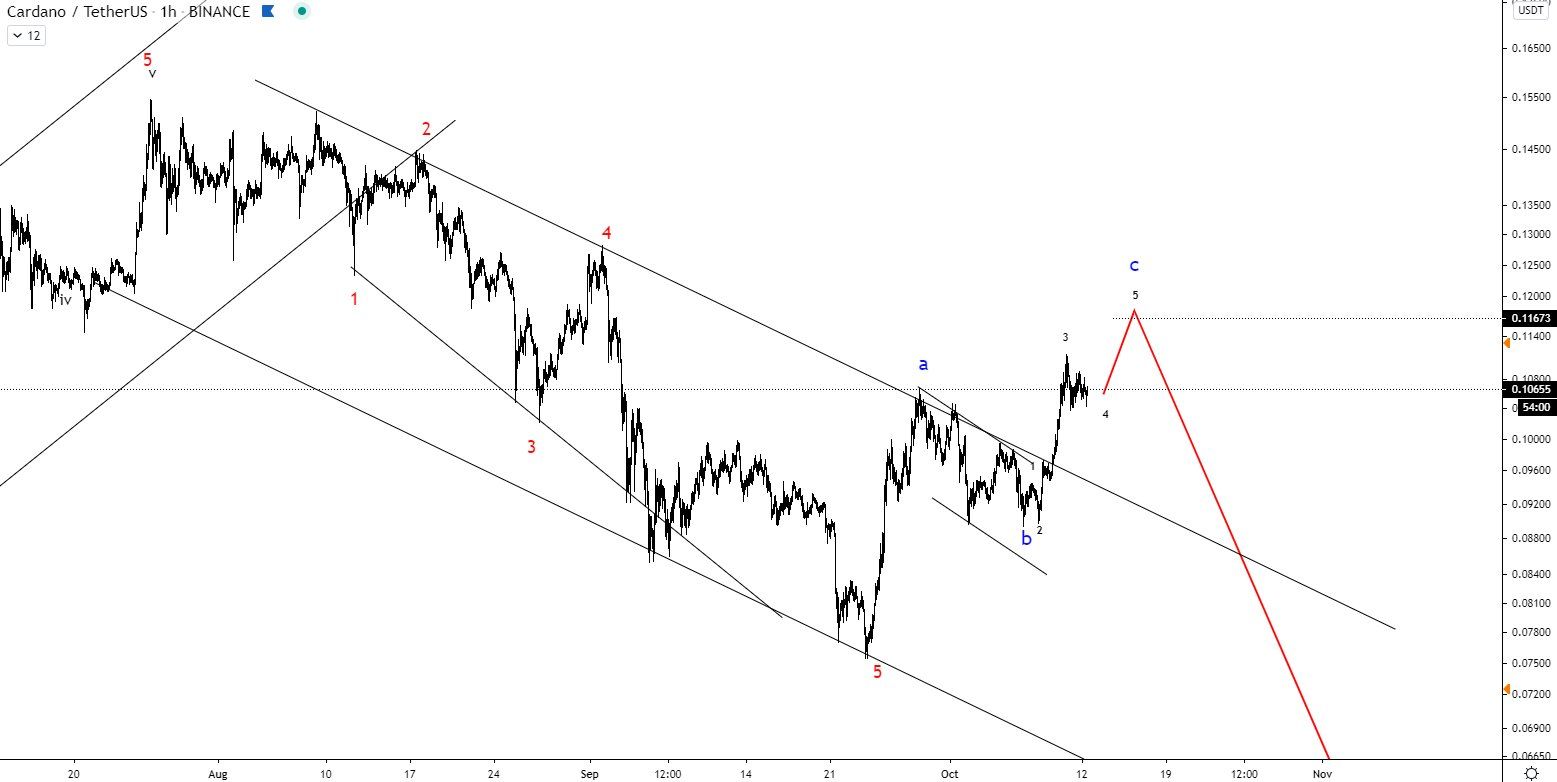
Cryptocurrency trader @Crypto618 outlined an ADA chart in which a rally towards $0.11 followed by a massive drop is projected.
In BeinCrypto’s Sept 28 analysis, it was stated that:
“The previously mentioned $0.125 resistance area also coincides with a descending resistance line drawn from the Jul, 24 high. So until the price successfully breaks out, the current move could be a correction rather than the beginning of a new upward trend.”
The price has since approached this area but has yet to move above it.
The move since the Sept 24 low resembles an A-B-C correction (shown in black below), in which the price is completing the C wave. If the A:C waves have a 1:1 ratio, the price would reach a high of $0.12045 before falling.
The sub-wave count for the C wave is shown in red below. The price appears only to have the fifth sub-wave to complete, after which a downward move is likely.
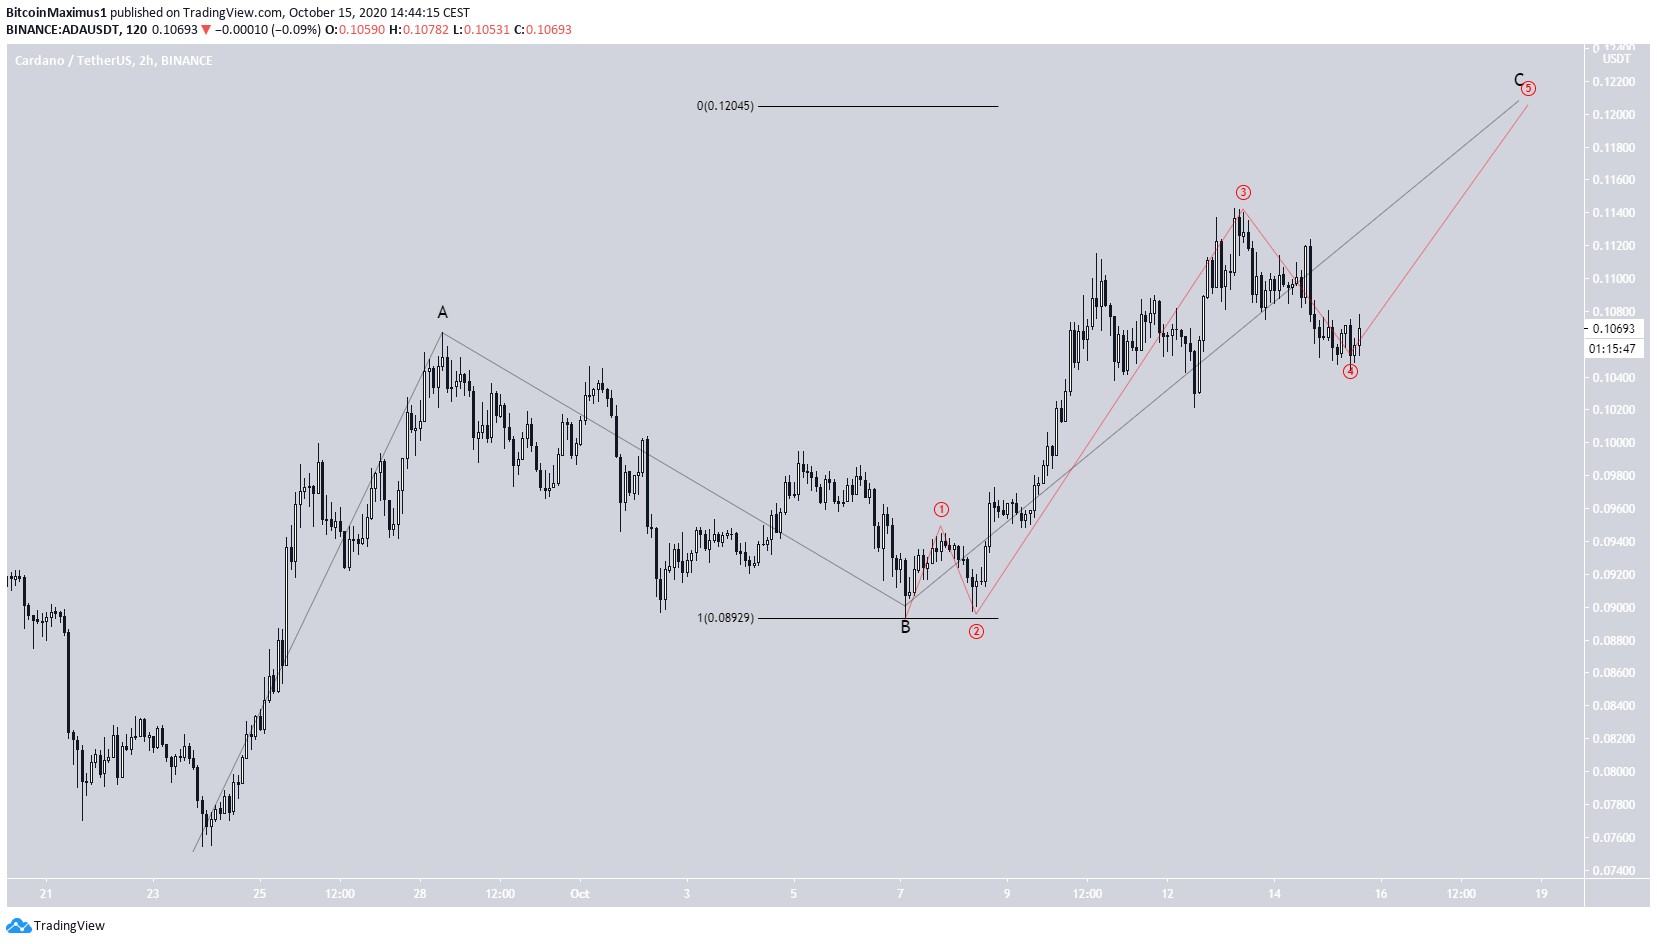
To conclude, the ADA price should rally towards $0.12 before falling once more.
For BeInCrypto’s latest Bitcoin analysis, click here!
Disclaimer: Cryptocurrency trading carries a high level of risk and may not be suitable for all investors. The views expressed in this article do not reflect those of BeInCrypto.


