


While Cardano (ADA) is showing bullish signs in the weekly time frame, it is trading inside a neutral pattern with a bearish daily RSI.
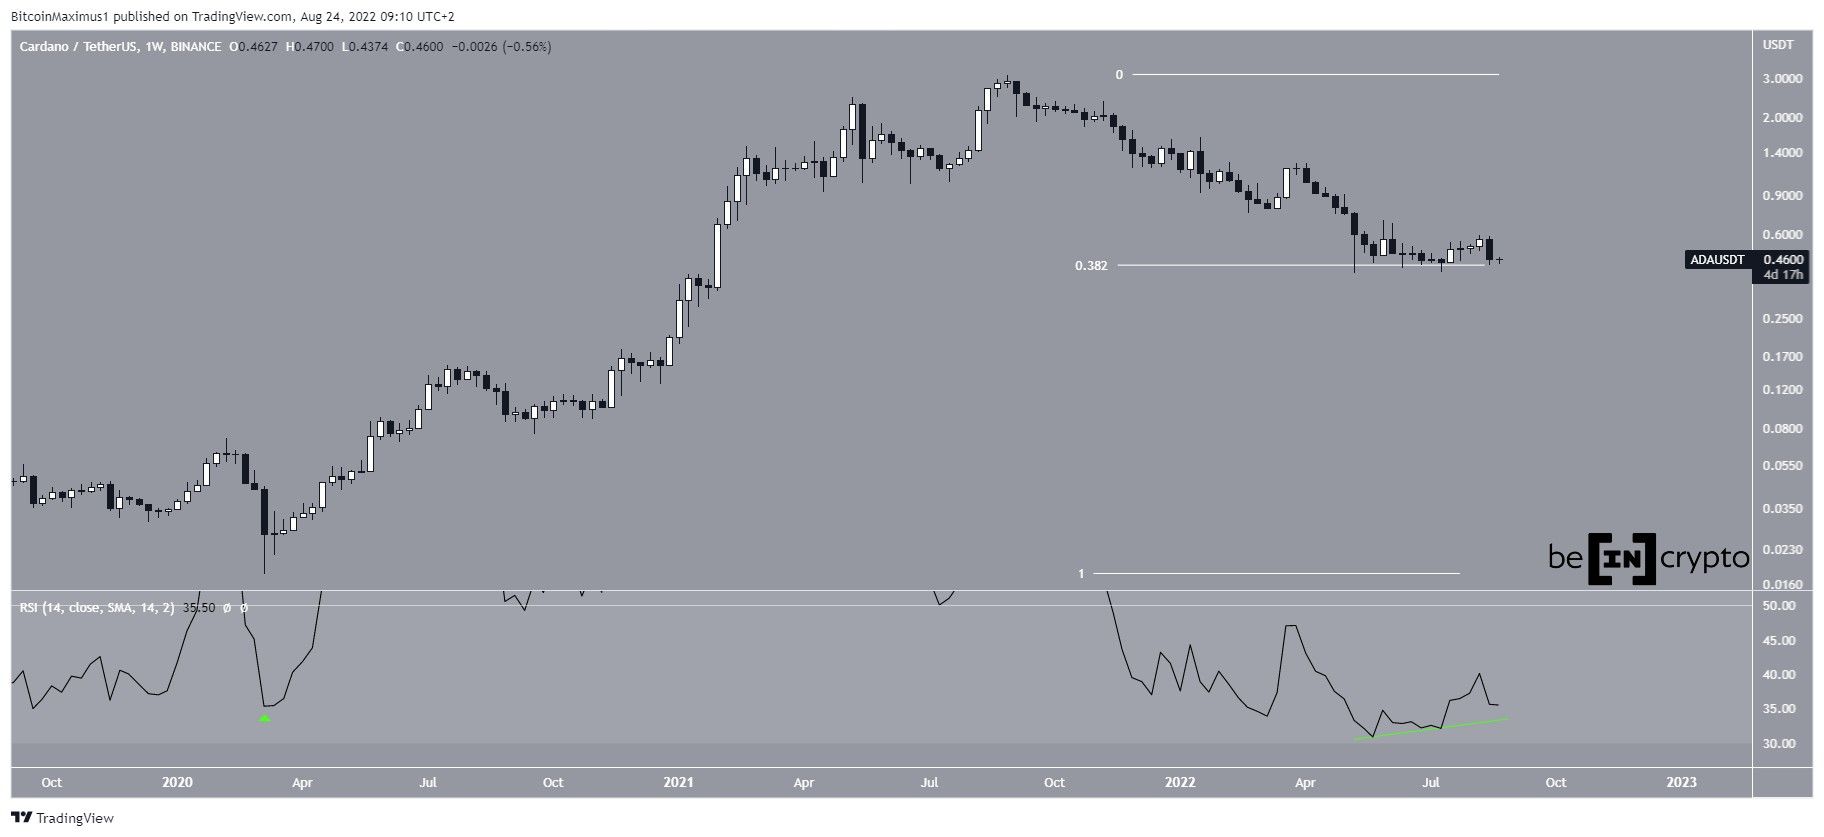
ADA has been falling since reaching an all-time high price of $3.10 in Aug 2021. The downward movement has so far led to a low of $0.40 in May 2022.
The price bounced afterwards but failed to initiate a significant upward movement. So, it is still trading close to the same level.
Nevertheless, ADA is trading just above the 0.382 Fib retracement support level when measuring the entire upward movement.
Furthermore, the weekly RSI has begun to generate bullish divergence. Additionally, it is considerably lower than it was on March 2020 (green icon), when the entire upward movement began.
Therefore, while the price movement is not that bullish, the RSI readings indicate that a long-term bottom could be close.
Current pattern
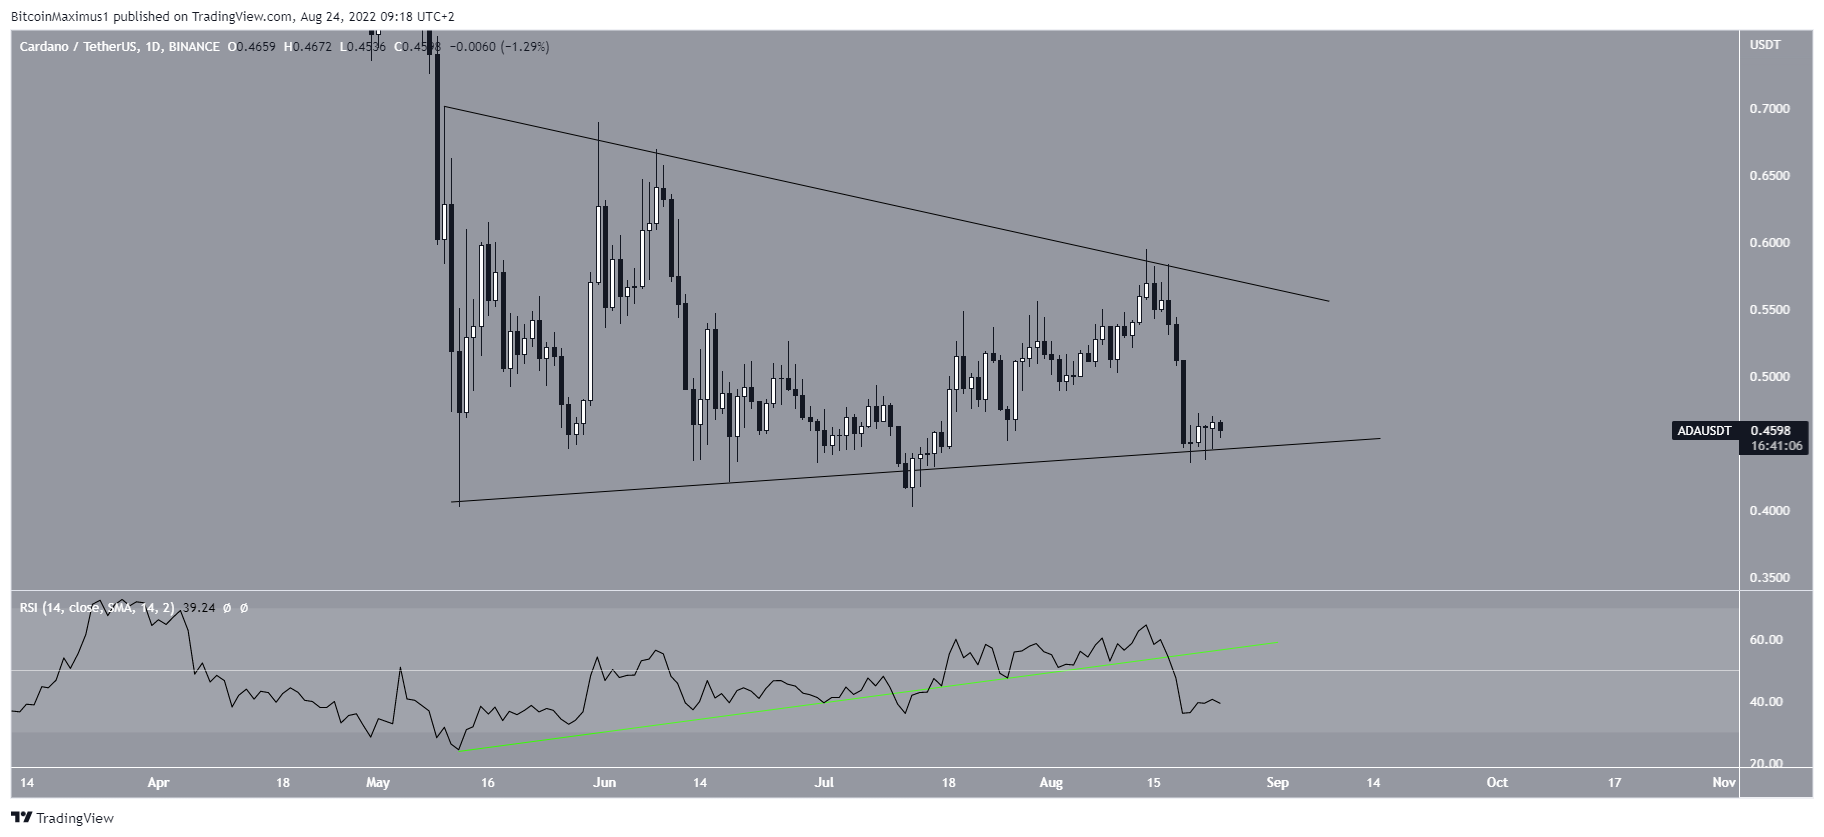
The daily chart shows that the price has been trading inside a symmetrical triangle since the May 12 bottom. Such triangles are considered neutral patterns, meaning that both a breakout and a breakdown remain valid possibilities.
However, the triangle is transpiring after a downward movement, thus an eventual breakdown would be more likely.
Furthermore, the daily RSI has broken down from an ascending support line (green line) and is now below 50.
So, unlike the weekly time frame, which provides a bullish outlook, the daily time frame is bearish.
ADA wave count analysis
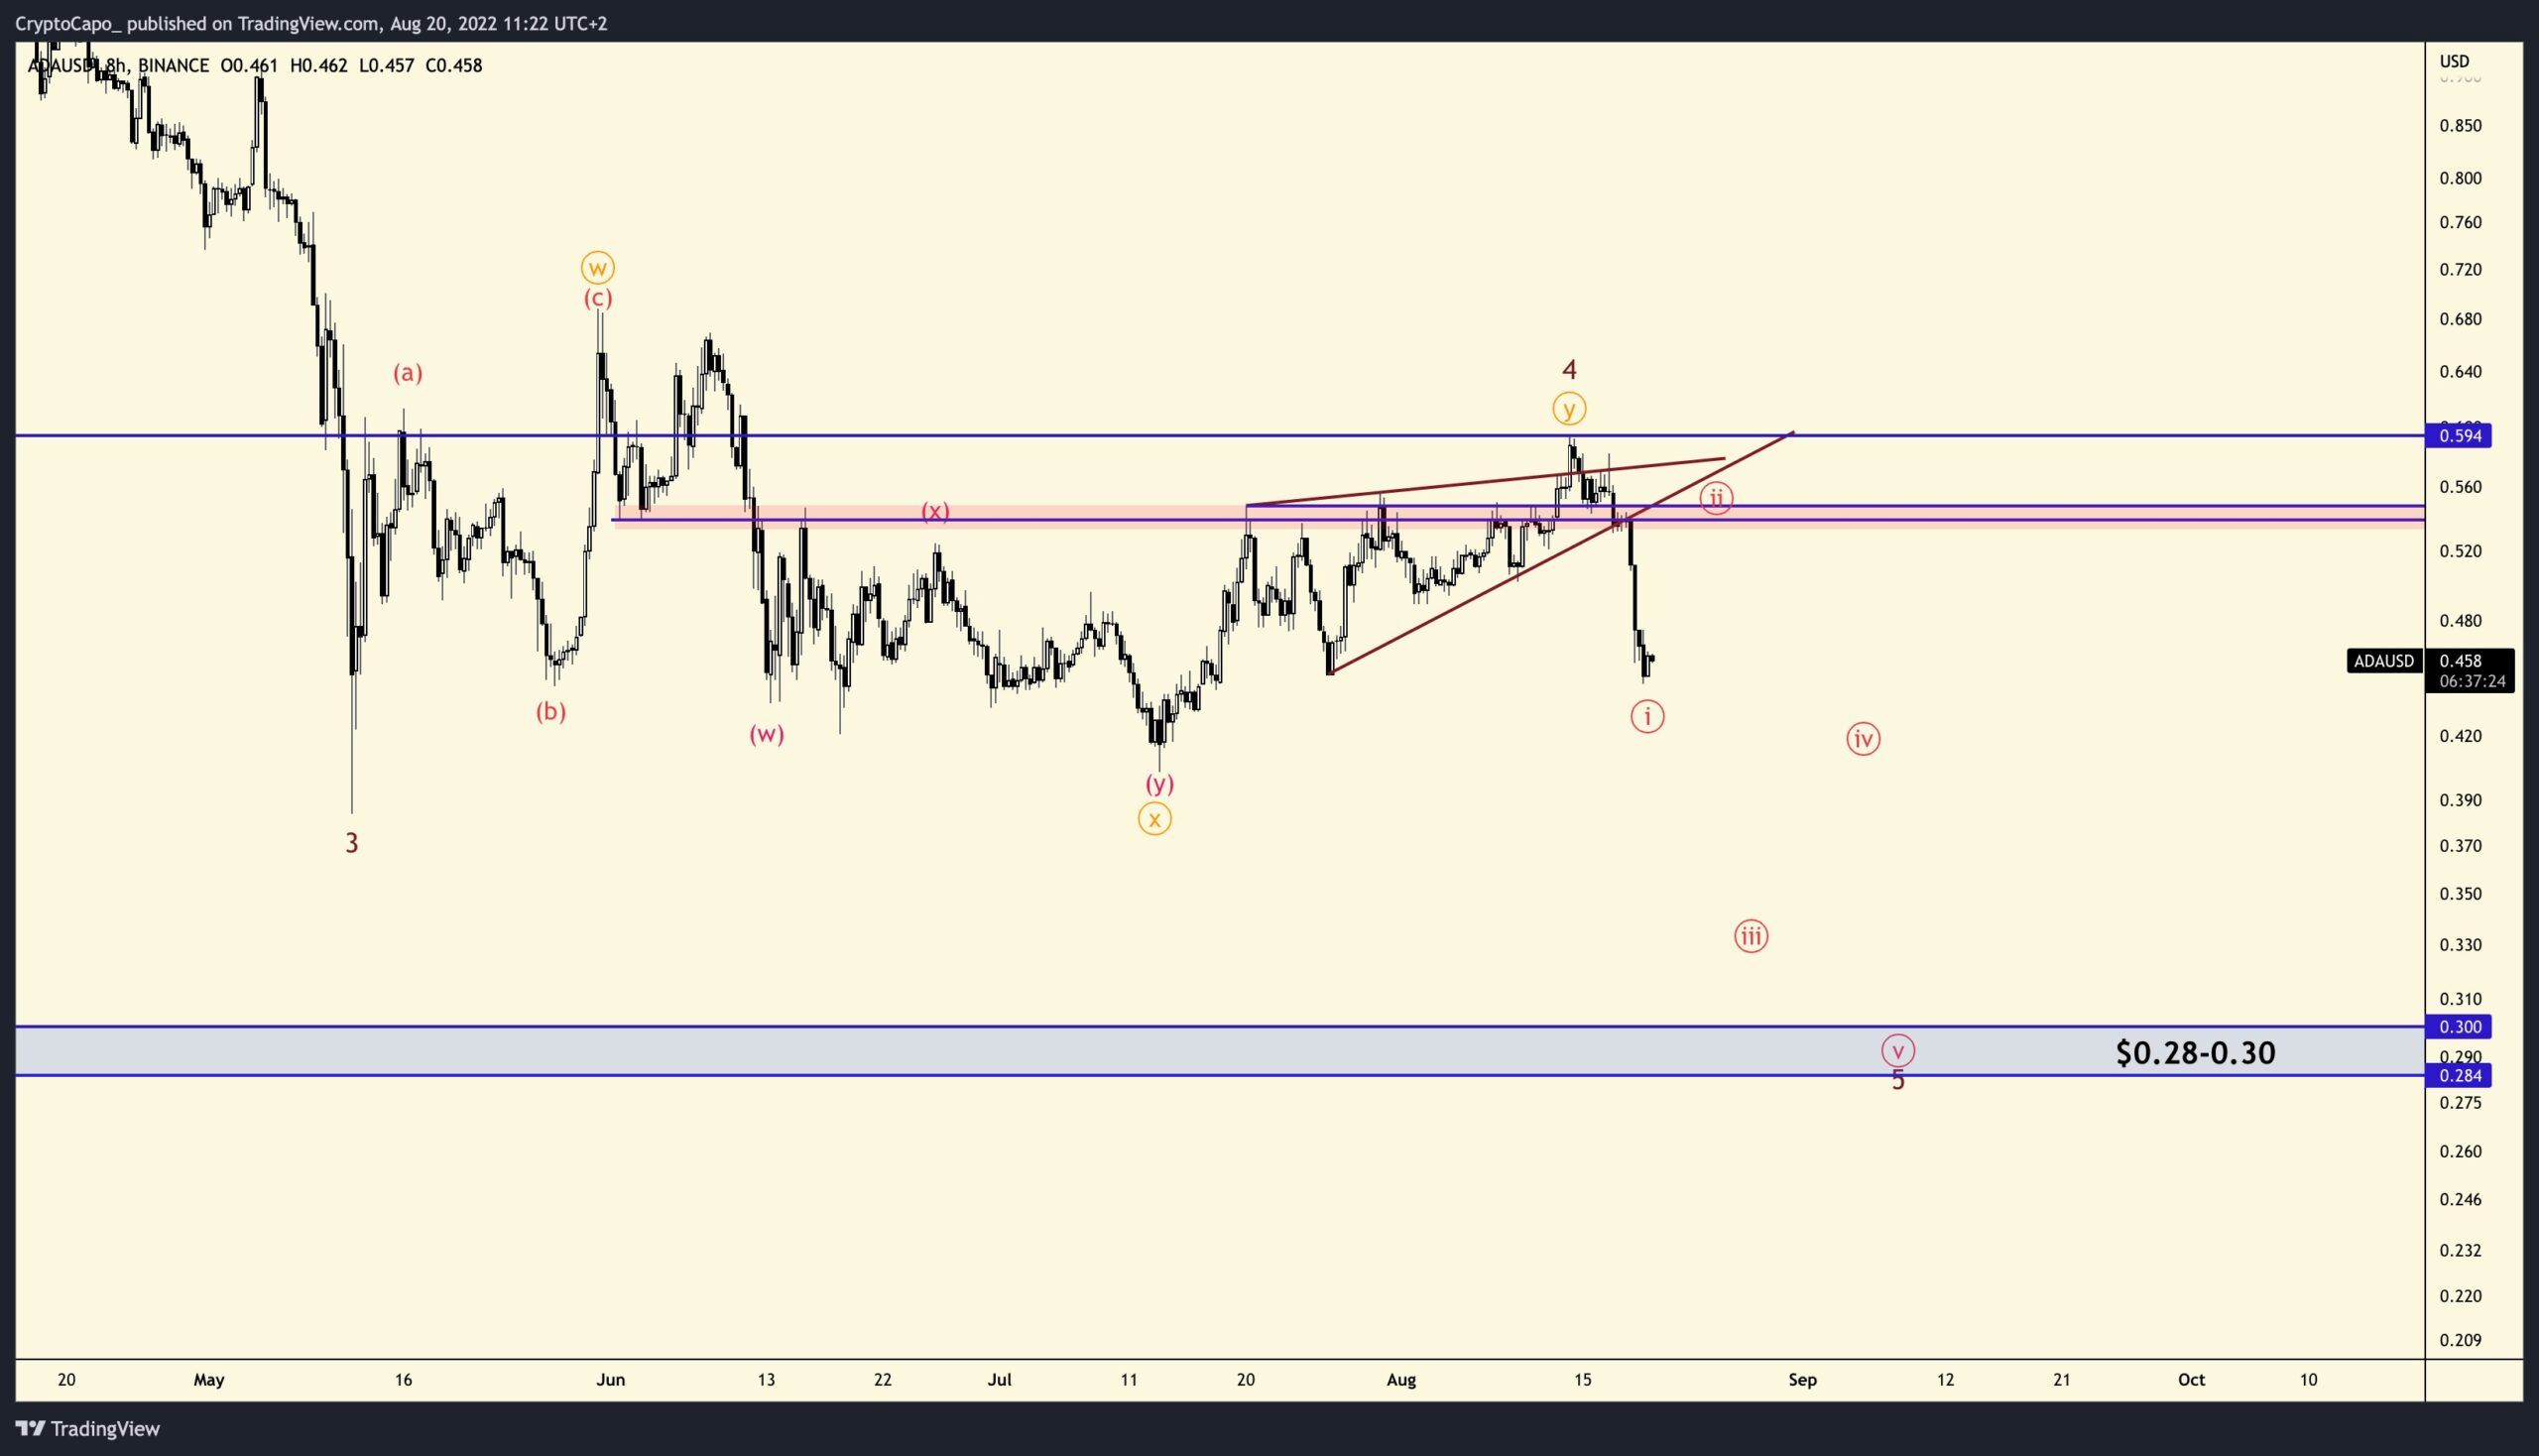
Cryptocurrency trader @CryptoCapo_ tweeted a chart of ADA, stating that the price will soon complete a five wave downward movement.
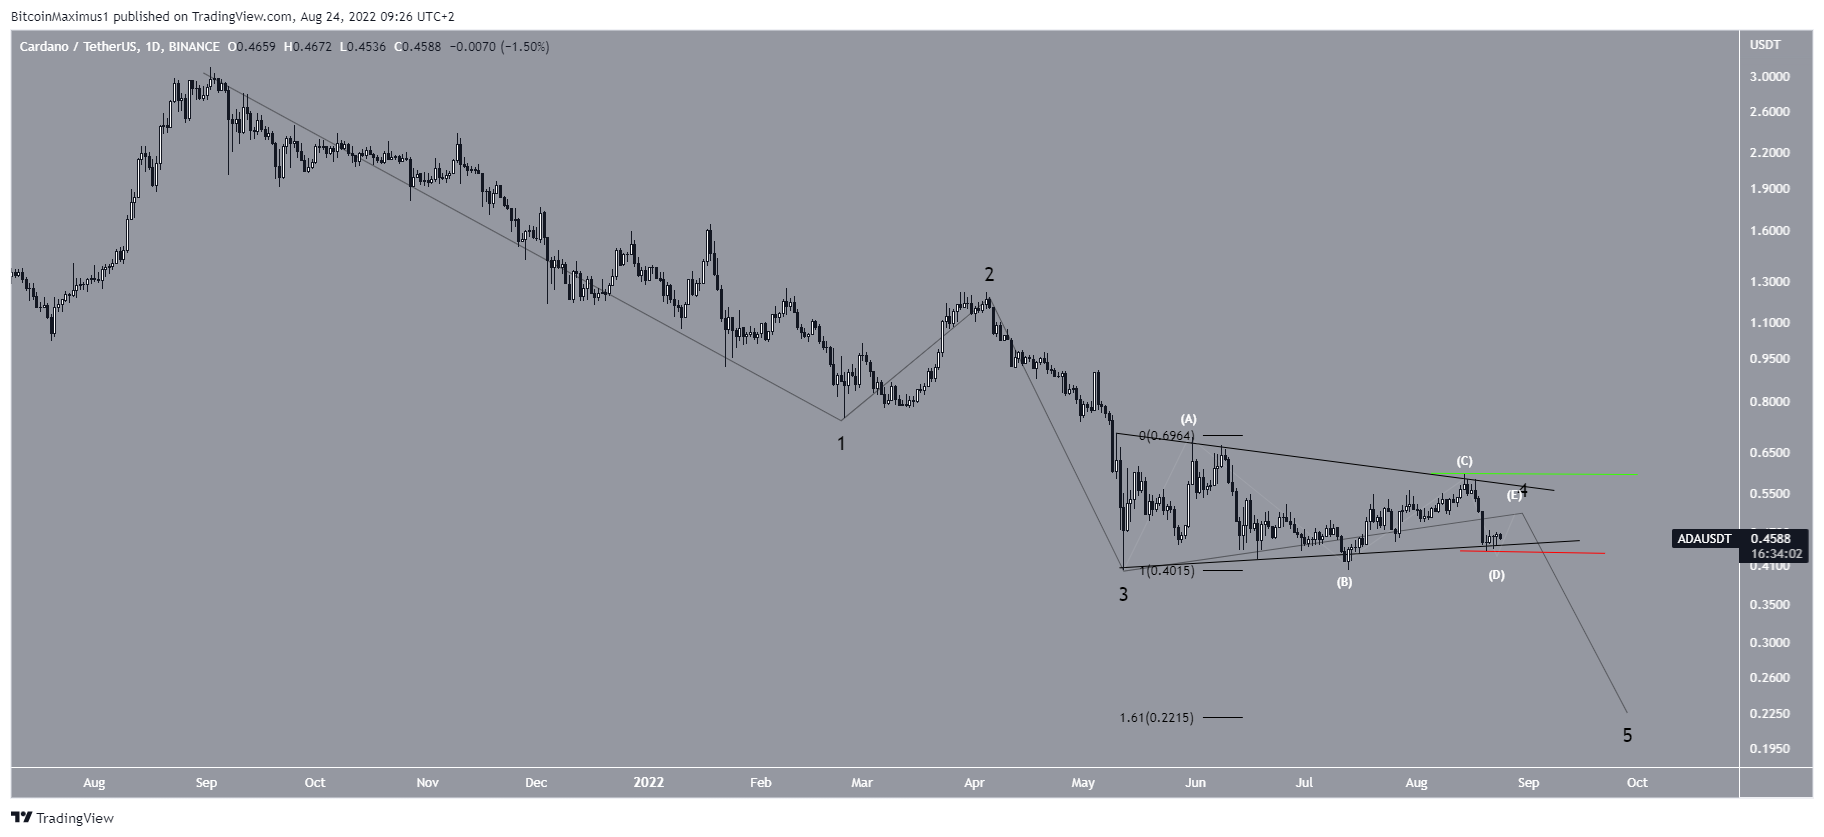
Due to the presence of the triangle, the most likely wave count suggests that the price is in wave four (black) of a five-wave downward movement that began with the all-time high.
A decrease below $0.43 (red line) would confirm this count while an increase above $0.59 (green line) would invalidate it.
If ADA breaks down, the first target for the bottom of the movement would be at $0.24, created by the 1.61 external Fib retracement level.
For Be[in]Crypto’s latest Bitcoin (BTC) analysis, click here


