


The Cardano (ADA) price is trading slightly below a long-term horizontal support area. A decisive drop below it could catalyze a decrease to $0.16.
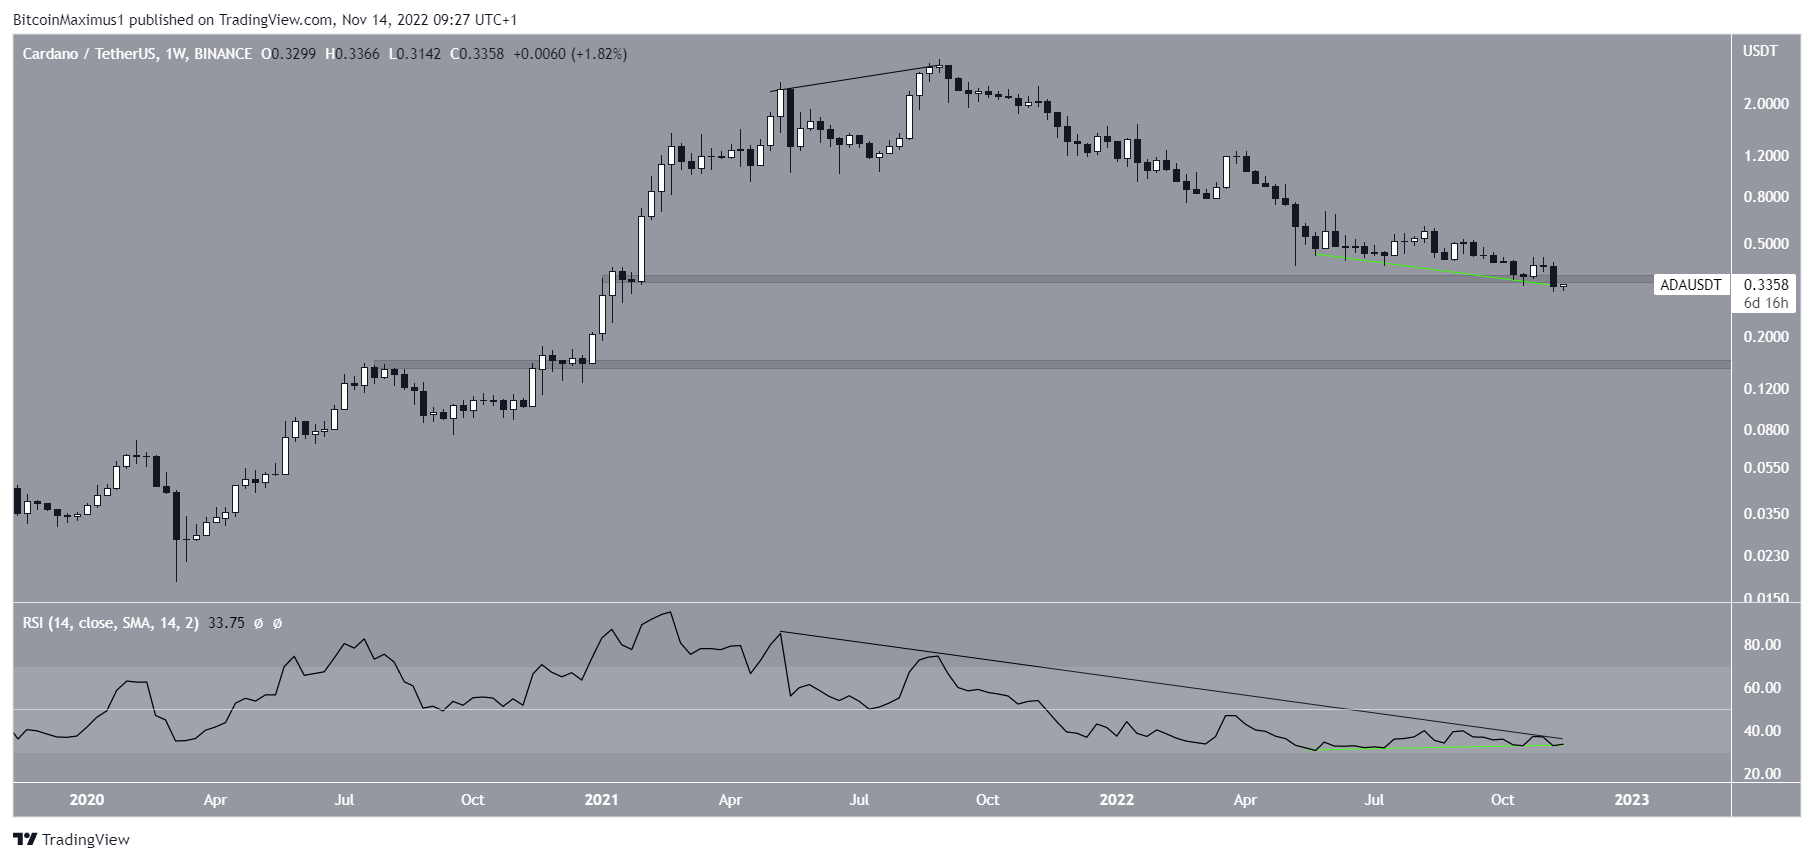
The Cardano (ADA) price has decreased since reaching a maximum price of $3.10 on Aug. 2021. The downward movement led to a minimum price of $0.31 in Nov. 2022. Despite this low, the Cardano price is still trading close to the long-term $0.35 horizontal support area.
While there was no negative Cardano news to affect the price, the entire decrease was preceded by a bearish divergence in the weekly RSI (black line). The trend line of the divergence is still intact.
However, the weekly RSI has also generated a bullish divergence since the beginning of May. The trend line of this divergence is also still intact (green line).
Therefore, a convergence point is coming up in which the RSI has to break one of the trend lines. A breakdown of the bullish divergence trend line would give a bearish Cardano price prediction. Conversely, a breakout from the bearish divergence trend line would be bullish.
The former would likely cause a drop to $0.15, while the latter an increase to $0.58.
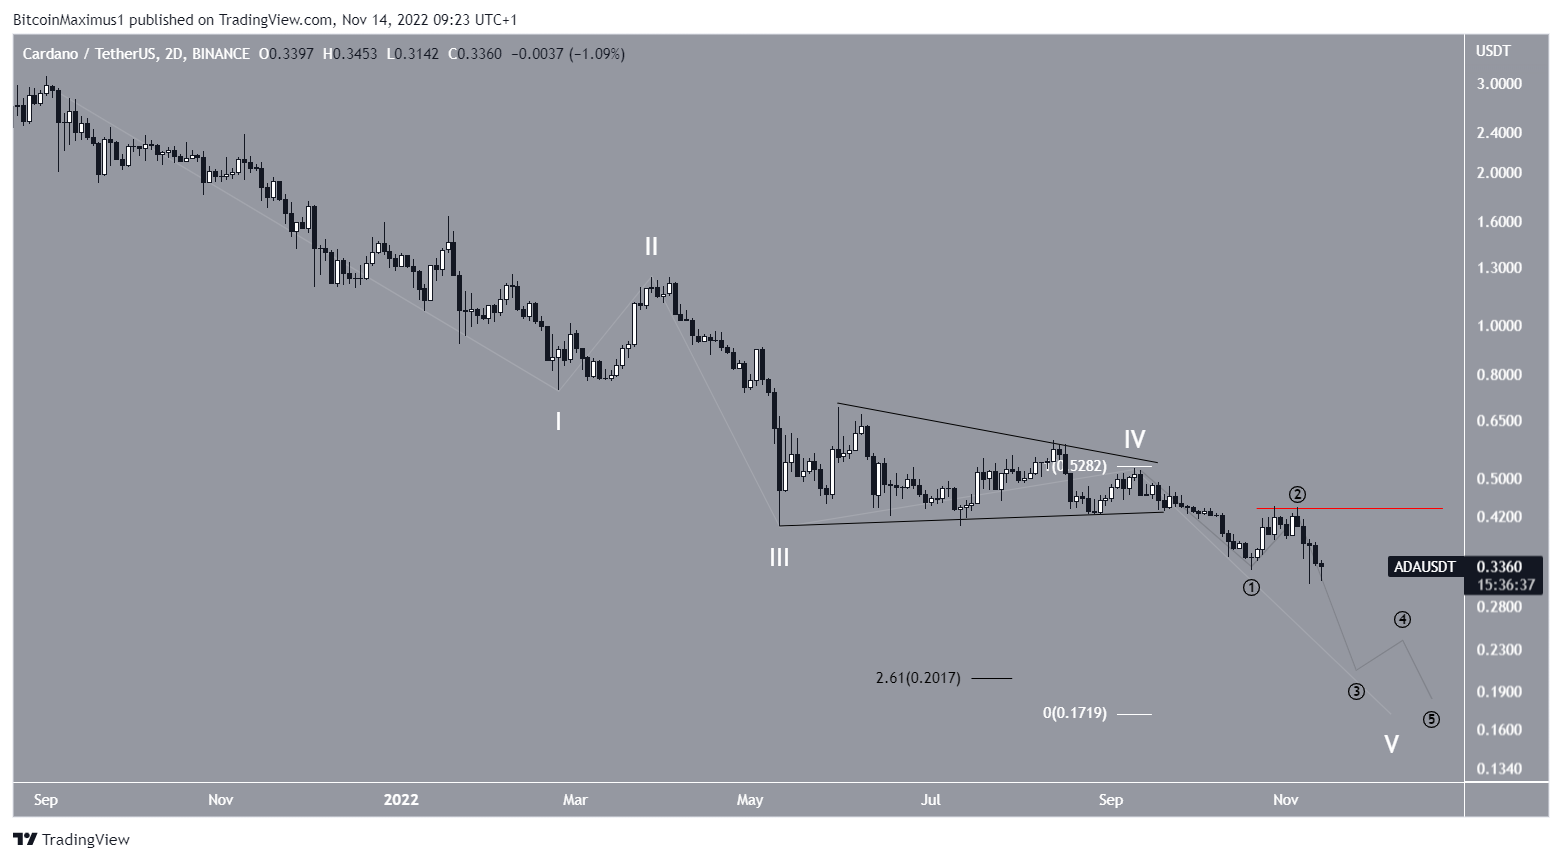
Cardano Price Prediction: Wave Count Favors Breakdown
The technical analysis wave count is firmly bearish. The price of ADA has begun a five-wave downward movement from the all-time high. The most defining characteristic of this decrease is the triangle that developed between May and Sept.
If correct, the ensuing breakdown is part of the fifth and final wave. The sub-wave count is in black.
Giving waves three and five a 1:1 ratio (white) would lead to a Cardano price low of $0.17. Additionally, the 2.61 external Fib retracement of wave four at $0.20 (black). Therefore, a low between $0.17-$0.20 seems a likely prediction. This is supported by the movement over the past 24 hours.
Conversely, an increase above the sub-wave two high of $0.44 (red line) would invalidate this bearish Cardano price forecast. Since this would likely cause the weekly RSI to break out, it could catalyze a future price upward movement towards $0.58.
For BeInCrypto’s latest Bitcoin (BTC) analysis, click here.
Disclaimer: BeInCrypto strives to provide accurate and up-to-date news and information, but it will not be responsible for any missing facts or inaccurate information. You comply and understand that you should use any of this information at your own risk. Cryptocurrencies are highly volatile financial assets, so research and make your own financial decisions.


