Whether Cardano (ADA) breaks down or bounces at the current horizontal support area could determine the direction of the future trend.
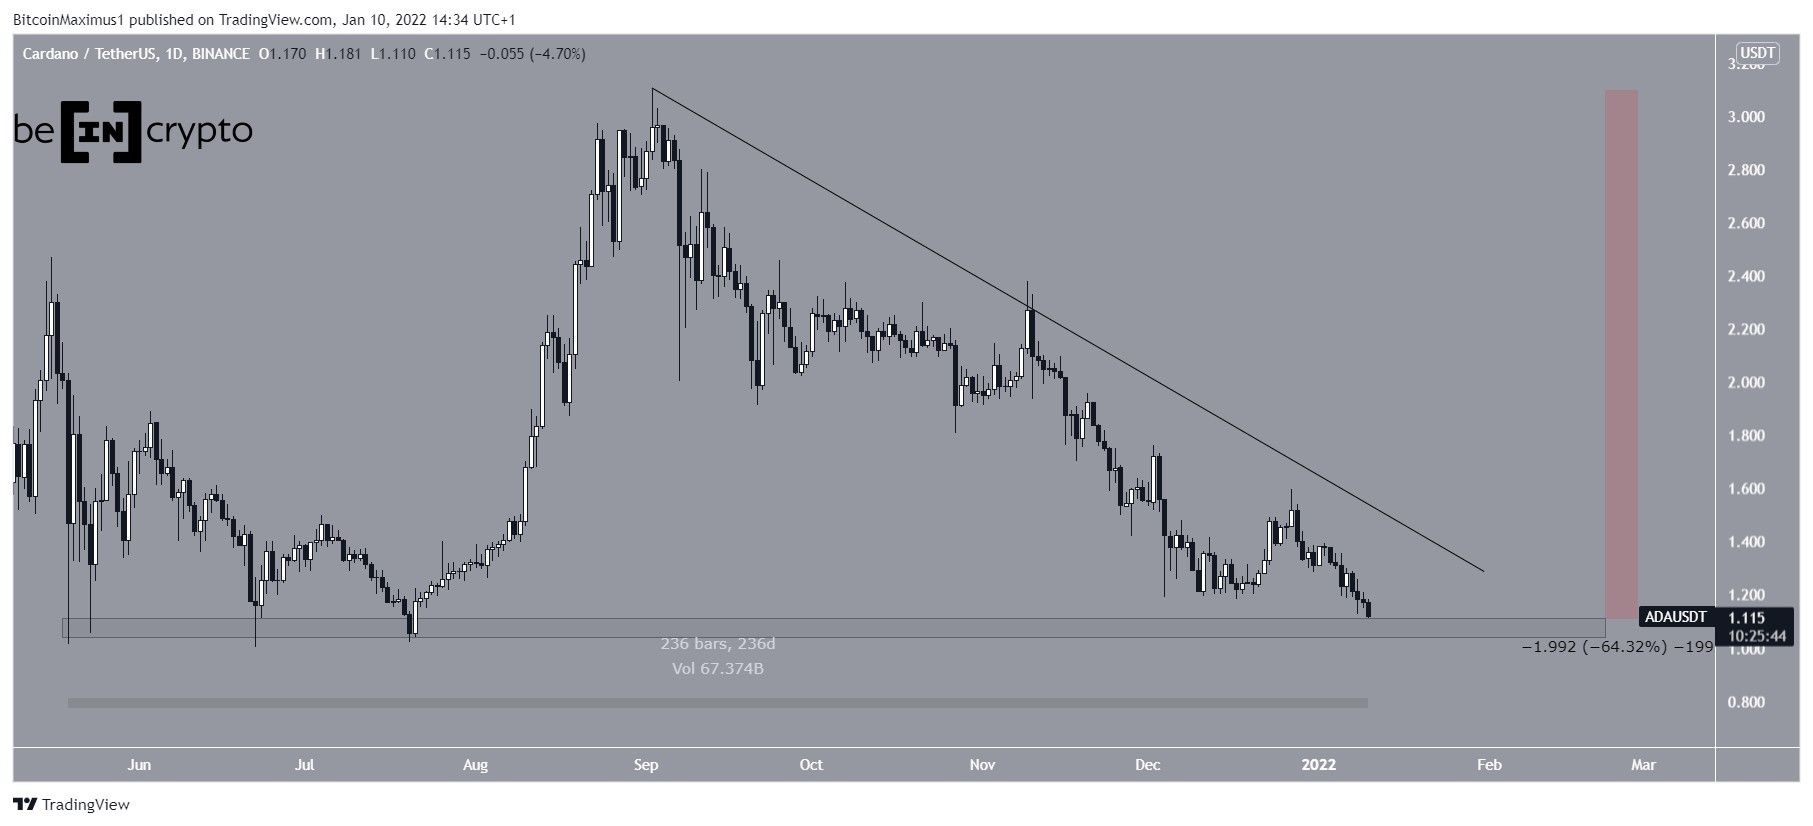
Cardano has been decreasing alongside a descending resistance line since reaching an all-time high price on Sept 2. So far, it has fallen by 64% since the aforementioned all-time high.
Currently, the token is very close to the $1.07 horizontal support area, which has been in place for 236 days. A breakdown below it could trigger a very sharp fall.
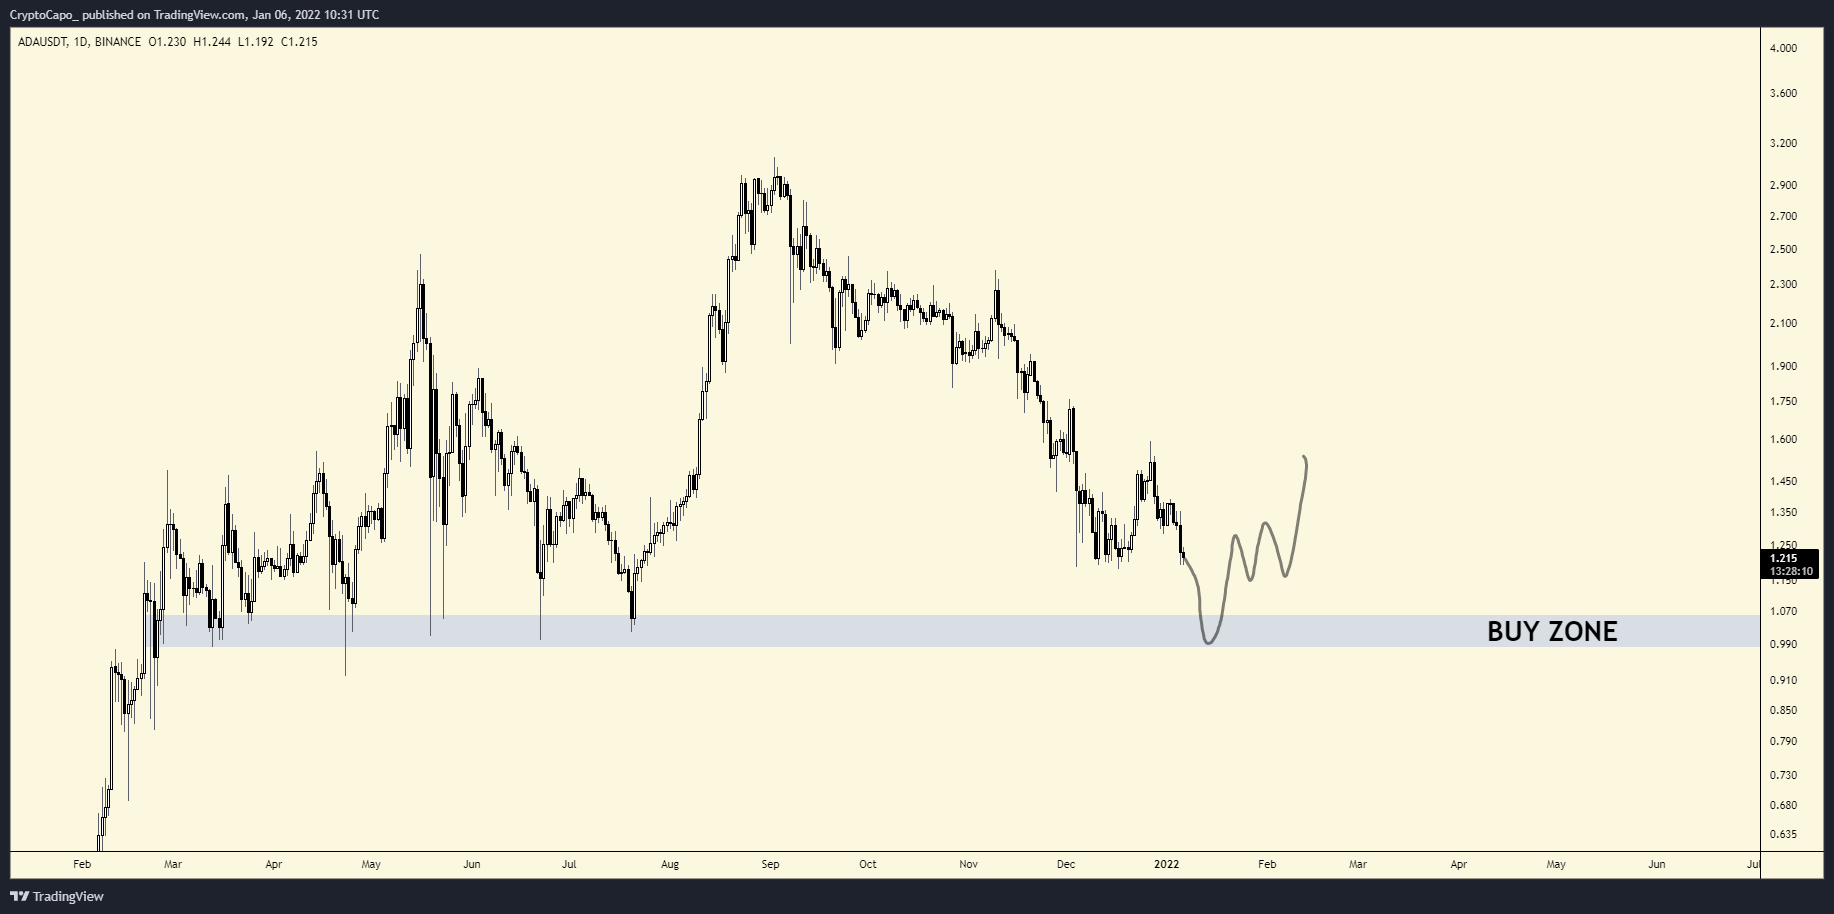
Cryptocurrency trader @CryptoCapo_ tweeted an ADA chart. He stated that the token is expected to bounce at the $1 horizontal support area. The are coincides with that outlined in the previous image.
ADA wave count
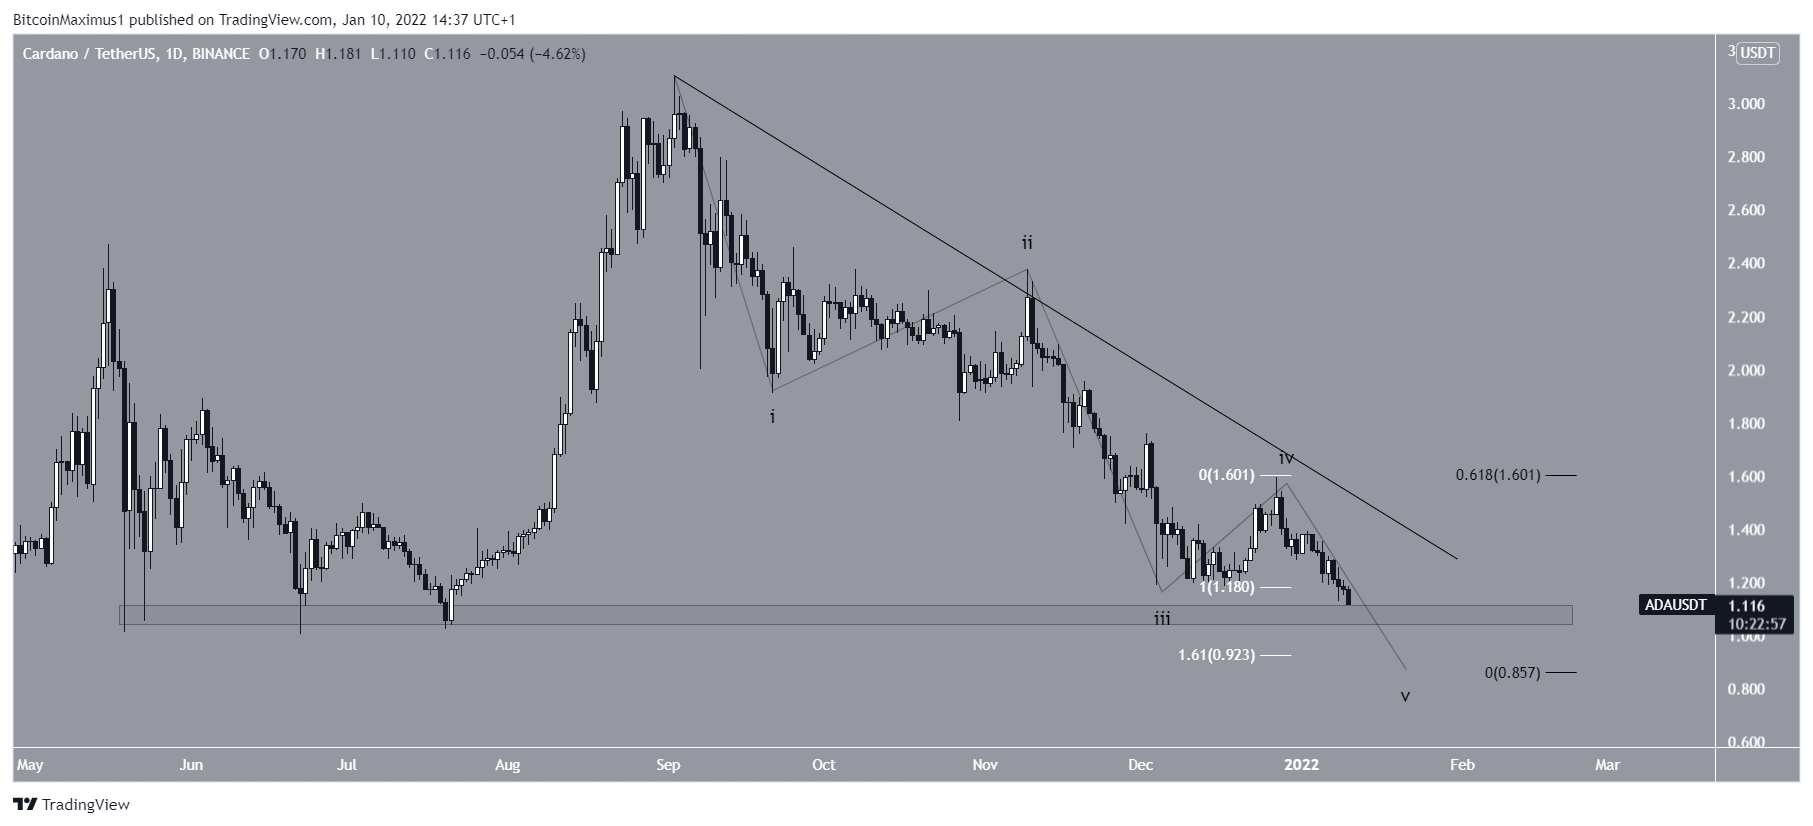
The movement since the aforementioned all-time high resembles a five wave bearish formation, in which ADA is in the fifth and final wave. This means that after the drop is complete, a sizeable bounce would be likely.
A potential target for the bottom of this movement is found between $0.86 – $0.92. The target is found using the 0.618 length of wave one (black) and the 1.61 external length of wave four (white).
This would present a scenario in which ADA sweeps the June lows before reclaiming the $1.07 area and eventually breaking out from the descending resistance line.
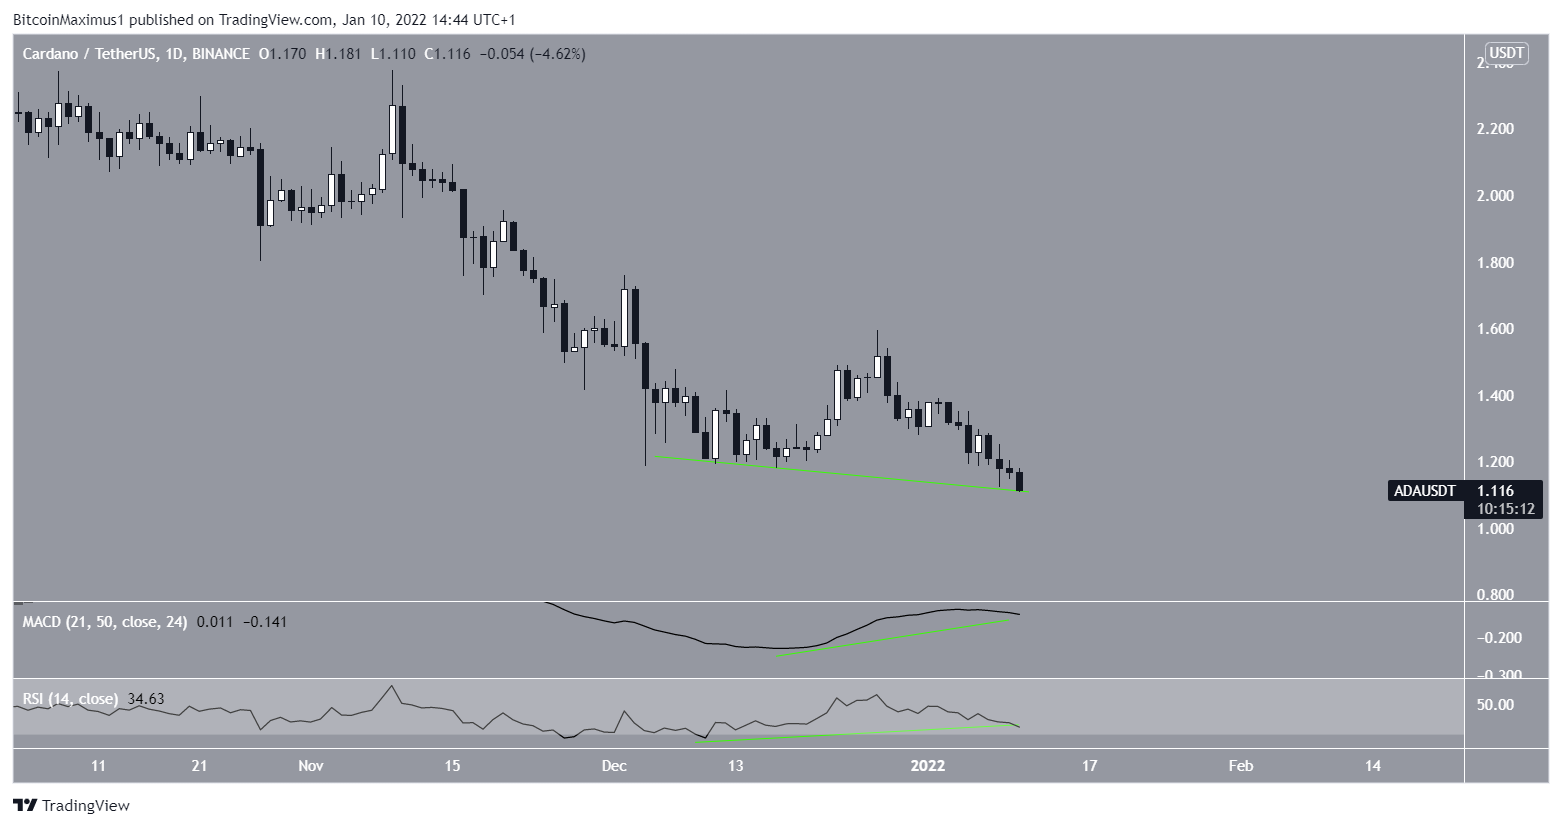
This possibility would fit well with the readings from both the MACD and RSI, which have generated significant bullish divergences (green line)
Such divergences often precede bullish trend reversals, since they indicate that the price decrease was not accompanied with a similar decrease in technical indicators. This is considered a sign of weak selling pressure. So, it could lead to the proposed deviation and reclaim.
However, this movement is not yet confirmed, and a continuous decrease in the ADA price could invalidate the divergences.