


The Cardano (ADA) price has been moving upwards at an accelerated rate since the end of May. However, it seems that the upward trend has reached its end and a corrective period is likely to ensue.
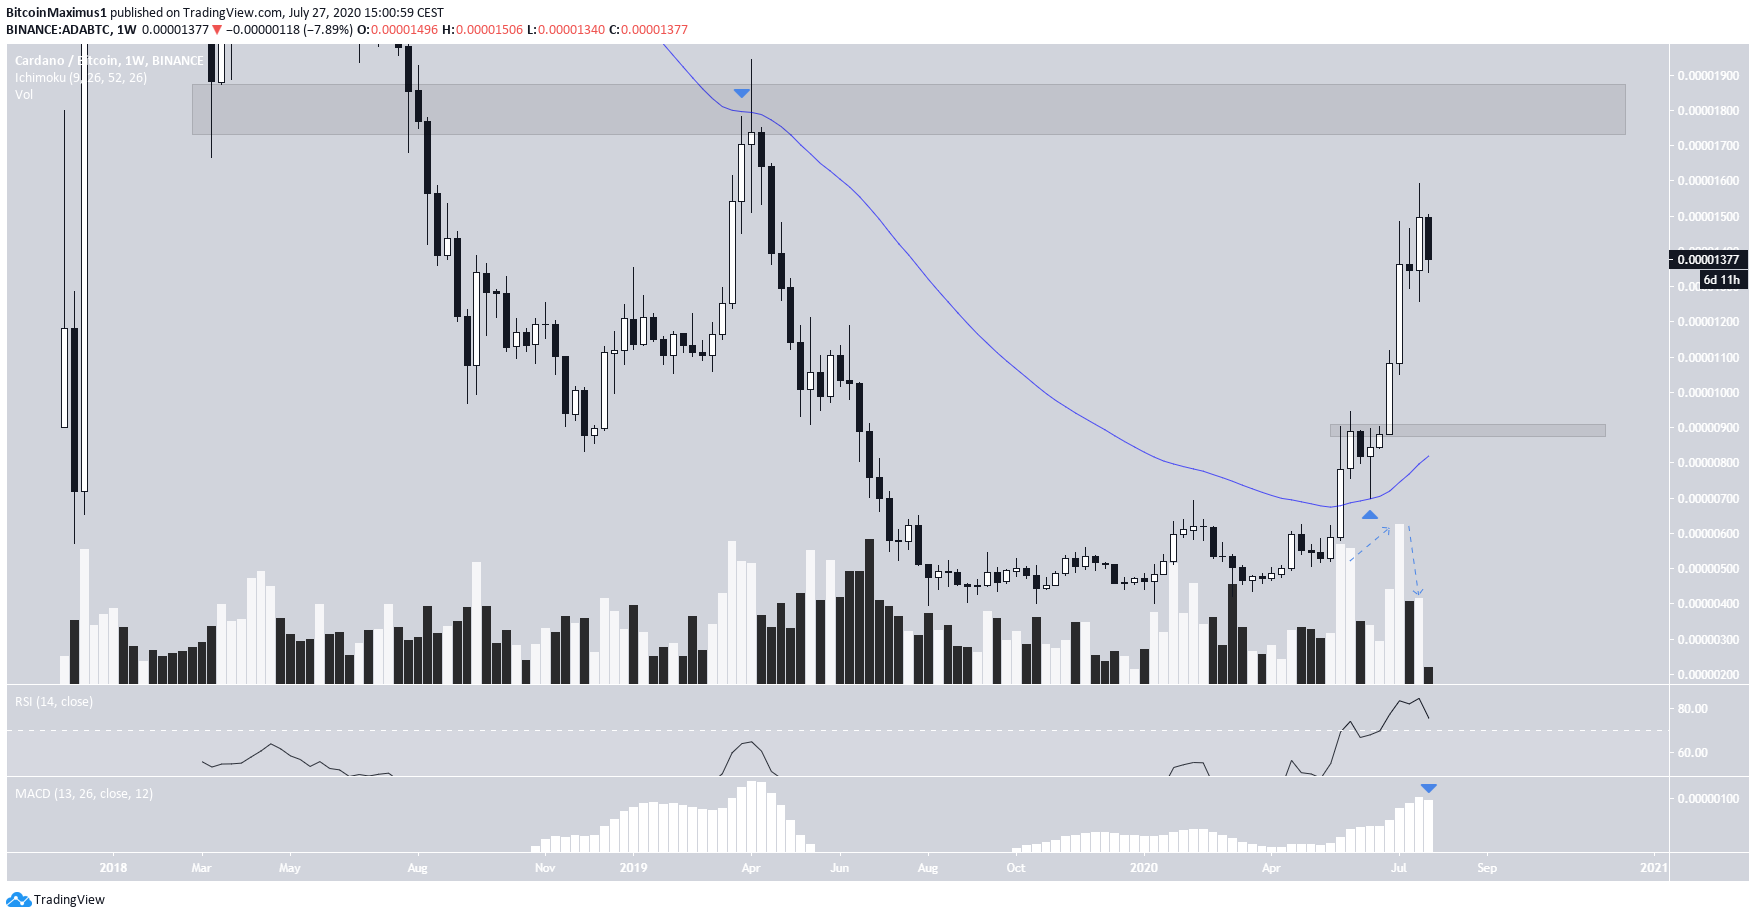
After breaking out from the 50-week moving average (MA), the ADA price returned to validate the line as support in June and has been moving upwards at an even more accelerated rate since then.
ADA’s Harrowing Climb
The importance of the 50-week MA cannot be overstated. It was the MA that ended the upward move in April 2019, beginning a 10-month long downward trend. The highs of April now make up the main resistance area at 1,800 satoshis.
Technical indicators show that even though the move is overextended, there are no definitive signs of weakness yet.
While the RSI is overbought, there is no bearish divergence present. In addition, the MACD is growing. While the current momentum is lower, there are six more days until the weekly close, so it is possible that it will keep increasing.
The closest support area is found at 900 satoshis, strengthened by the aforementioned 50-week MA.
Cryptocurrency trader @noobgettinrich stated that he is using the retracement to enter on coins which he has missed, ADA being his main target. If the price returns to the 900 satoshi area, it would be a good level for a possible reversal.
Let’s take a closer look at the short-term movement to see if that is likely.
Evening Star Pattern & Beginning of a Correction
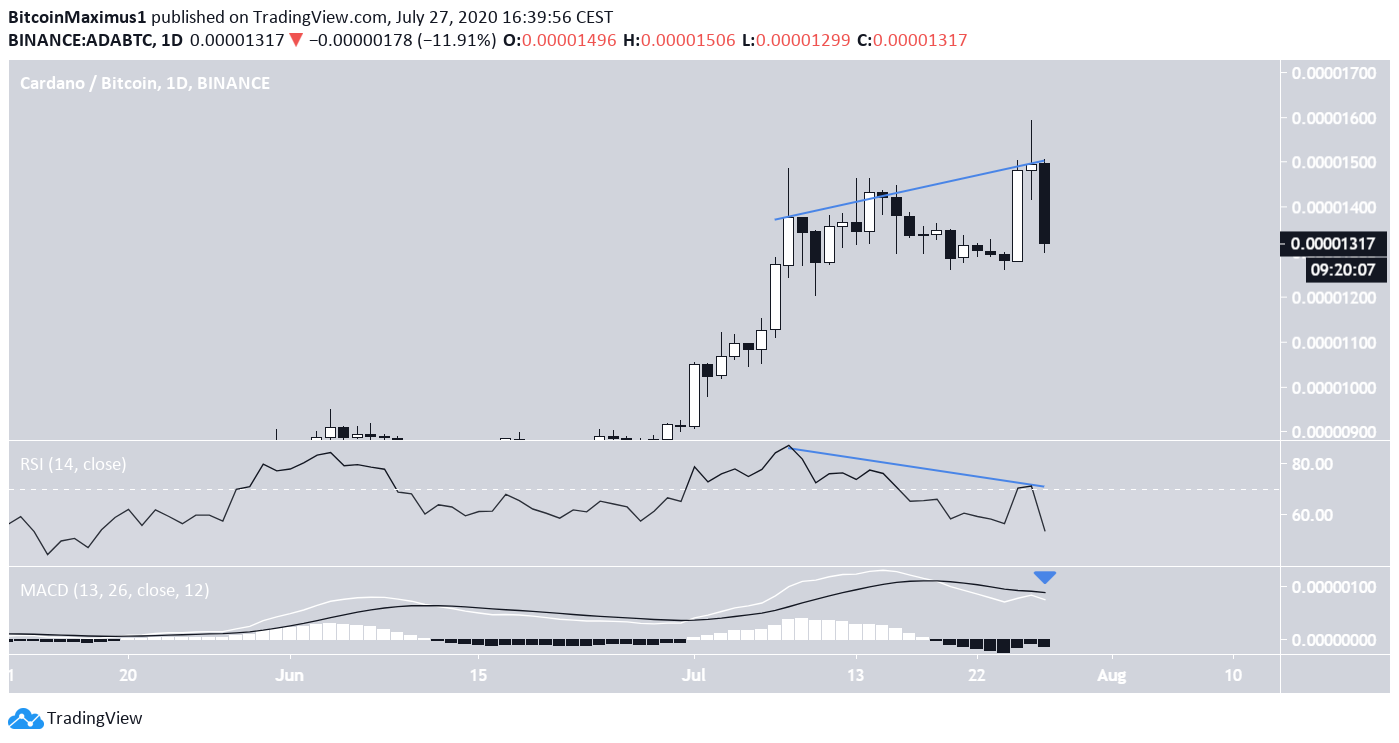
The daily chart reveals a clear weakness in the upward trend. The RSI has generated considerable bearish divergence, and the momentum of the MACD has turned negative.
In addition, the price is in the process of completing an evening star pattern, which would be confirmed with a close below the July 25 open of 1,280 satoshis. This is a sign that a top has occurred and a corrective period will likely begin.
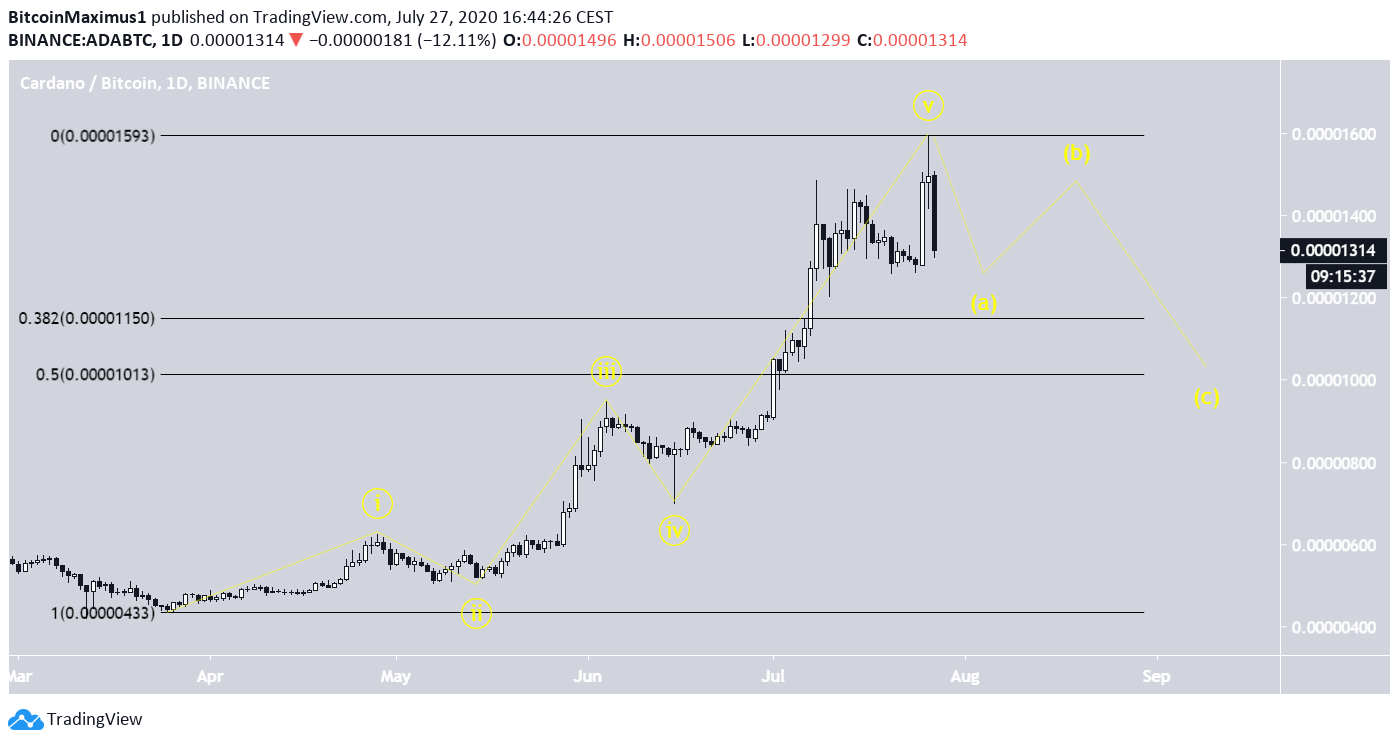
Since the price has likely completed a five-wave impulsive upward move beginning on March 22, this would also fit with the wave count.
If so, an A-B-C correction would be expected, ending near the 0.5 Fib level of the entire upward move around 1,000 satoshis. This would also coincide with the support area from the first section.
To conclude, it looks as if ADA has reached a top, or is very close to doing so. This indicates that a corrective period will likely begin soon.


