


Cardano (ADA) has failed to break out above a long-term descending resistance line and suffered a sharp drop after its rejection.
Technical indicators suggest that the price is likely to continue its descent.
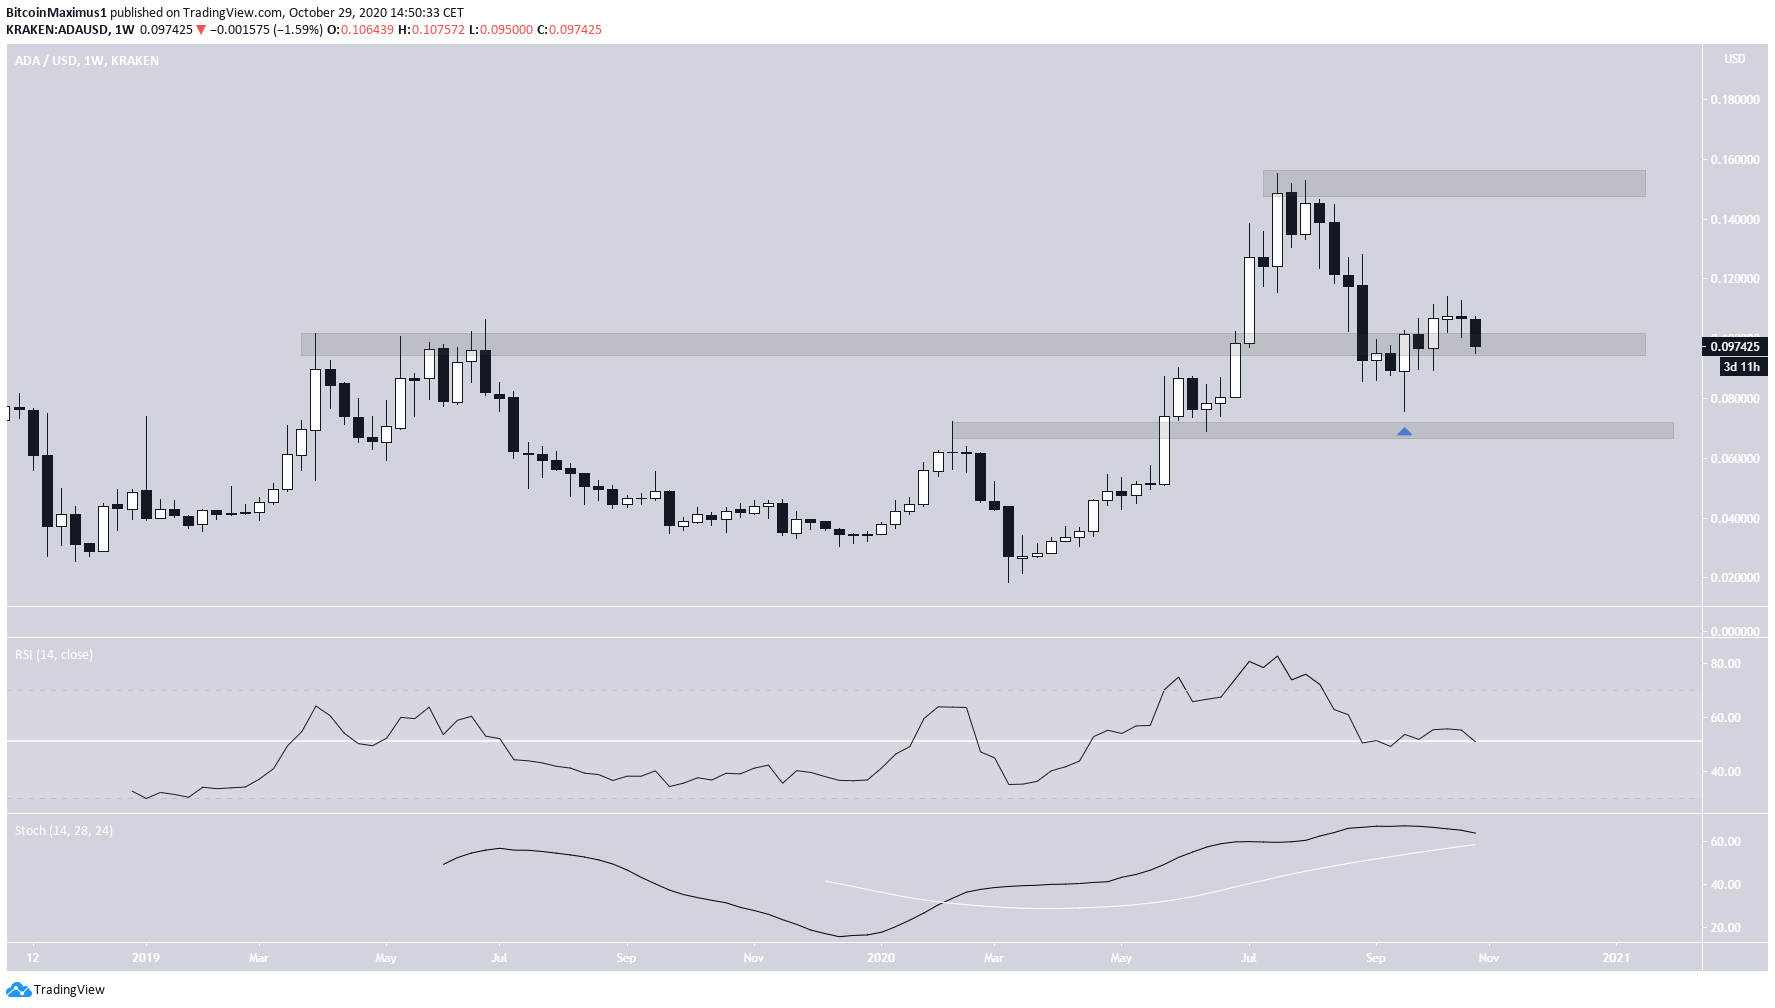
ADA Long-Term Bounce
Currently, ADA is trading inside the $0.09-$0.10 zone, which is expected to provide support. The same area acted as resistance during the May 2019 upward move, before ADA finally broke out above it in July 2020. The ensuing decrease served to validate the area as support.
ADA initially fell below this level, but a bullish hammer candle was created during the week of Sept 21-28. This is a strong bullish sign, especially if the price manages to hold on above the $0.09 support.
If it does, a proceeding rally could take the price to $0.155, while a breakdown below support would likely cause a drop back to $0.07.
Technical indicators are at a make-or-break level. The RSI is at the 50-line while the Stochastic Oscillator is in the process of making a bearish cross.
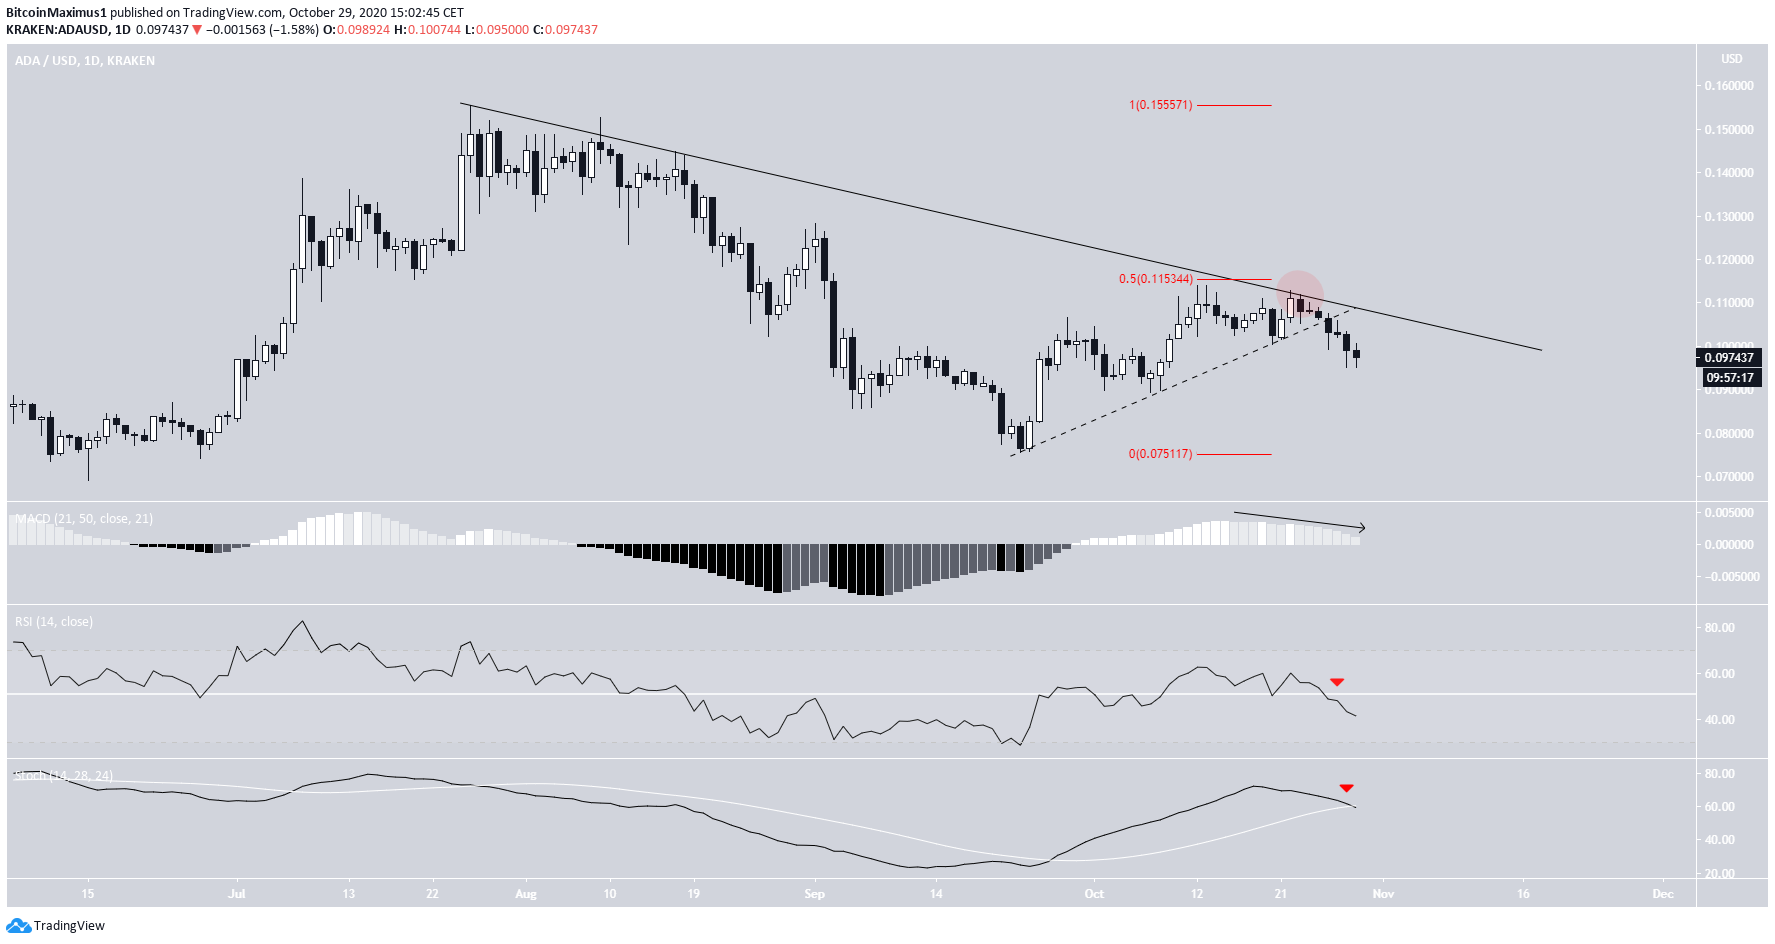
Failure To Break Out
The ADA price has been decreasing alongside a descending resistance line since July 27 when it reached a high of $0.155. The decrease continued until the price reached a local low of $0.074 on Sept 23.
Afterward, ADA began an upward move, following an ascending support line (dashed). The price reached a crucial level on Oct 27 that was the point of convergence between the:
- Descending resistance line drawn from the July highs.
- Ascending support line drawn from the Sept lows.
- 0.5 Fib level of the entire decrease.
The price was rejected and broke down from this ascending support.
Technical indicators in the daily time-frame are bearish.
The MACD and RSI are decreasing. The latter has fallen below the 50-line and the Stochastic Oscillator has just made a bearish cross. These are signs that the price is expected to continue moving downwards.
Cryptocurrency trader @po1szn outlined an ADA chart that shows a long-term wave count which predicts that ADA will decrease to $0.05 before bouncing upwards rapidly.
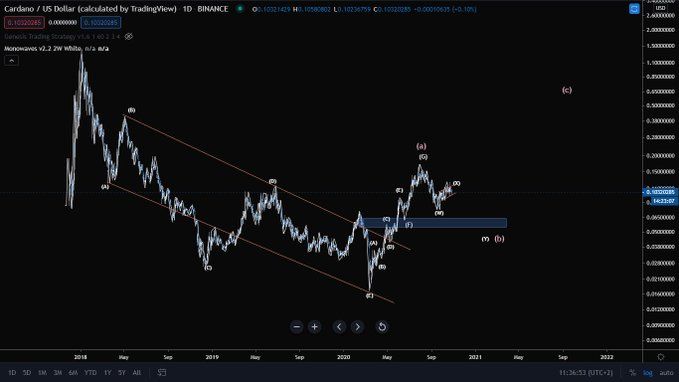
While we cannot yet confidently predict the latter part of the move, it does seem likely that ADA will drop towards the $0.07 support area outlined in the first section.
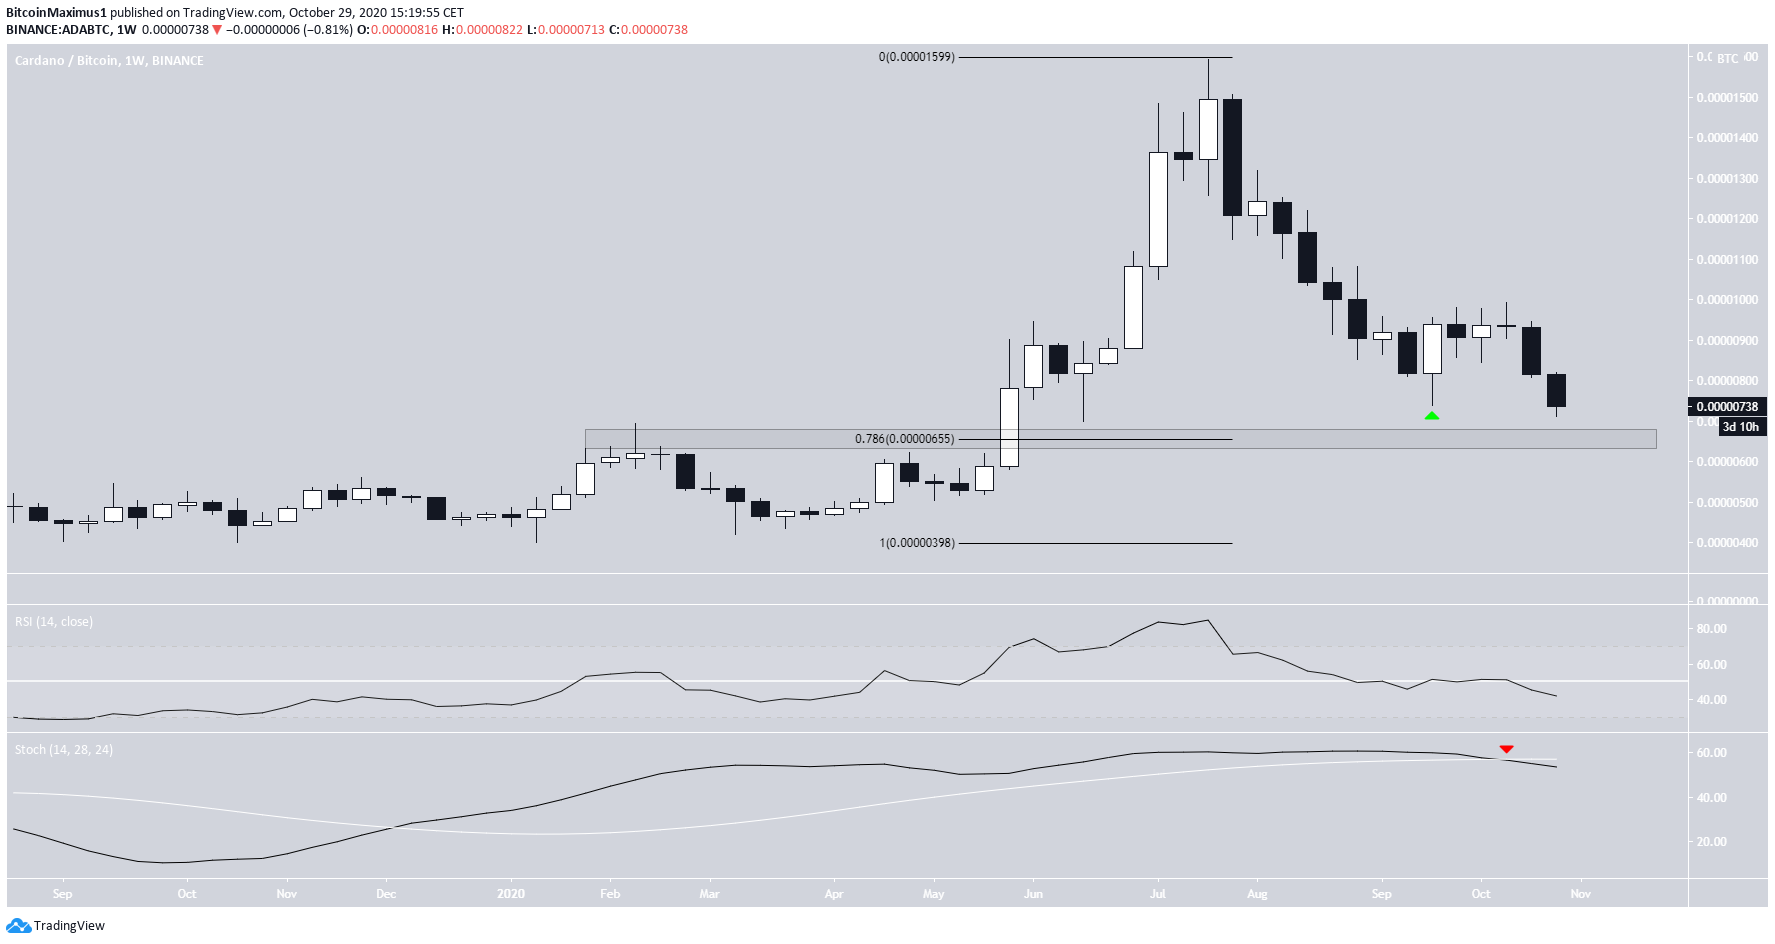
ADA/BTC
The ADA/BTC chart shows a similar bullish hammer candlestick created during the week of Sept 21-28. However, the price has already fallen below that candlesticks low. Currently, it’s approaching the 655 satoshi support area, which is the 0.786 Fib level of the entire upward move.
Technical indicators are bearish since the RSI has fallen below 50 and the Stochastic Oscillator has just made a bearish cross.
Therefore, while 655 satoshis could initiate a rally, the price is expected to eventually fall below it.
To conclude, the outlook for both the ADA/USD and ADA/BTC pairs is bearish.
For BeInCrypto’s latest Bitcoin analysis, click here!
Disclaimer: Cryptocurrency trading carries a high level of risk and may not be suitable for all investors. The views expressed in this article do not reflect those of BeInCrypto.


