Cardano (ADA) could be trading inside a short-term bullish pattern and is showing early signs of a potential bullish trend reversal.
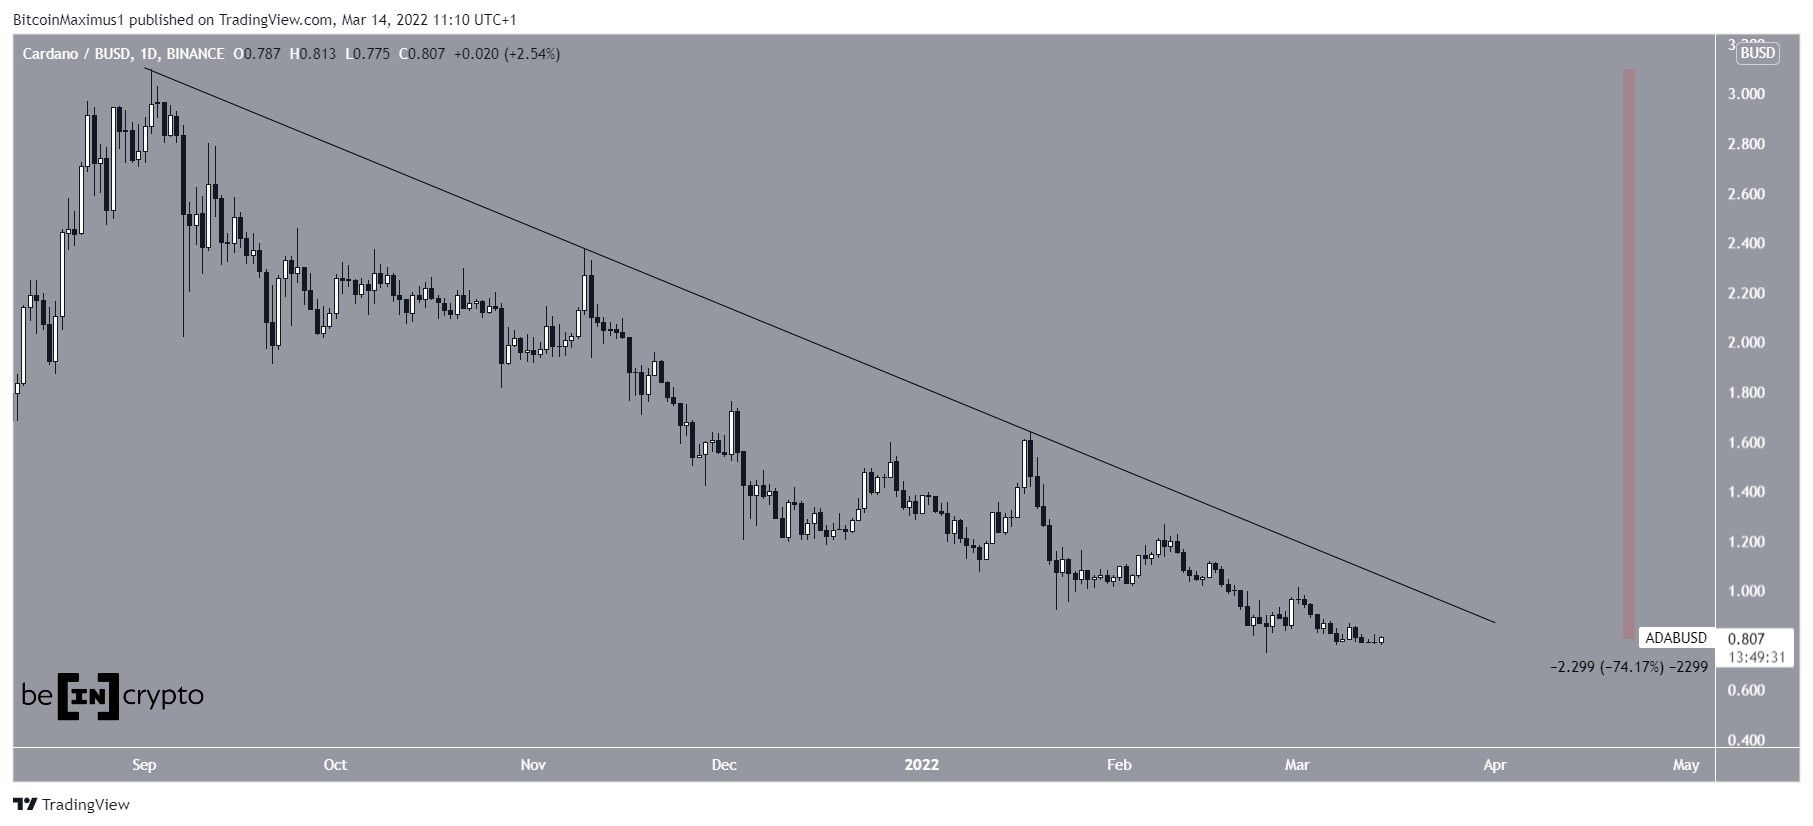
ADA has been falling since reaching an all-time high price of $3.10 on Sept 2. The downward movement led to a low of $0.745 on Feb 24. On this day, ADA created a long lower wick but has not begun an upward movement yet.
Measuring from the all-time high, ADA has so far decreased by 74%. In addition to this, the price is following a descending resistance line.
Potential ADA reversal
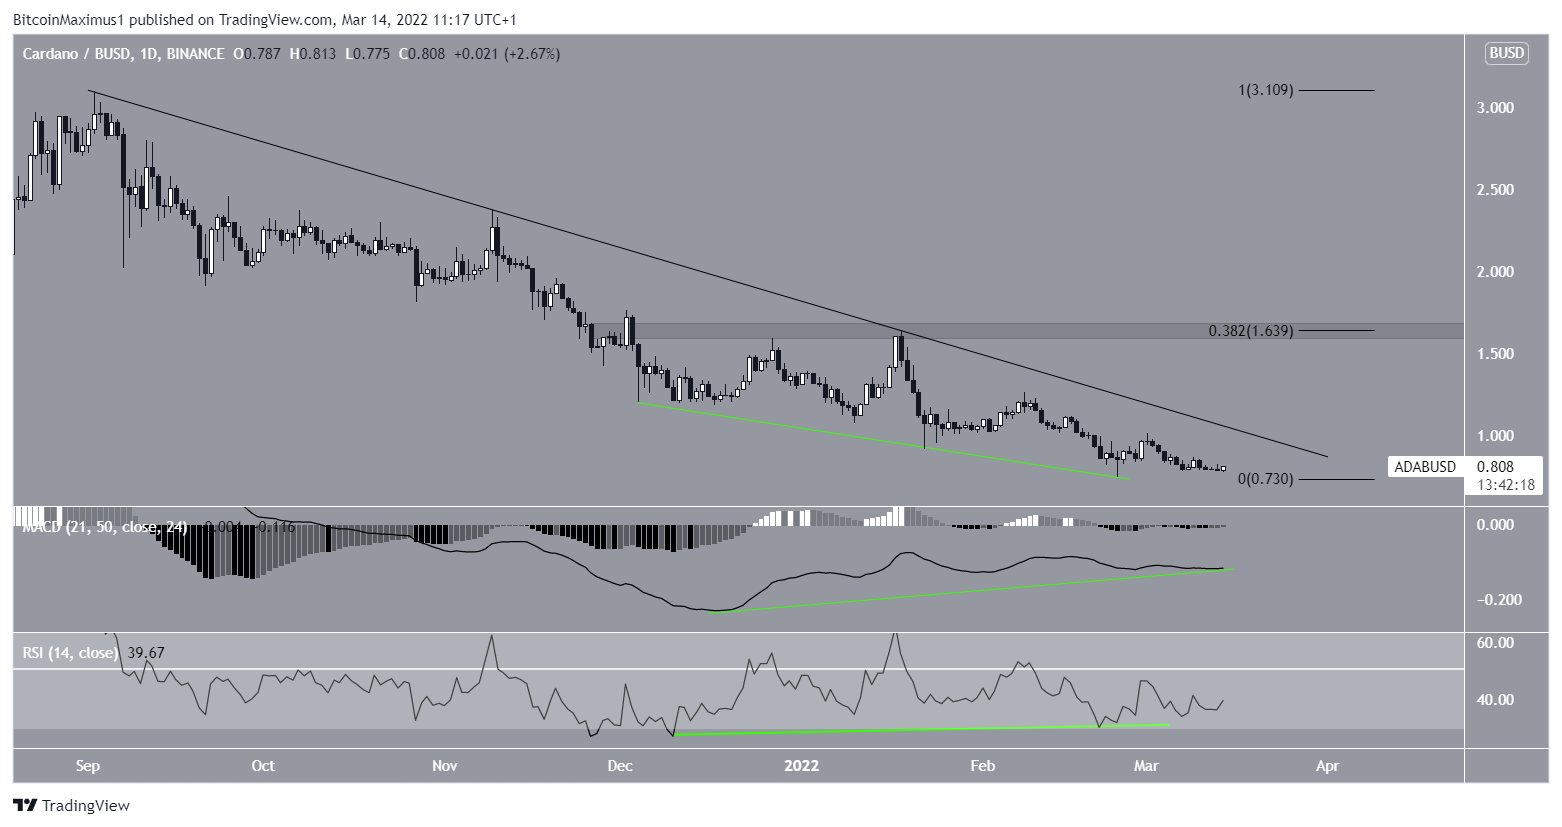
The daily time-frame shows both the RSI and MACD have generated considerably bullish divergences (green lines). Such pronounced bullish divergences often precede bullish trend reversals.
If a breakout from the line occurs, the closest resistance area would be at $1.64. This is the 0.382 Fib retracement resistance level and a horizontal resistance area.
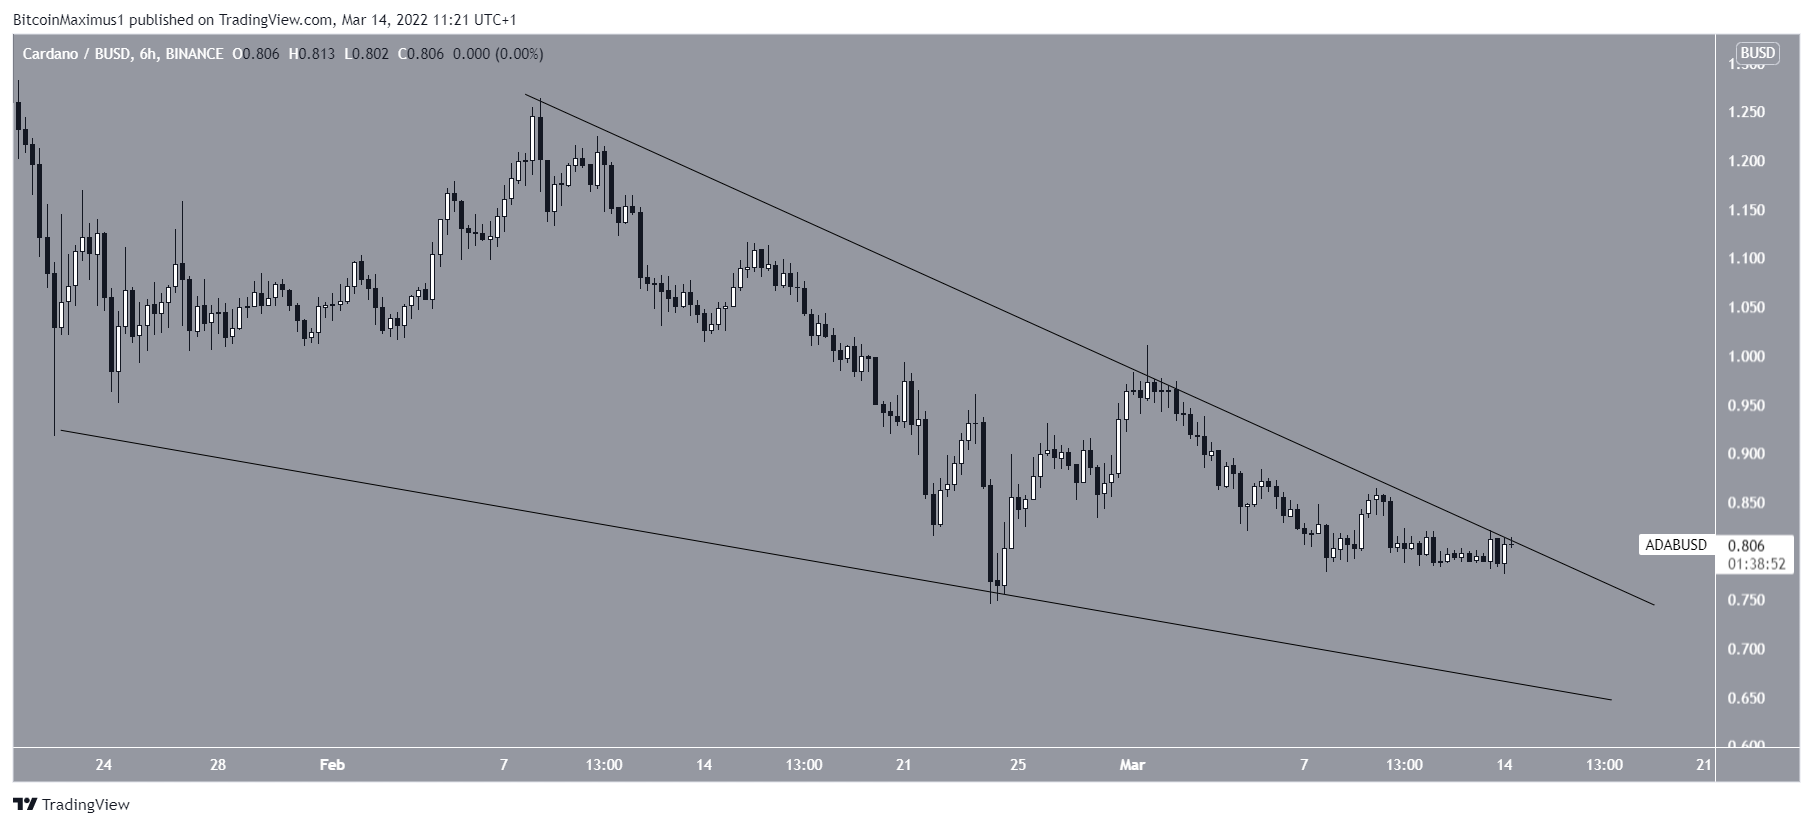
The six-hour chart also shows that ADA is possibly trading inside a descending wedge. This is considered a bullish pattern, which makes a breakout more likely.
However, if the pattern were to be confirmed, the price would likely reach another low, validating the support line of the wedge once more before eventually breaking out.
Wave count analysis
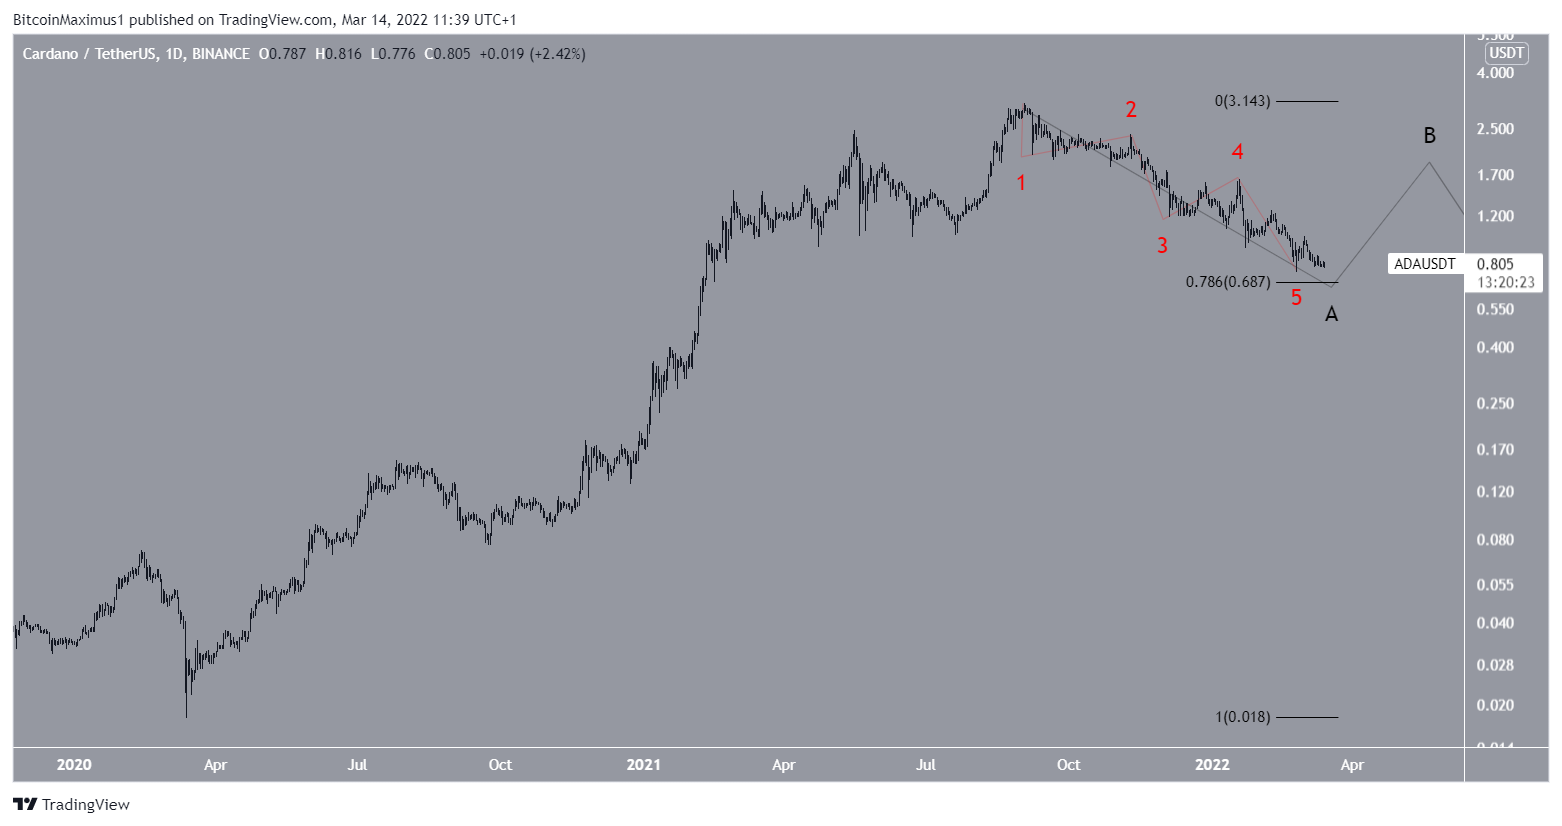
Cryptocurrency trader @CryptoTony_ tweeted a chart of ADA, stating that the first leg of the correction could be complete.
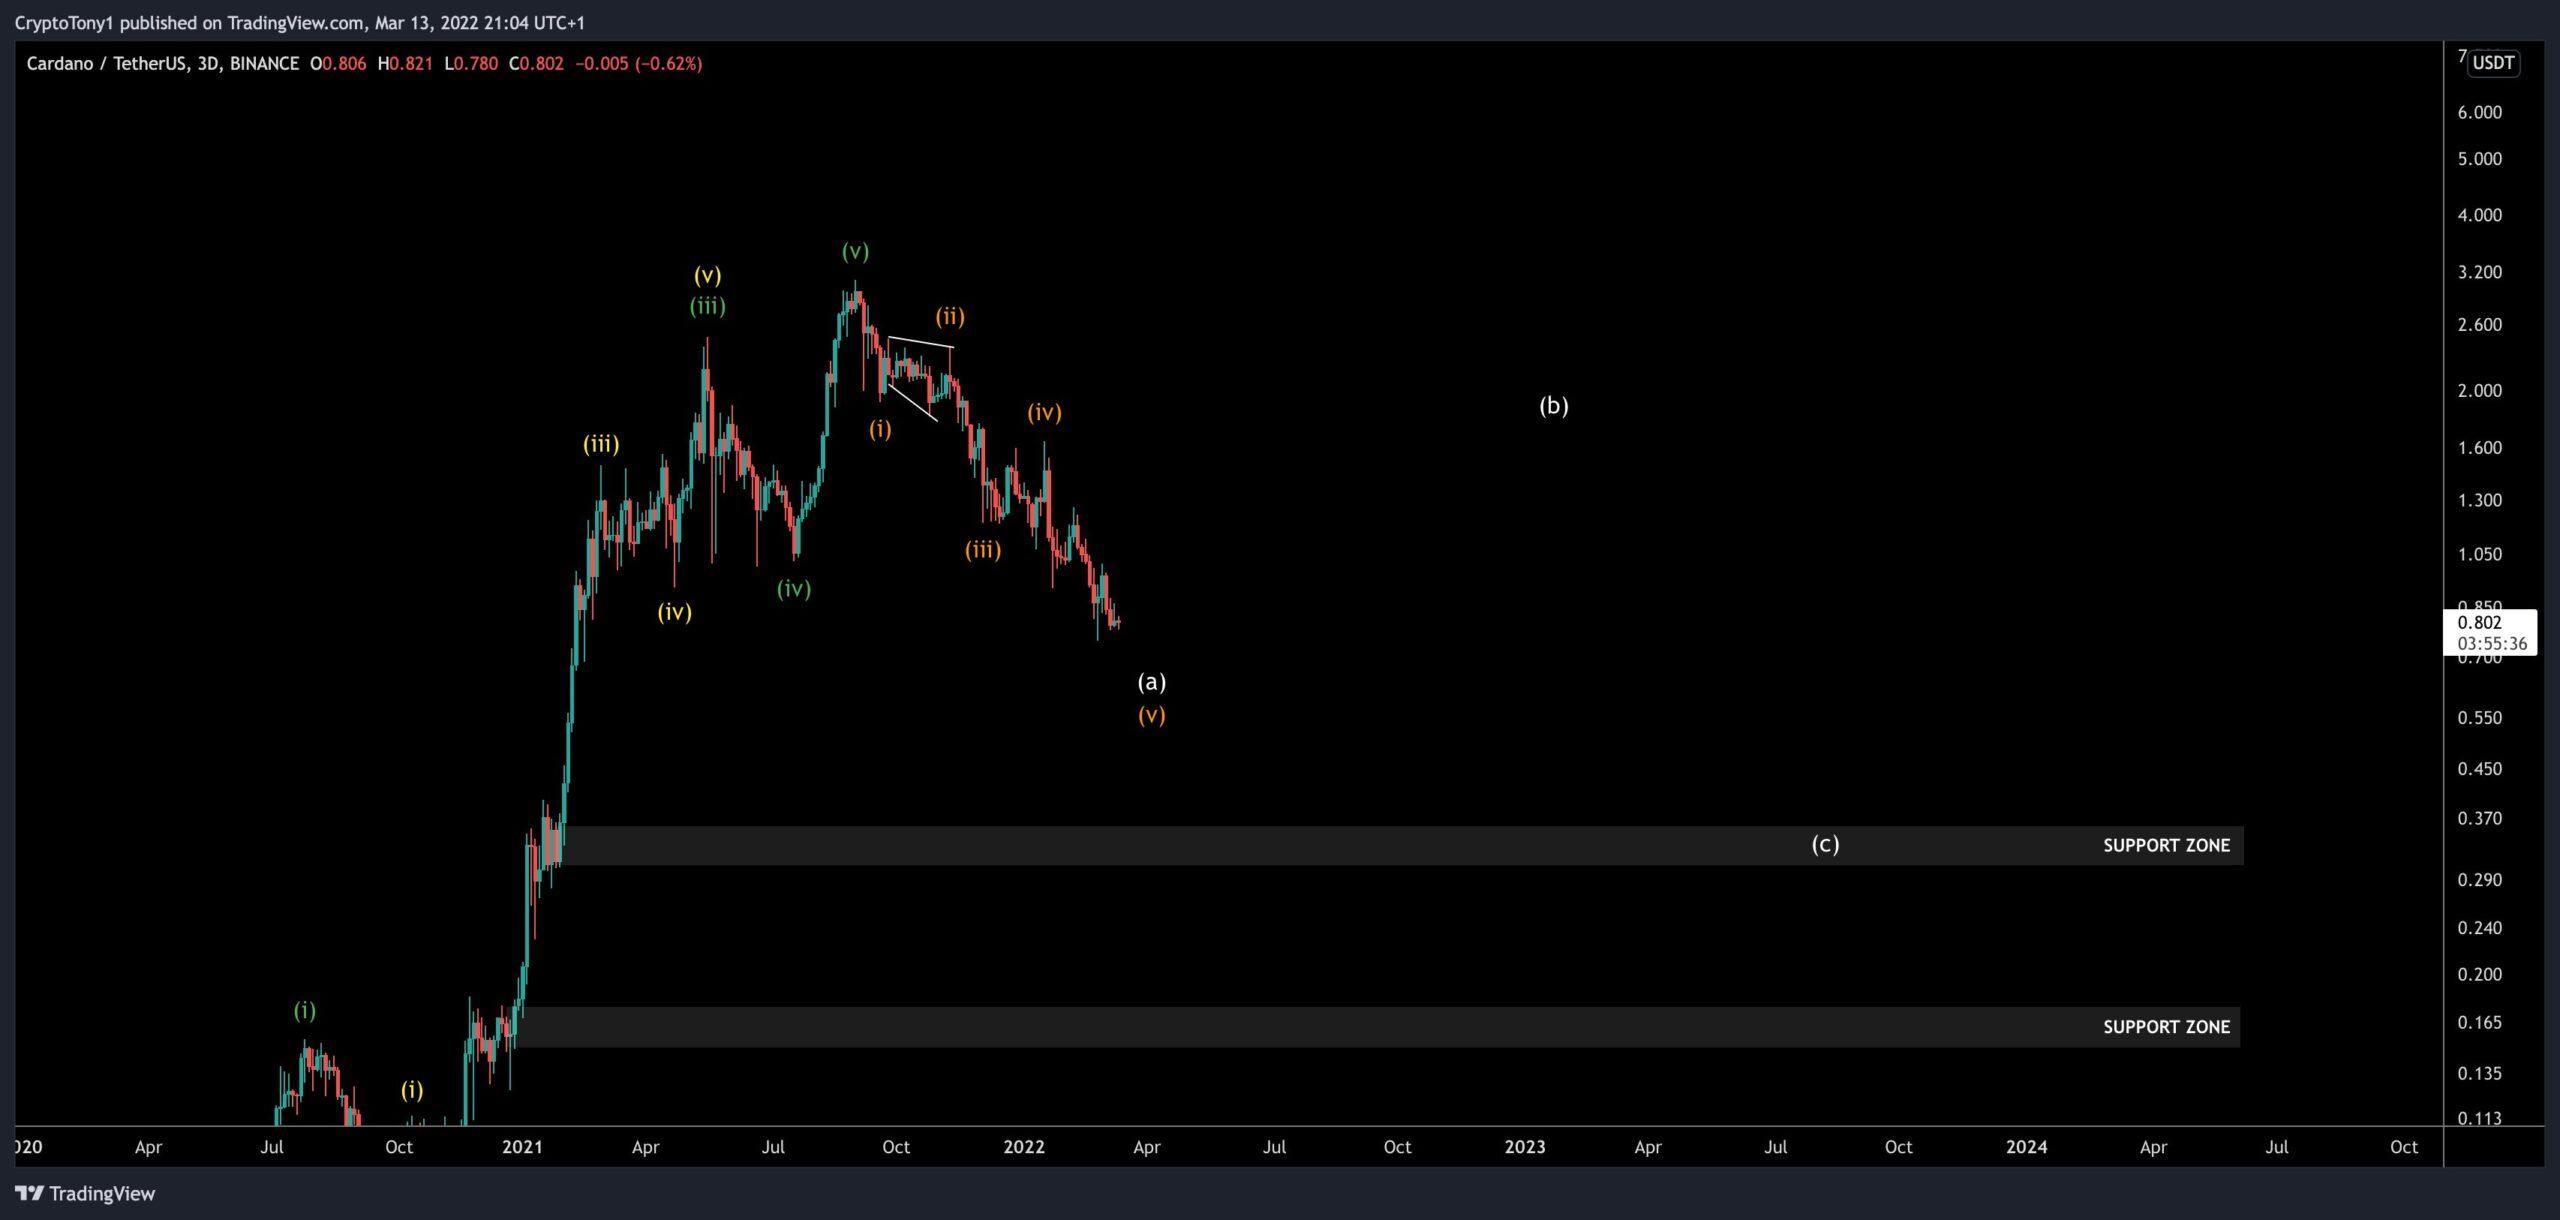
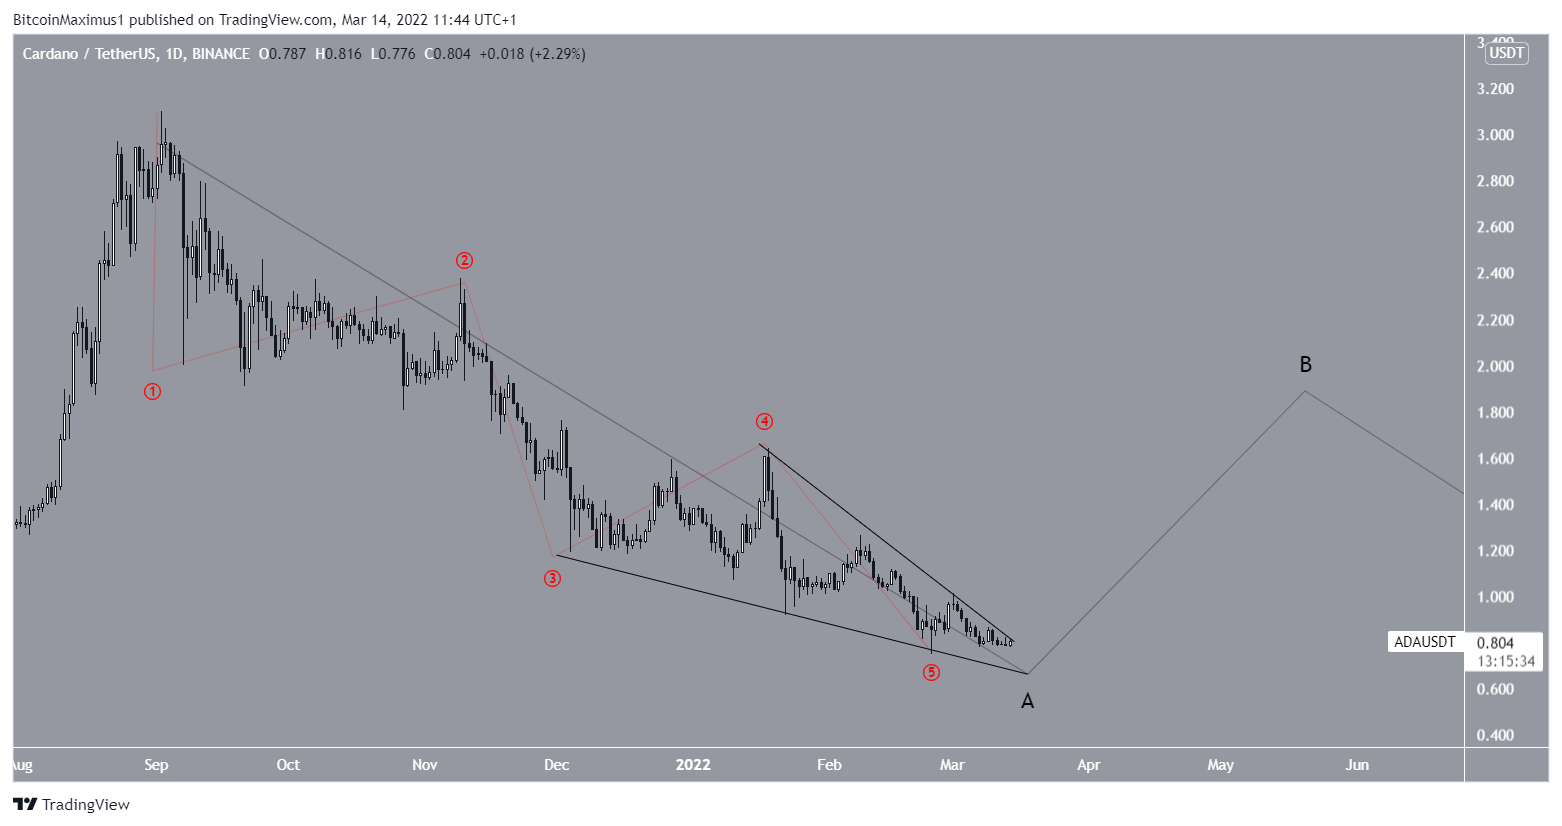
The wave count indicates that since the all-time high, ADA has been decreasing in what likely is wave A of an A-B-C corrective structure (black). The sub-wave count is given in red.
It is not yet certain if sub-wave five has ended or if there is another low to come. The latter would validate the support line of the wedge once more.
However, an eventual breakout seems to be likely. This would also fit with the bullish divergences that have developed in the daily time-frame.
A look at the movement since March 2020 shows that ADA is approaching the 0.786 Fib retracement support level at $0.68.
Therefore, it seems that one more drop towards the support line of the wedge is the most likely scenario.