
Cardano (ADA) is consolidating its position as the third-largest cryptocurrency by market capitalization. ADA has formed a higher low and technical indicators suggest it could soon break the all-time high at $2.47.
The ADA/BTC pair also looks bullish and is trying to turn long-term resistance into support. If the altcoin breaks through the 5,000 satoshi area, the rally could become parabolic again.
ADA reclaims $2
ADA has been moving up from its July 21 low at $1.13. Here, ADA bounced for the seventh time from the support area near $1 (green), above which it has been trading for 147 days.
First, a gradual upward move broke through the resistance of $1.50 on Aug 10. The upward move then accelerated, with ADA breaking through another resistance near $1.80. A local peak was reached at $2.25 on Aug 14. This is less than 10% below the all-time high of $2.47 set on May 16 (yellow line).
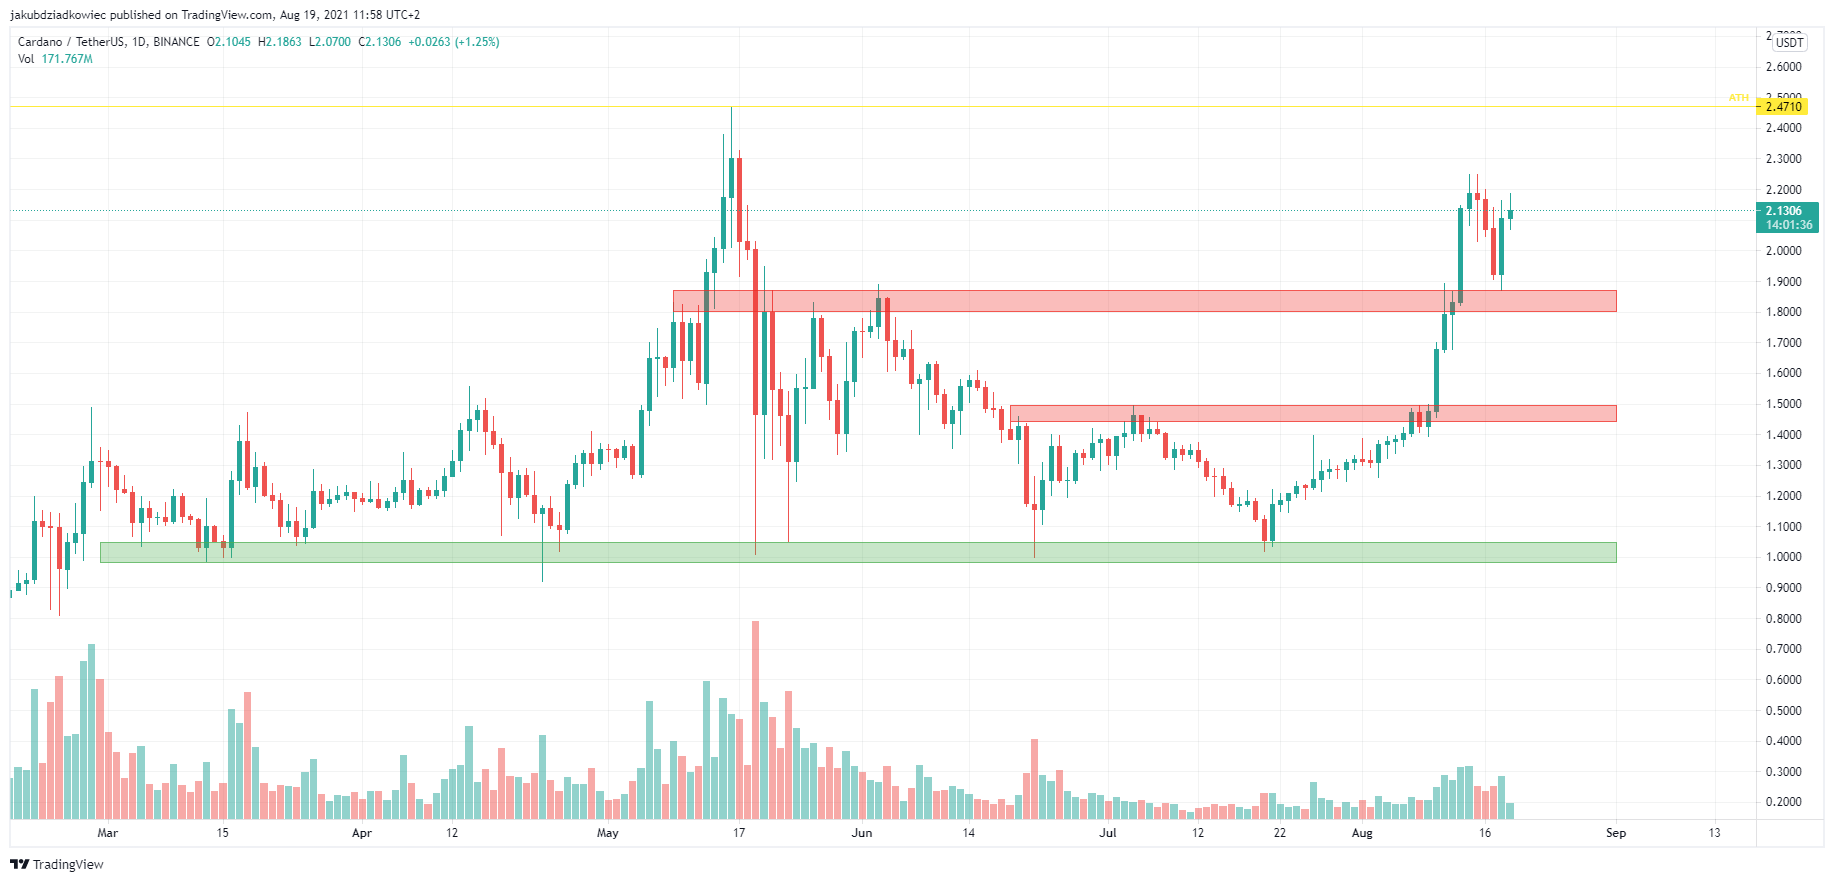
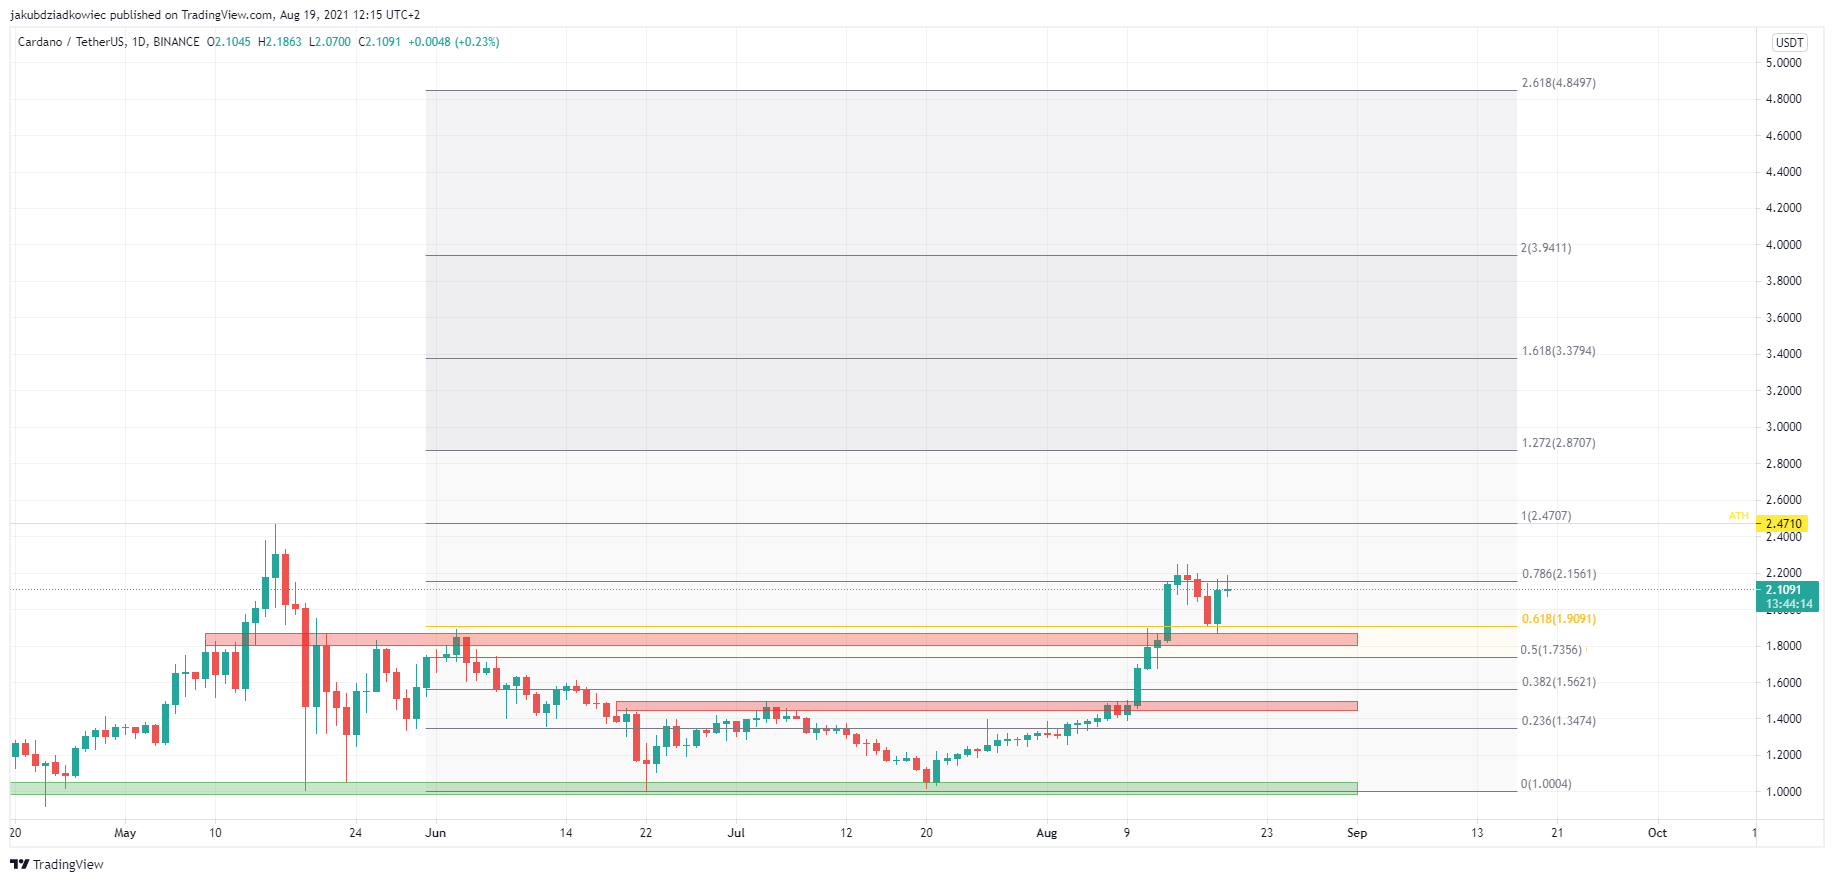
On Aug 18, ADA went through a bullish retest of the $1.87 area and validated it as support. Thus, it formed a higher low for the uptrend on the daily interval. This area coincides with the 0.618 Fib retracement level when measuring the entire downward movement.
Shortly after this event, ADA rose another 10% and returned to a price above the psychological $2 level. Currently, it’s trading at the 0.786 Fib retracement. If Cardano holds this level, we might see another upward move and a new all-time high in the coming days.
Technical indicators and long-term targets
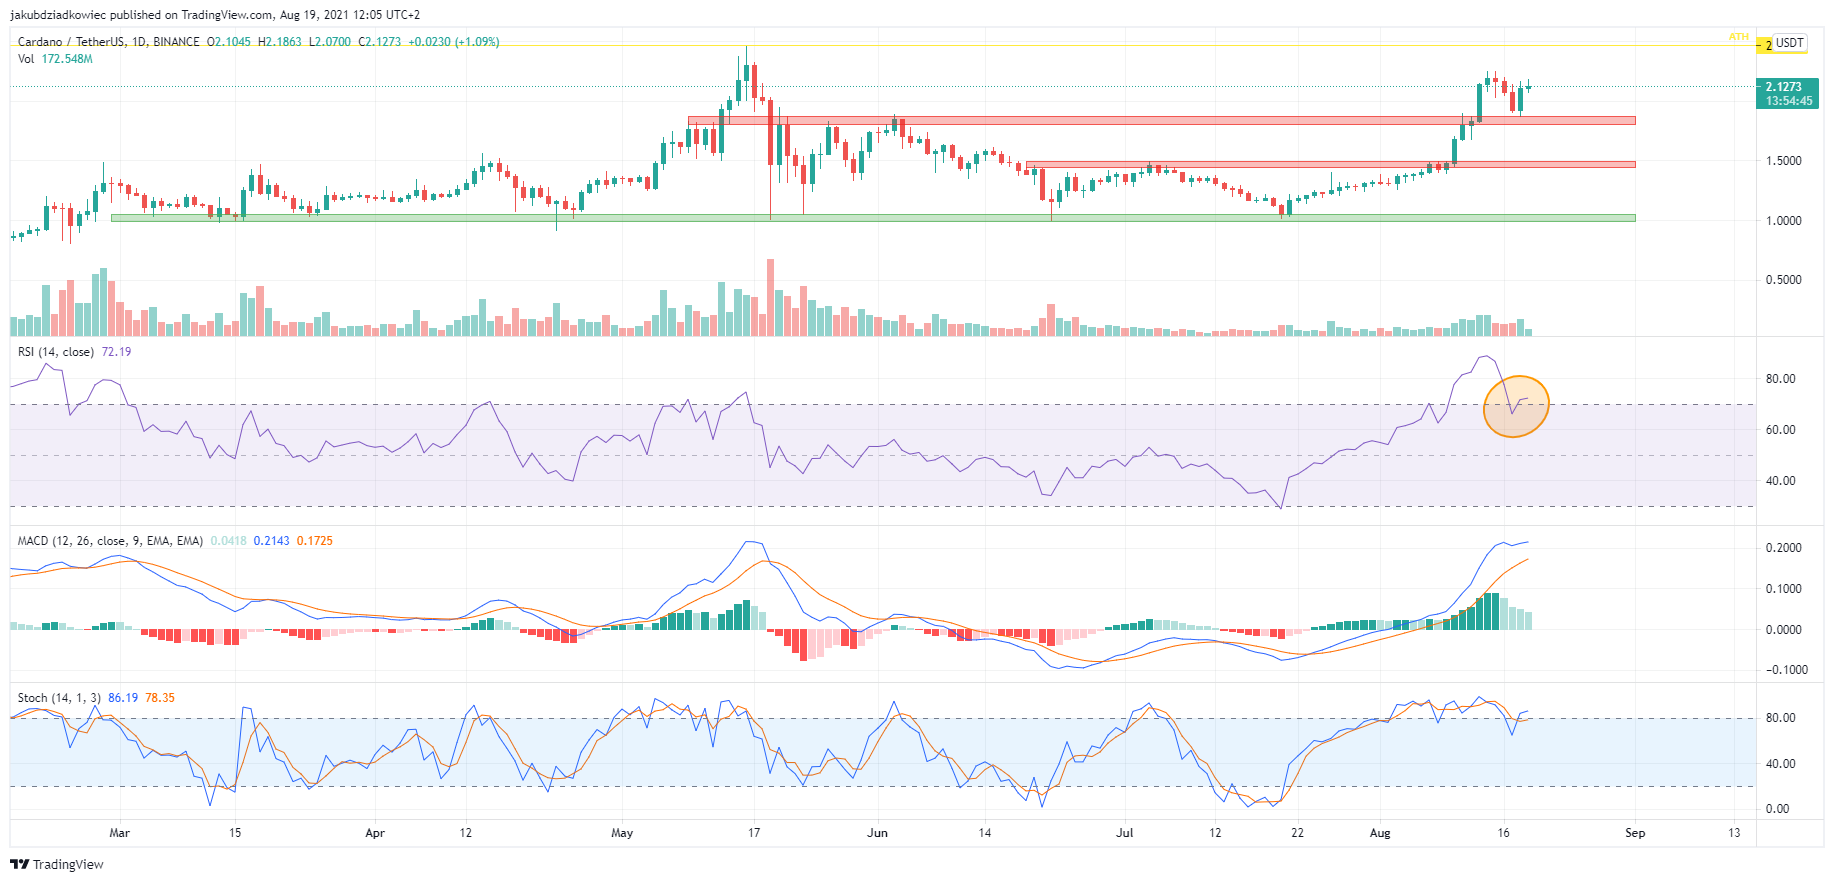
The technical indicators are bullish and support the possibility of a continuation of the uptrend. The RSI has bounced off the border of neutral territory and returned above the 70-line (orange circle). The MACD signal line is rising, despite the indicator generating weaker and weaker green bars of positive momentum. The stochastic oscillator has returned to the overbought territory after forming a bullish cross.
If Cardano breaks through the ATH at $2.47, the next long-term targets can be found through the external Fib retracement. The closest target is $2.87 at the 1.272 Fib retracement level. The next levels to watch above that are $3.38, $3.94, and $4.85, corresponding to the major 1.618, 2, and 2.618 Fib retracements.
ADA/BTC
The price action of the ADA/BTC pair looks even better than its USD counterpart. After forming a double bottom pattern between July 30 and Aug10 and testing the previous peak near 3,193 satoshis (green), ADA started an upward impulse.
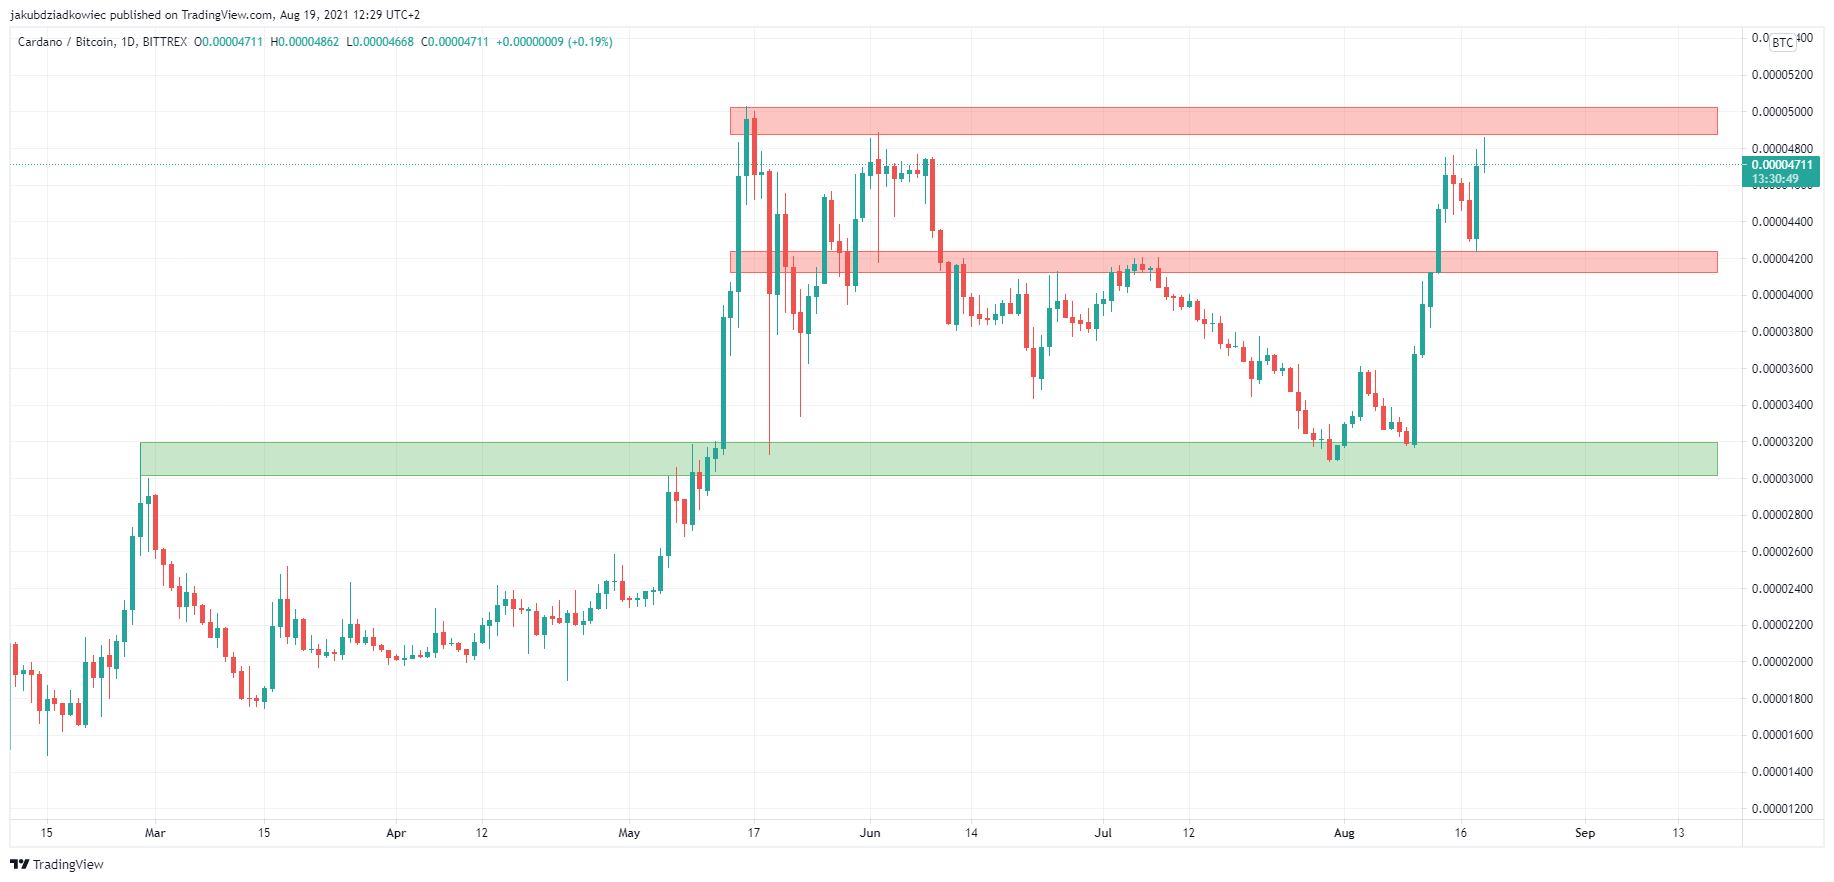
Cardano broke through resistance at 4,236 satoshis and validated this as support on Aug 18. The pair is already testing the top of the range set by the maximum at 5,028 satoshis on May 16.
The technical indicators look similar to the USD pair. The RSI is regaining the 70-line and the MACD is rising despite the decline in positive momentum. The stochastic oscillator is also above the 80-line and in bullish territory.
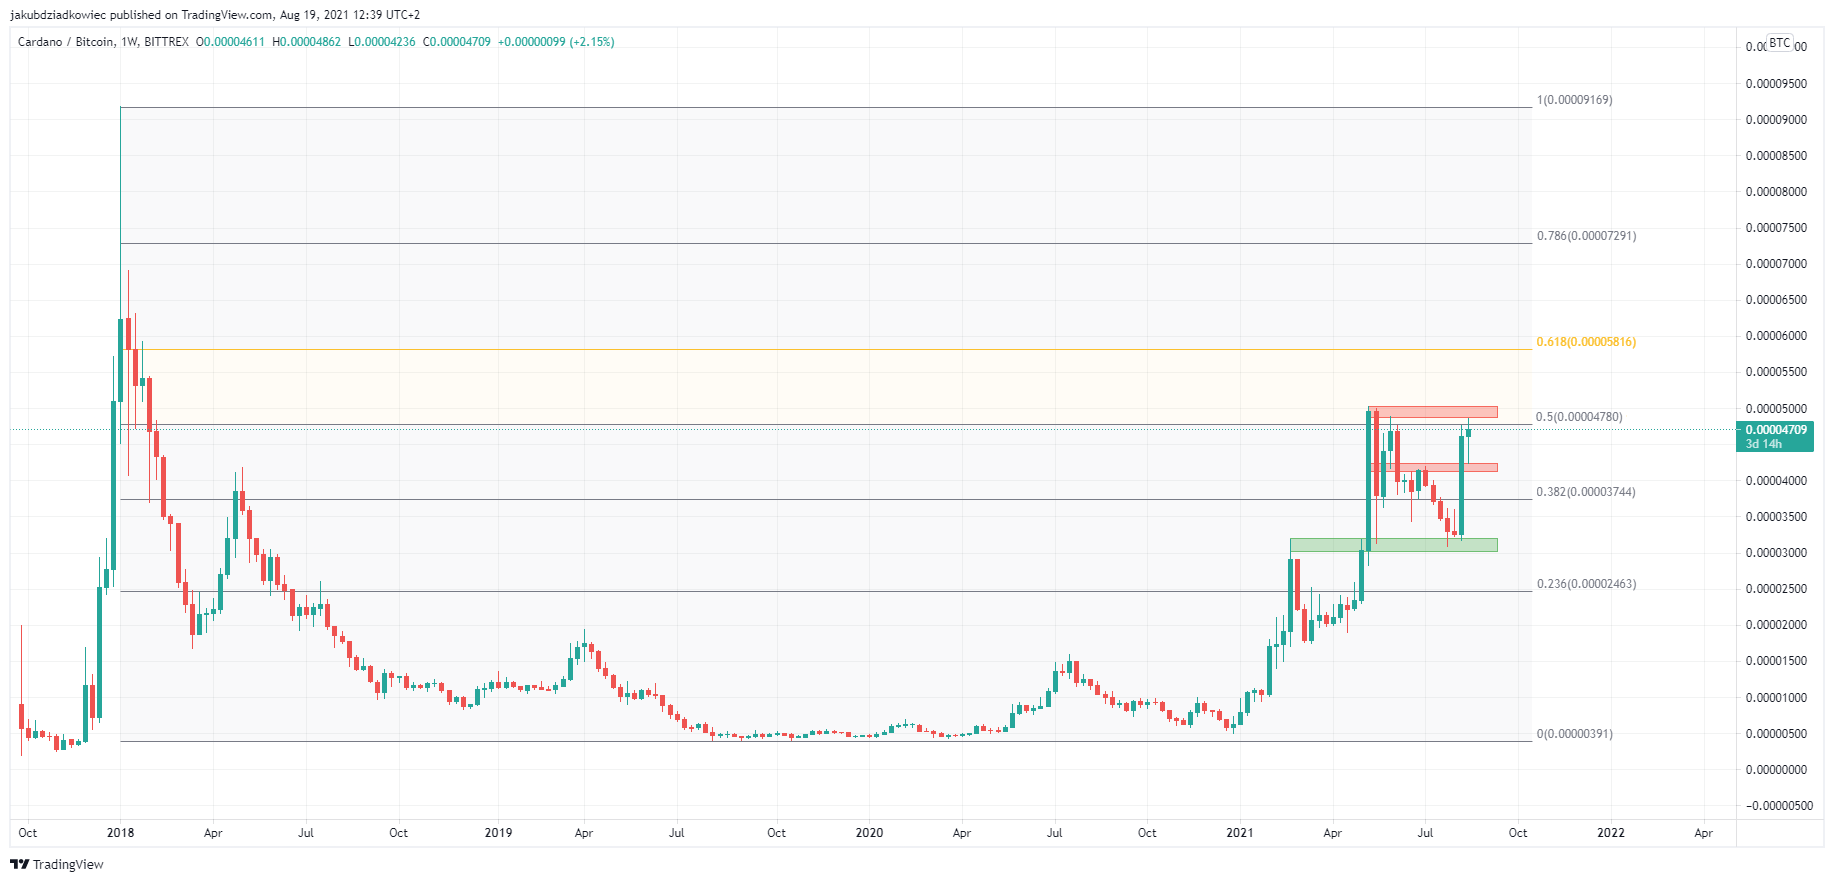
In the long term, we can observe an interesting situation on the weekly chart. ADA is currently at the 0.5 Fib retracement level for the entire downward move from the historical ATH at 9,180 satoshis on Jan 2018 to the bottom at 398 satoshis from Aug 2019.
If the 4,780 satoshi area corresponding to the 0.5 Fib level is broken through, a quick move to 5,816 satoshis at the 0.618 Fib retracement might be in the cards.
For BeInCrypto’s previous Bitcoin (BTC) analysis, click here.
Disclaimer
In line with the Trust Project guidelines, this price analysis article is for informational purposes only and should not be considered financial or investment advice. BeInCrypto is committed to accurate, unbiased reporting, but market conditions are subject to change without notice. Always conduct your own research and consult with a professional before making any financial decisions. Please note that our Terms and Conditions, Privacy Policy, and Disclaimers have been updated.