
Cardano (ADA) has been moving upwards since July 20 and managed to break out from a descending resistance line on Aug 10.
While the upward trend is still intact without a trace of weakness, ADA has to start closing above the $1.75-$1.83 zone in order for the trend to remain bullish.
ADA breaks out
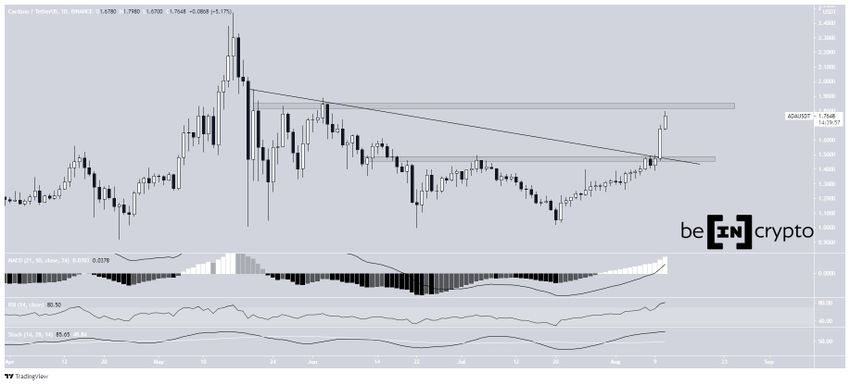
ADA has been moving upwards since July 20 after it reached a local low of $1.02.
It initially stalled once it reached the $1.45 resistance area on Aug 9. This level also coincides with a descending resistance line.
However, ADA managed to break out on Aug 10 and created a large bullish candlestick that caused a breakout from the aforementioned descending resistance line. So far, it has reached a high close of $1.77 on Aug 10.
Technical indicators in the daily time frame are bullish. The MACD is positive, the RSI has crossed above 70, and the Stochastic oscillator is increasing.
The closest resistance area is found at $1.83.
Future movement
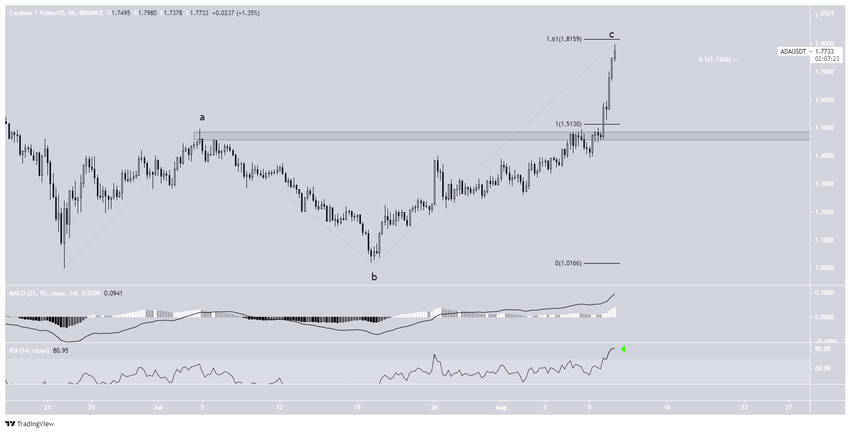
The six-hour chart further supports the outlook from the daily chart. The 0.5 Fib retracement resistance level when measuring the entire downward movement is found at $1.75 (white).
If the entire move is an A-B-C structure (black), waves A:C would likely form in a 1:1.61 ratio. This could lead to a high of $1.81. However, the structure is not yet confirmed.
Similar to the daily time frame, technical indicators are not showing any signs of weakness, even if the RSI is overbought.
If a rejection from this resistance area were to occur, the $1.47 area would be likely to act as support.
ADA/BTC
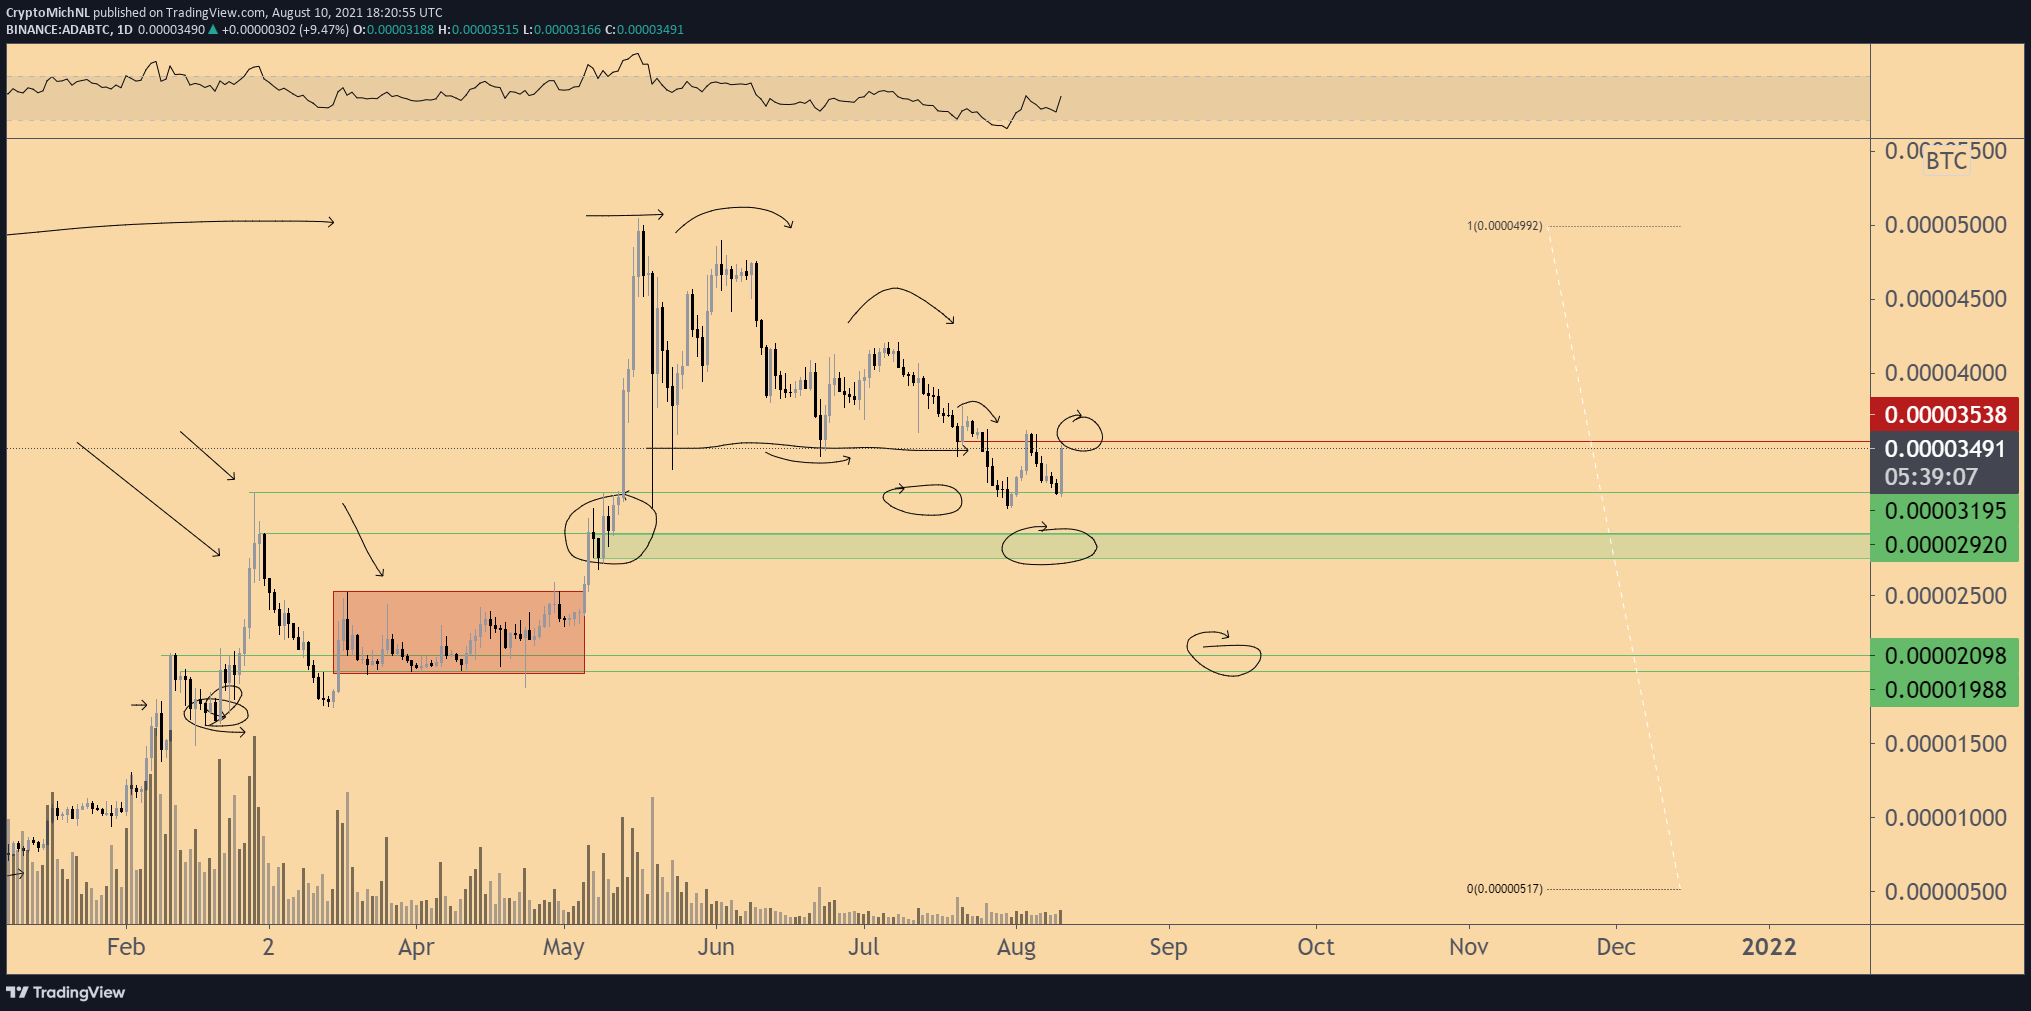
Cryptocurrency trader @CryptoMichNL outlined an ADA/BTC chart, stating that it has to reclaim the 3,600 satoshi resistance area before it could really begin to accelerate.
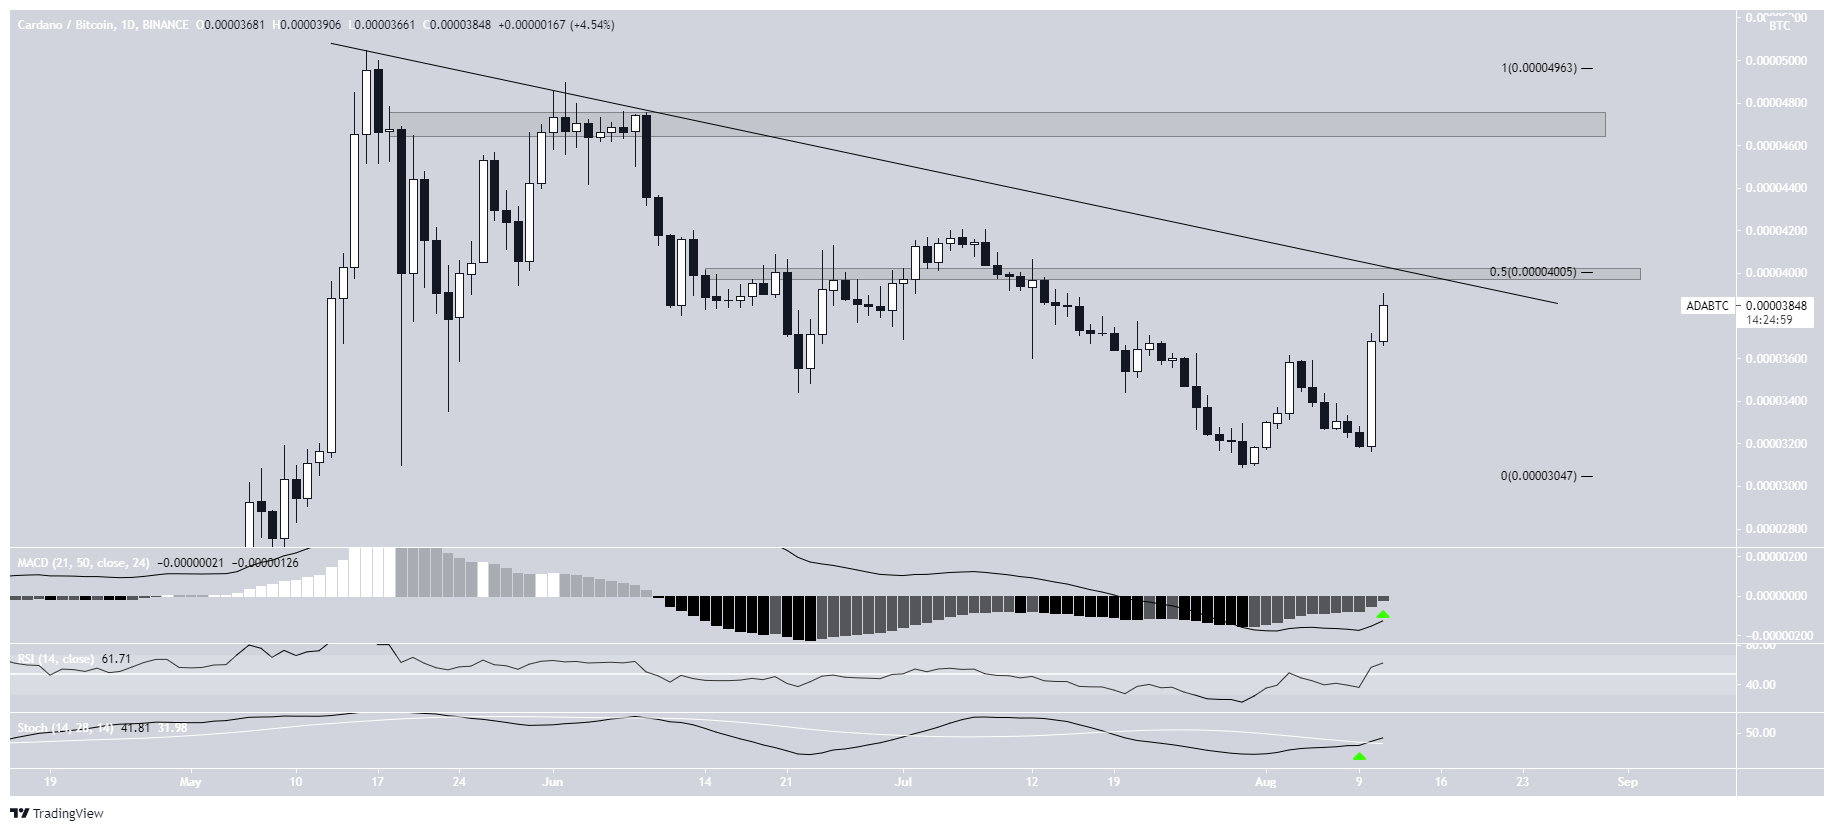
Unlike ADA/USD, it seems that the BTC pair is still following a descending resistance line. The line is currently near 4,000 satoshis, coinciding with the 0.5 Fib retracement resistance level.
Technical indicators in the daily time frame are firmly bullish. The Stochastic oscillator has made a bullish cross, the RSI has moved above 50, and the MACD has nearly crossed into positive territory.
However, until it manages to break out from both the horizontal and diagonal resistance levels, the trend cannot be considered bullish.
For BeInCrypto’s latest bitcoin (BTC) analysis, click here.
