


The Stellar (XLM) price fell sharply last week after a long-term resistance area rejected it.
XLM is attempting to find support inside a short-term pattern, though there are no signs of short-term strength yet. Will the price be able to bounce, or will it break down below it instead?
Stellar Price Falls After Rejection
Stellar’s value has been steadily increasing since the beginning of the year. There was a notable breakthrough in January when the price broke through a descending resistance line that had been in place since the all-time high. Significant upward movements often follow when there is a breakout from a long-term structure. They indicate that the correction has ended.
After the resistance line was confirmed as support, as shown by a green icon, the price of XLM reached the long-standing resistance level of $0.105. But, it failed to break out and created a bearish engulfing candlestick last week.
This is a type of bearish candlestick in which the entire previous period’s decrease is negated in the next one. This is confirmed by a close below the previous periods opening price.
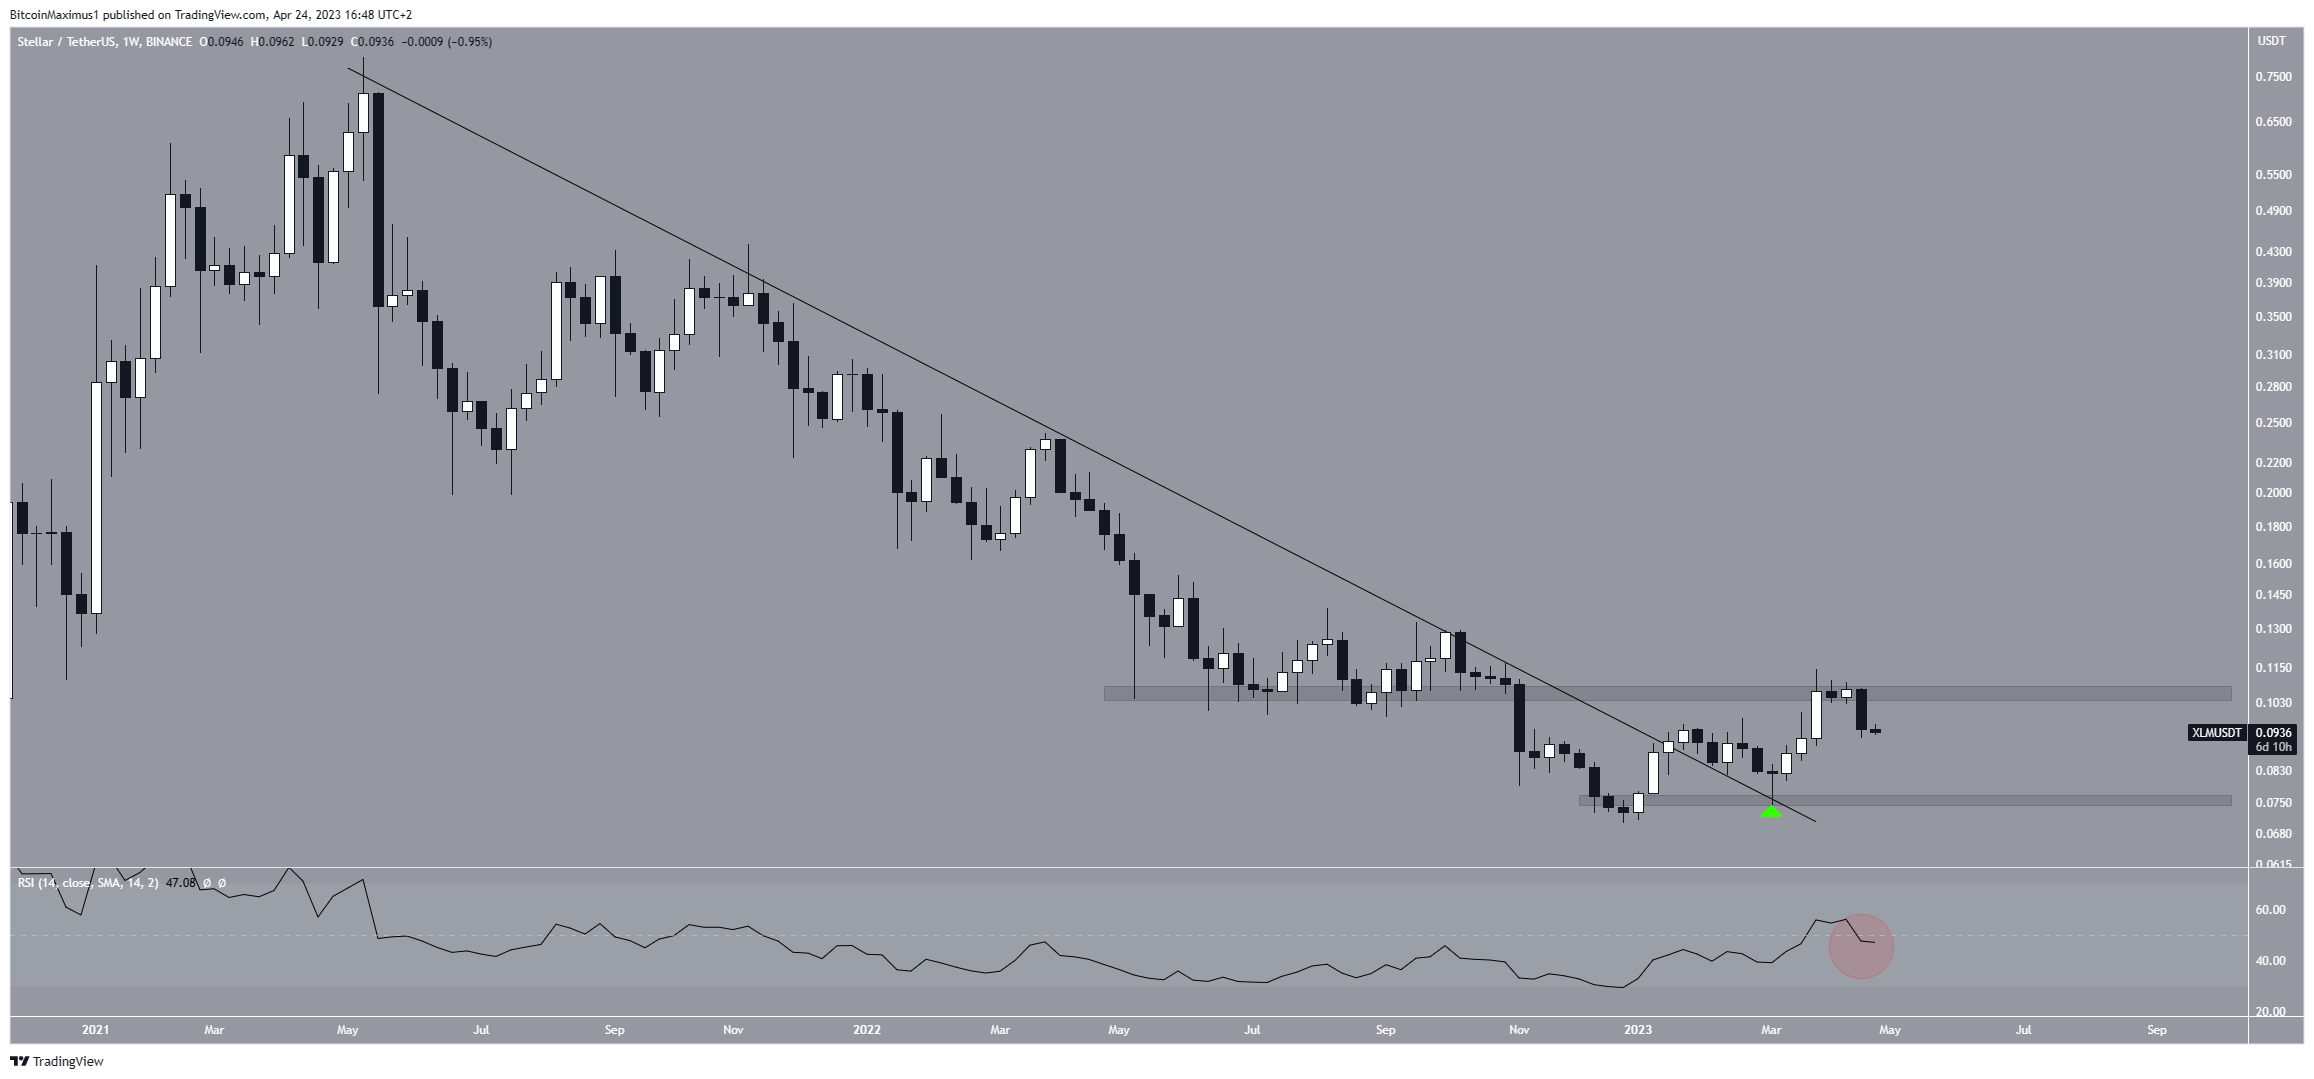
Besides the rejection, the weekly Relative Strength Index (RSI) provides a relatively bearish reading. Traders utilize the RSI as a momentum indicator to assess whether a market is overbought or oversold, and to determine whether to accumulate or sell an asset. Bulls still have an advantage if the RSI reading is above 50 and the trend is upward.
But, if the reading is below 50, the opposite is true. The RSI is currently decreasing and below 50 (red circle), a sign of a bearish trend. If the decrease continues, the closest support area will be at an average price of $0.076.
XLM Price Prediction: Momentum Weakens After Deviation
The technical analysis from the daily time frame aligns with the readings from the weekly one, giving a bearish XLM price prediction.
There are numerous reasons for this. Firstly, the XLM price fell inside an ascending parallel channel’s confines after moving above it. Whenever the price deviates above a resistance level and falls below it afterward, it is considered a sign of weakness, since the breakout could not be sustained. A sharp downward movement often follows this, as was the case in XLM.
Secondly, the movement since the beginning of the year looks like a completed A-B-C corrective structure (black), in which waves A:C had a 1.27 ratio (white). The Elliott Wave theory, employed by technical analysts, involves the analysis of recurring long-term price patterns and investor psychology to determine the direction of a trend.
The A-B-C structure is corrective, and since it is facing upward, it means that the trend is bearish.
Finally, the six-hour RSI has fallen below 50 (red circle) and is decreasing. As a result, the most likely future price outlook is a drop to the patterns support line at $0.080, which is close to the previously outlined horizontal support area.
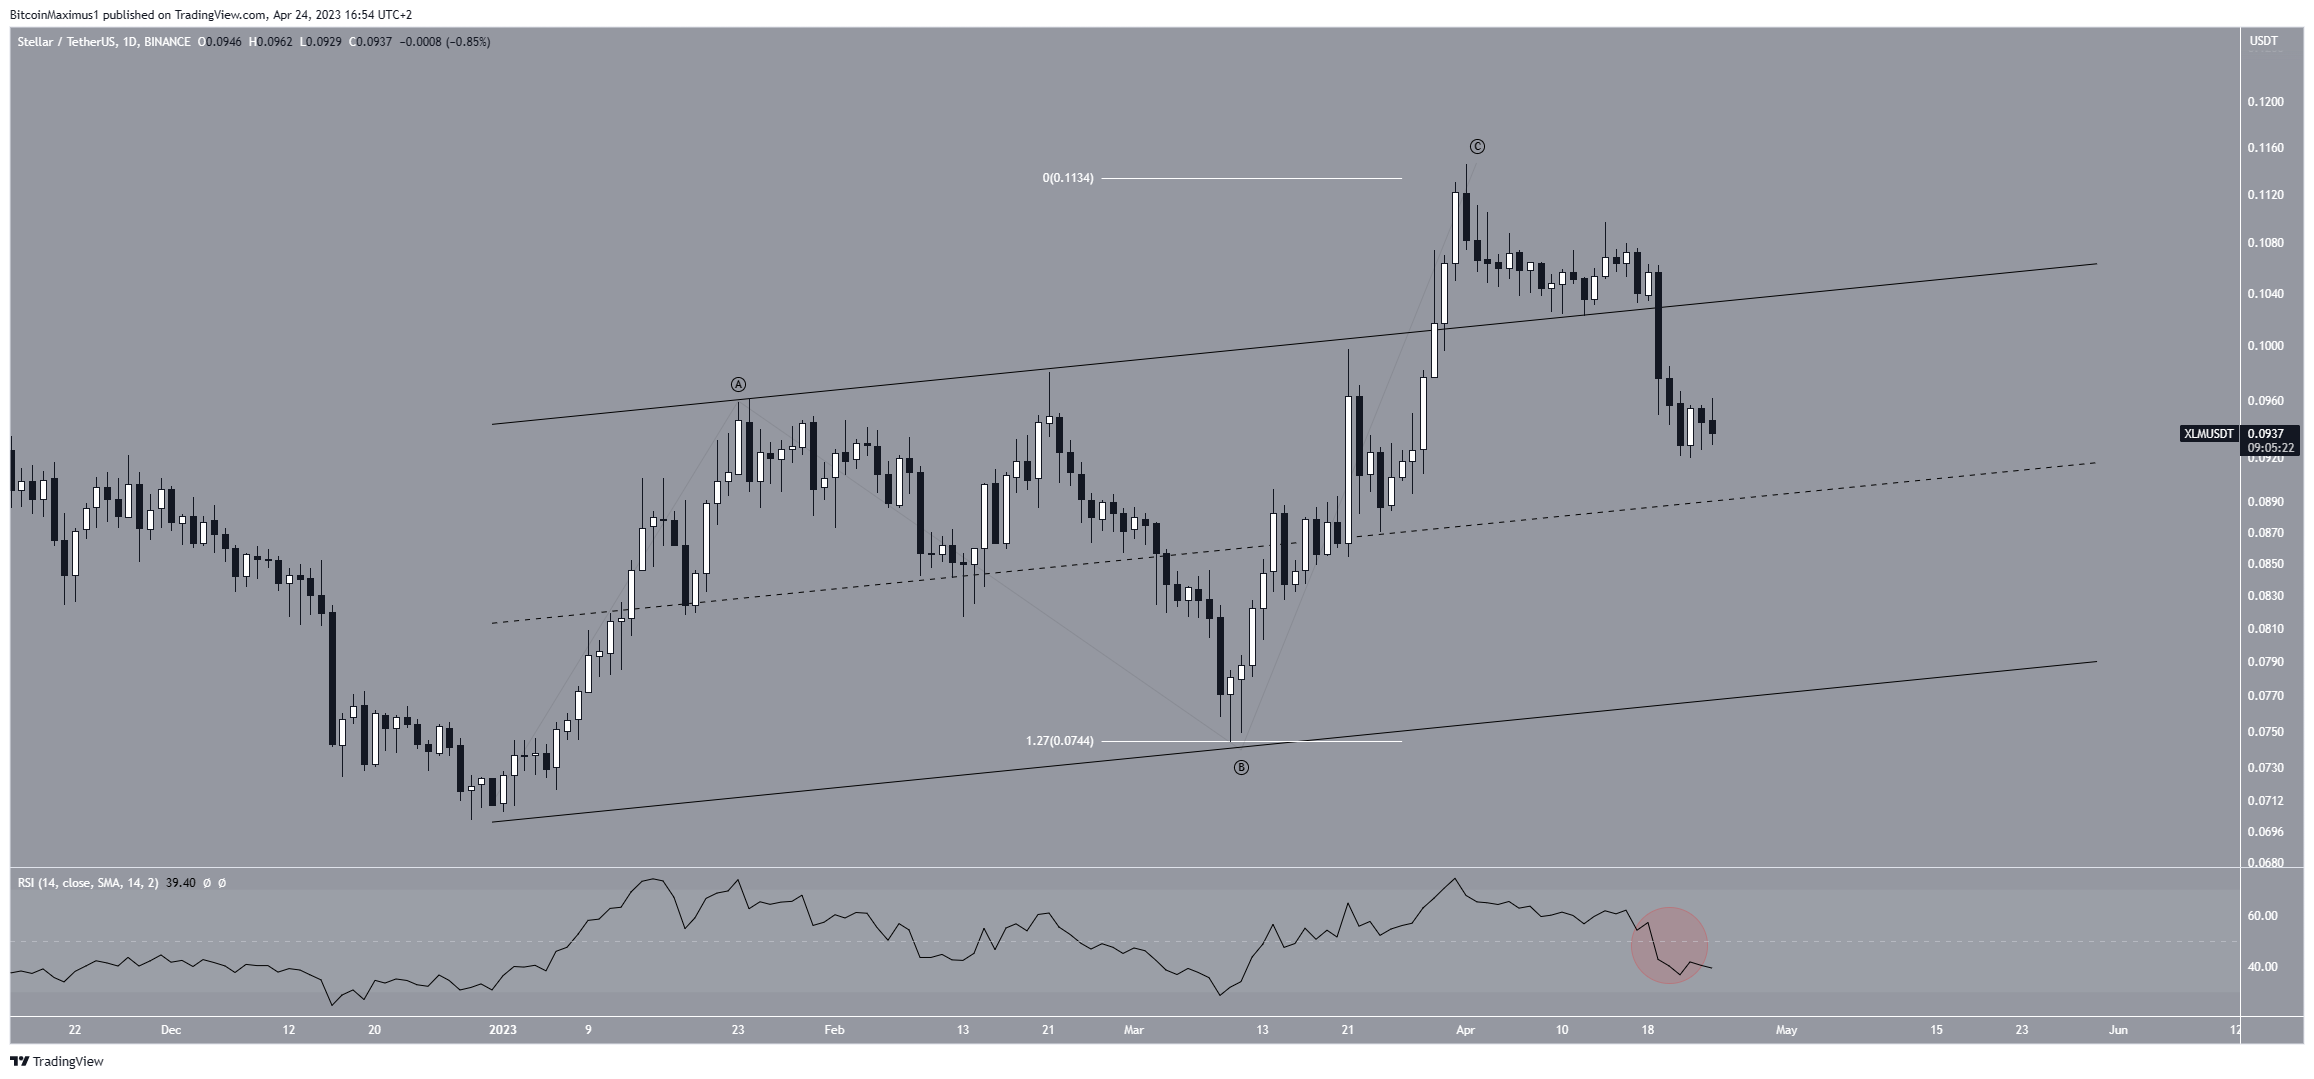
This bearish XLM price prediction will be negated if the price breaks out from the channel. In that case, it could clear the $0.105 resistance area and move toward the next resistance at $0.150.
For BeInCrypto’s latest crypto market analysis, click here.


