


The Ethereum price has been bullish throughout the entire month of February, having increased by 40 percent. The rally stalled on February 14 and ETH has been consolidating since.
Ethereum (ETH) Price Highlights
- There is support at ₿0.0252 and ₿0.0226.
- Ethereum broke out from a descending resistance line.
- A golden cross has transpired.
- The RSI has generated bearish divergence.
Cryptocurrency trader @skeptic_npxs outlined an ETH chart that shows the price struggling to break out above the current resistance. He is suggesting to enter a short trade, since he believes that the ETH price will decrease — giving a target of ₿0.0257 for the ensuing movement.
https://twitter.com/skeptic_npxs/status/1231821992120045569
Will the Ethereum price reach its target, or will it break out instead? Continue reading below if you are interested in finding out.
This analysis will deal with the ETH/BTC pair. Click here for the USD pair.
Resistance Breakout
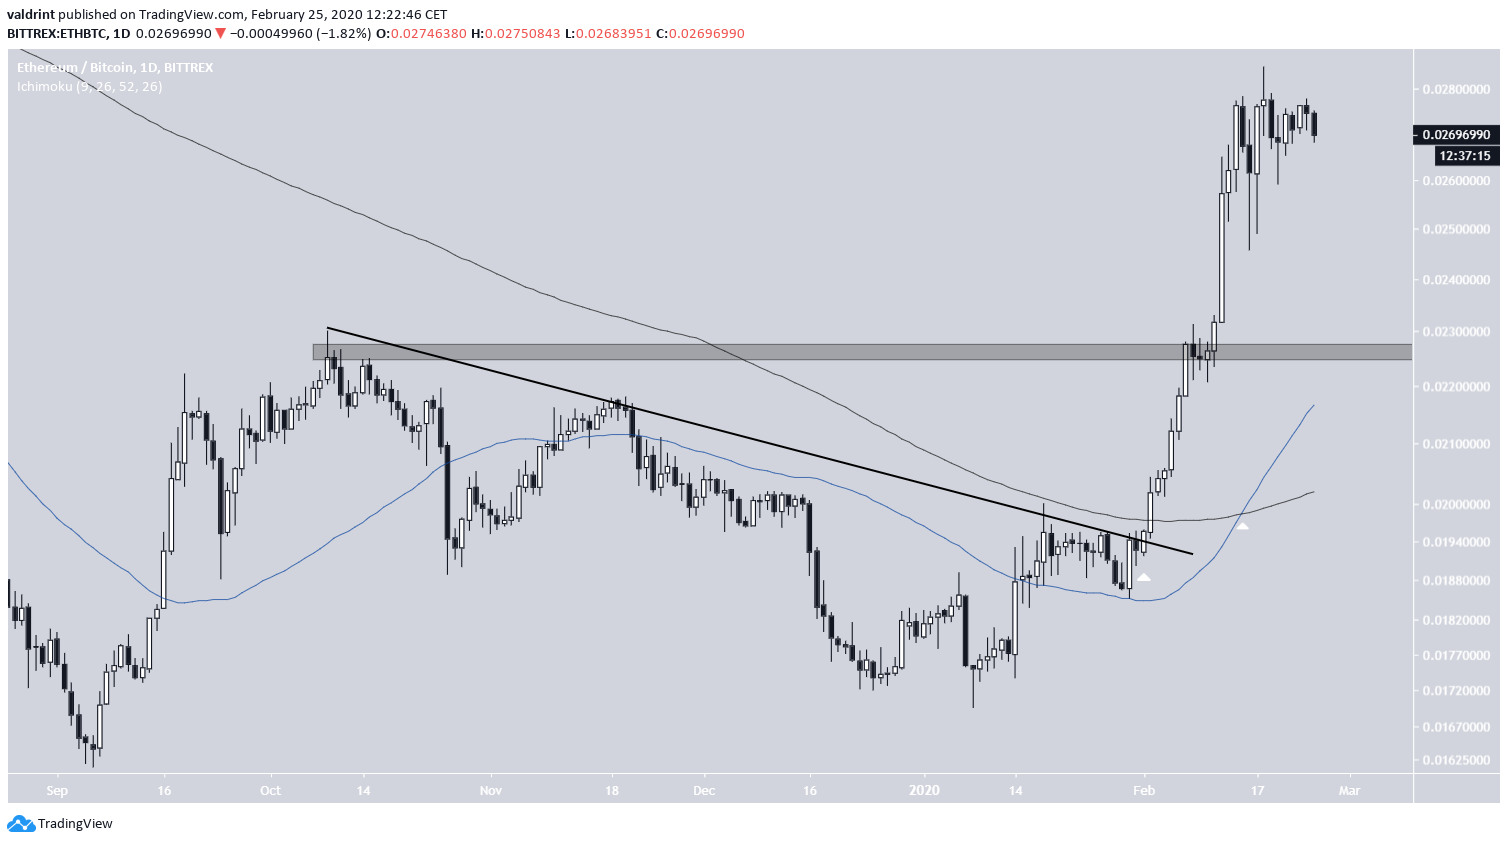
The Ethereum price had been following a descending resistance line since October 9, 2019, when the price reached a high of ₿0.023.
The price broke out above this resistance line on February 2. A bullish cross between the 50- and 200-day moving averages (MAs) followed shortly afterward on February 15.
Since breaking out above the ₿0.0226 resistance area, the price has yet to return and validate it as support. Let’s take a closer look at the short-term and see if it is likely to do so.
Bearish Divergence
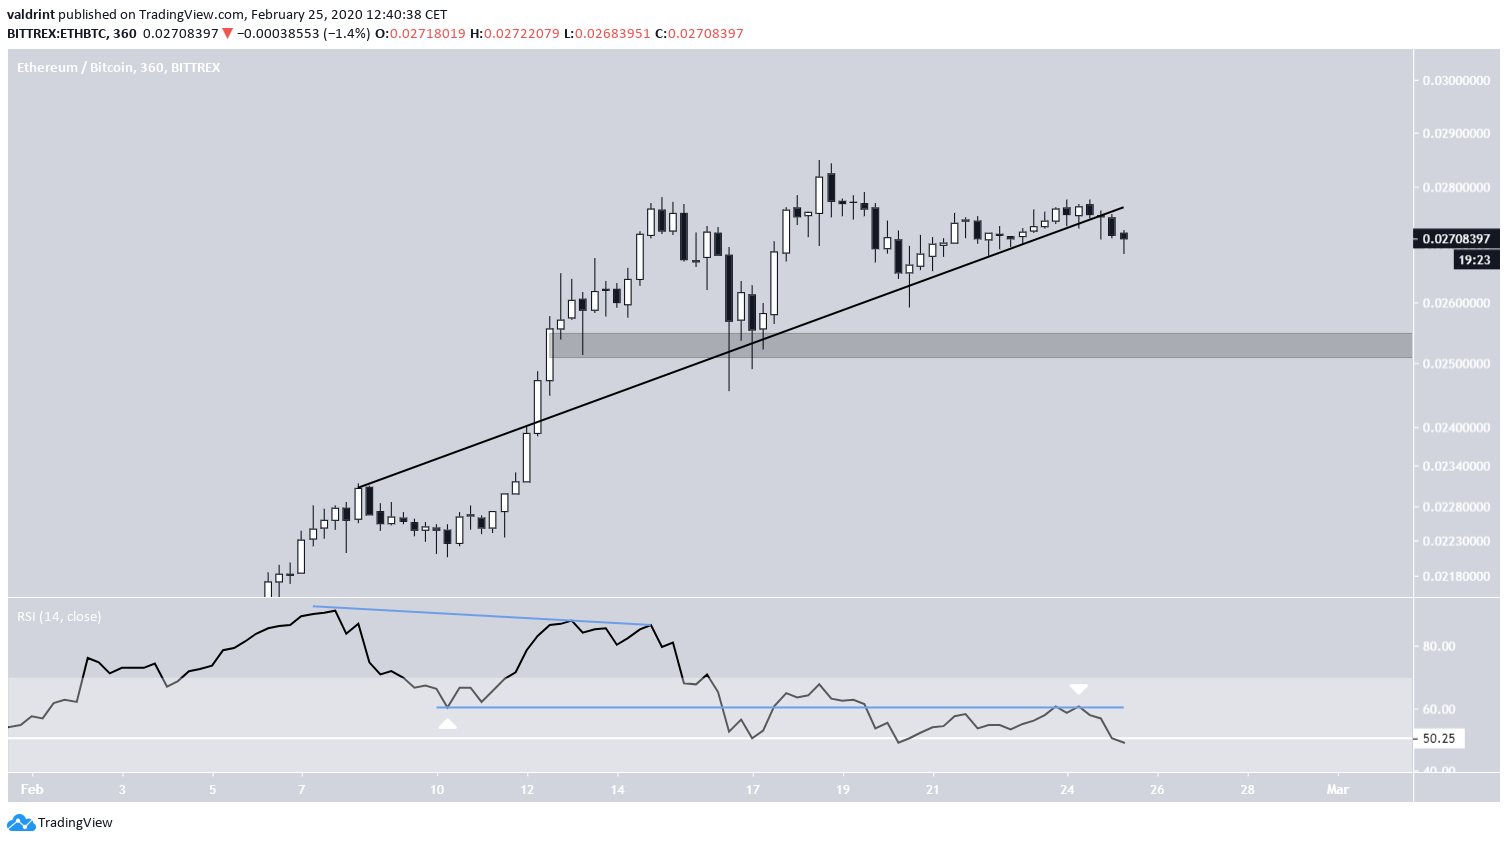
In the shorter-term, the Ethereum price has just broken down below an ascending support line. We can see a support area at ₿0.0252 that has been validated thrice.
The RSI is bearish and indicates that the current breakdown is valid. It initially generated bearish divergence and afterward completed a failure swing top. If it falls below 50, it would confirm that the price will reach the support at ₿0.0252, fitting with the target given in the tweet.
Long-Term Ethereum Retracement
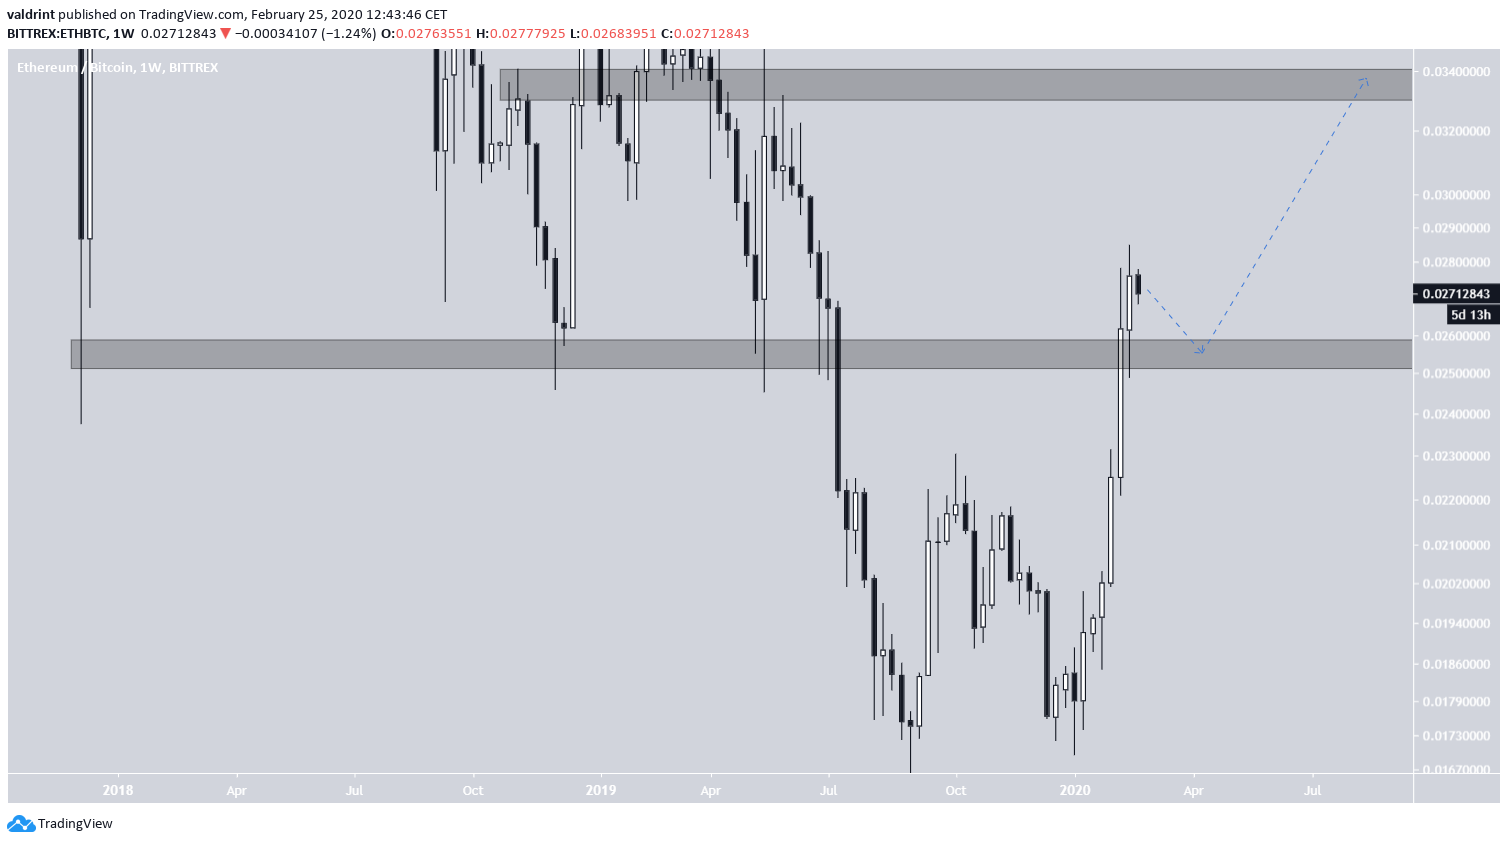
A look at the weekly chart reveals that a deeper retracement is unlikely and the price is not expected to validate the breakout level at ₿0.0226.
The area at ₿0.025 acted as support for the entirety of 2018 and half of 2019 before the price broke down. This makes it a very important area. Since the price broke out above it, we are not expecting the price to fall back down.
Therefore, after a possible decrease inside this area, we would expect the price to continue increasing all the way to ₿0.034.
To conclude, the long-term outlook for Ethereum is bullish and the price is expected to reach ₿0.034. However, a short-term decrease could occur initially, taking the price to ₿0.025.


