


The Bitcoin price has reached an important resistance line which has been in place since the price reached an all-time high in December 2017.
Well-known trader @PostyXBT tweeted a Bitcoin price chart that shows that the price is trading at a very critical resistance level.
Posty believes that even though the possibility that Bitcoin will increase remains, he does not want to go long at such a confluence of resistance levels, stating that :
Personally not longing into horizontal and diagonal resistance here. Need to see a clean break here and then look for opportunities. Could be a great place to short but shorting an uptrend has never gone well for me. Maybe after the halving if we’re still around here.
Bitcoin’s Long-Term Resistance
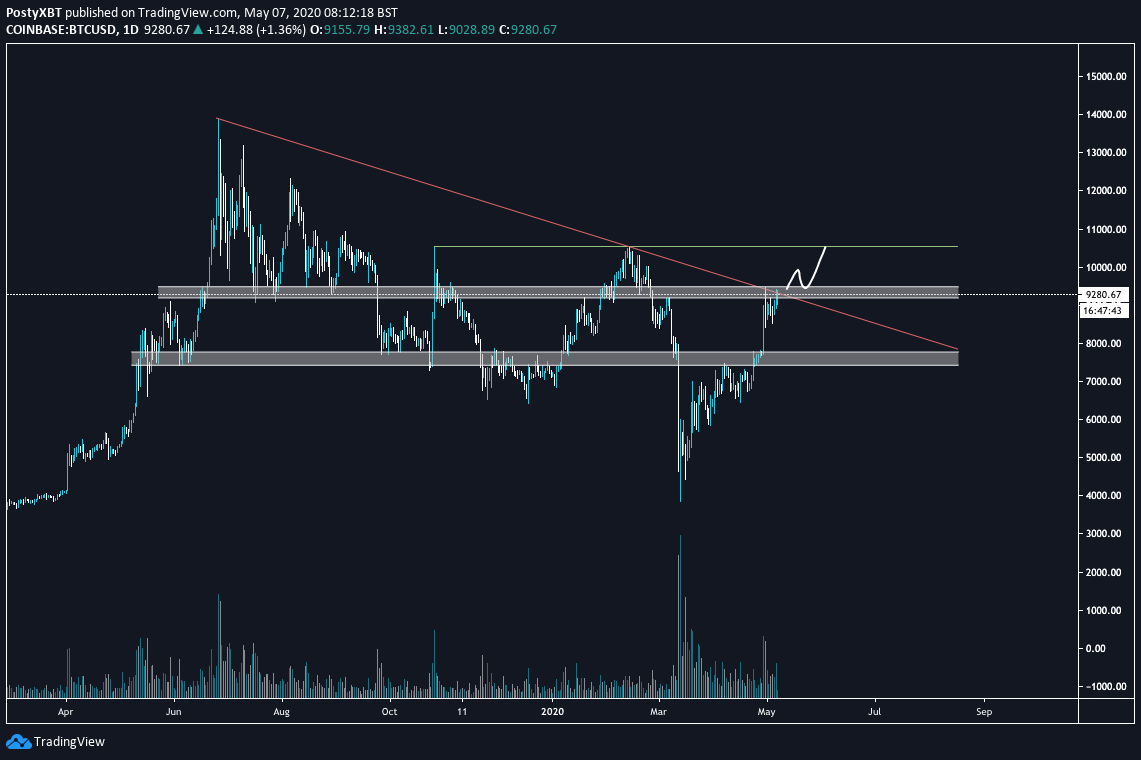
The Bitcoin price has been following a descending resistance line for the past 875 days, more specifically since reaching an all-time high price in December 2017. At the time of writing, the price was trading directly under this resistance line, validating it for the fifth time. In addition, the price is trading inside a minor resistance area, found at $9,300.
Each time the BTC price has reached this line, it has initiated a rapid downward move. However, these movements have also been combined with an increase above the upper Bollinger Band, which is not the case in the current movement. This means that the rally is not overextended and BTC could possibly break out.
If BTC breaks out, it would still be likely to retrace after it reaches $10,500. We have outlined one such wave count here.

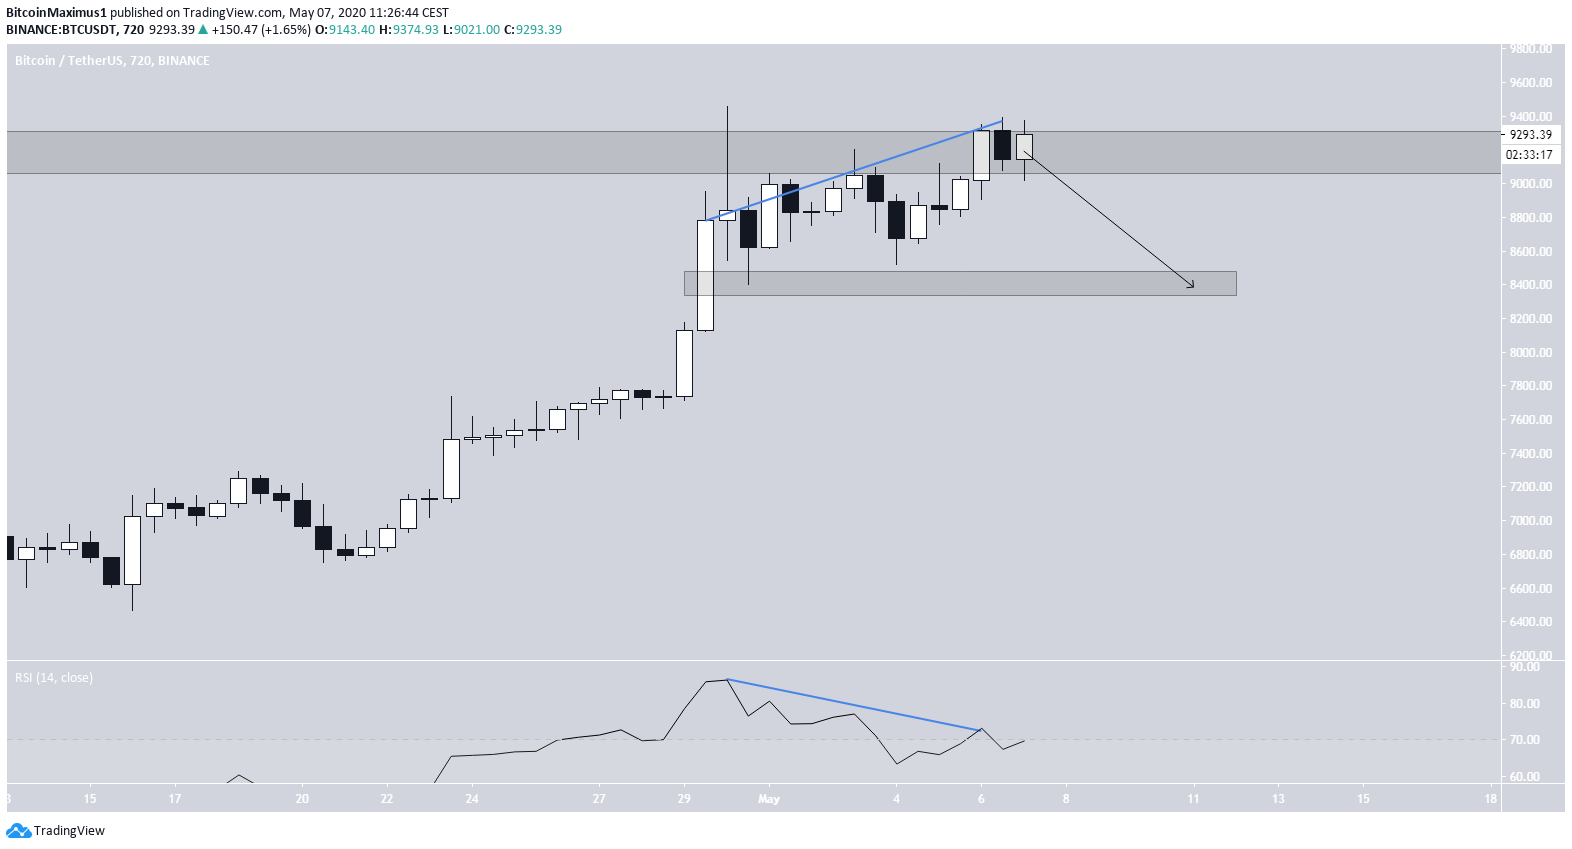
However, time-frames up to the 12-hour are bearish and show a very considerable bearish divergence developing in the RSI. Since this is occurring at a confluence of numerous resistance areas, it makes it likely that the price will not be able to break out above this resistance without first retracing.
Wyckoff Distribution
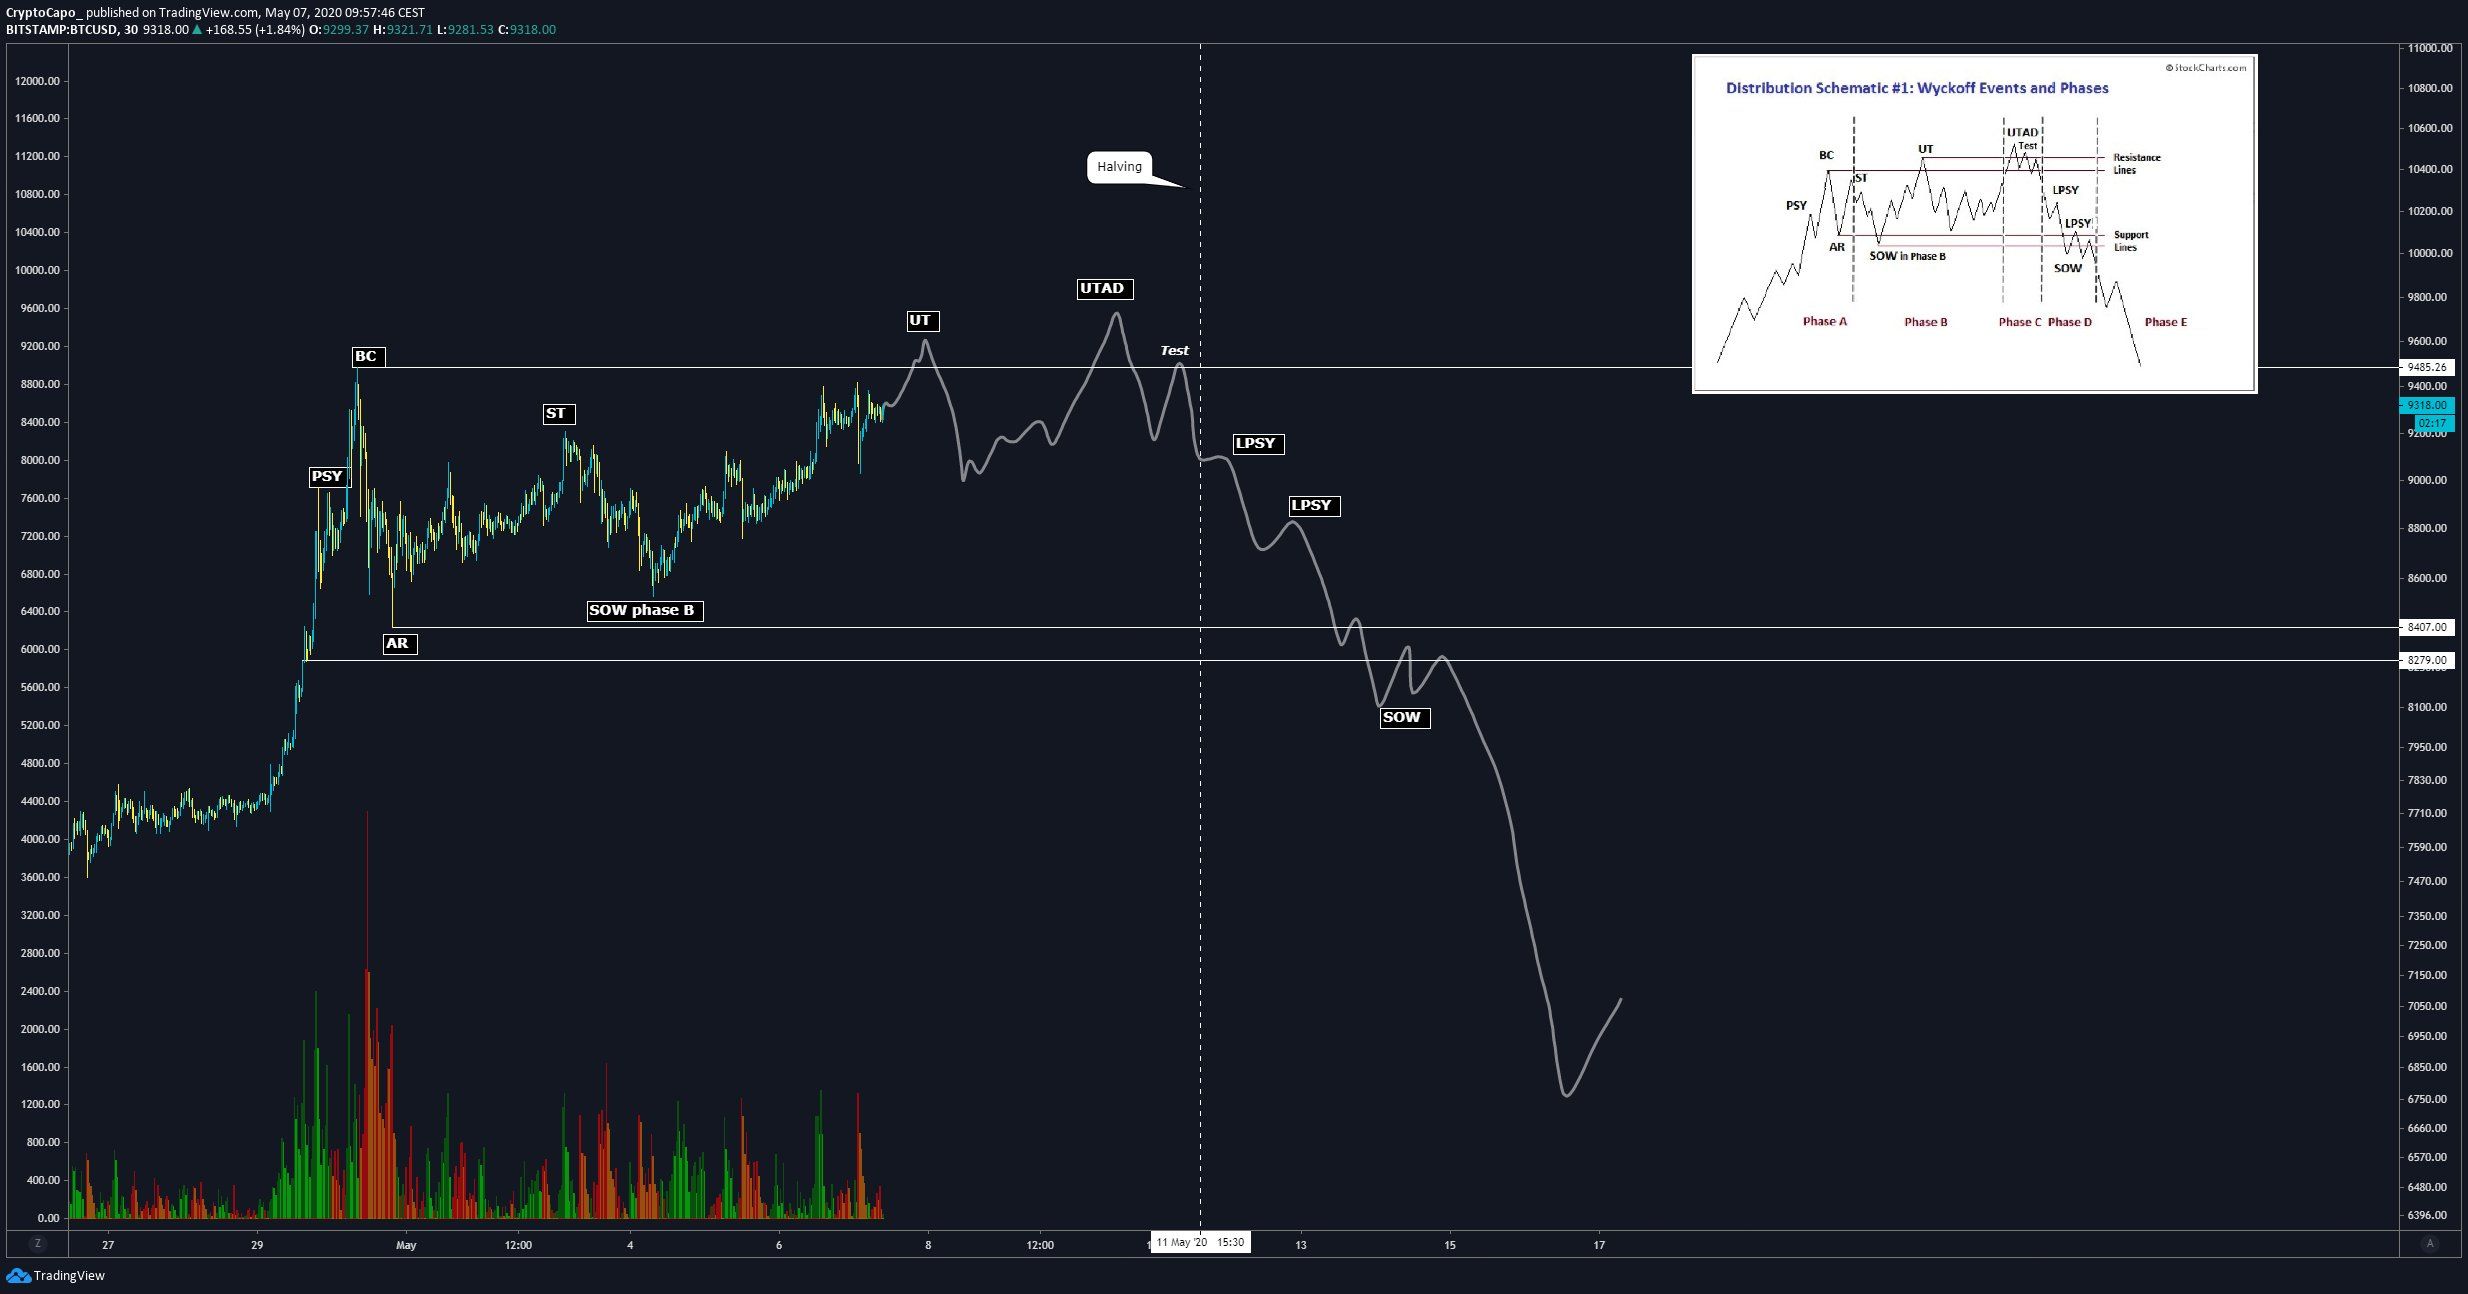
In the short-term, one possible way that this decrease would play out is in the form of a bearish Wyckoff distribution. One such movement was outlined by cryptocurrency trader @CryptoCapo_, who tweeted the following chart:
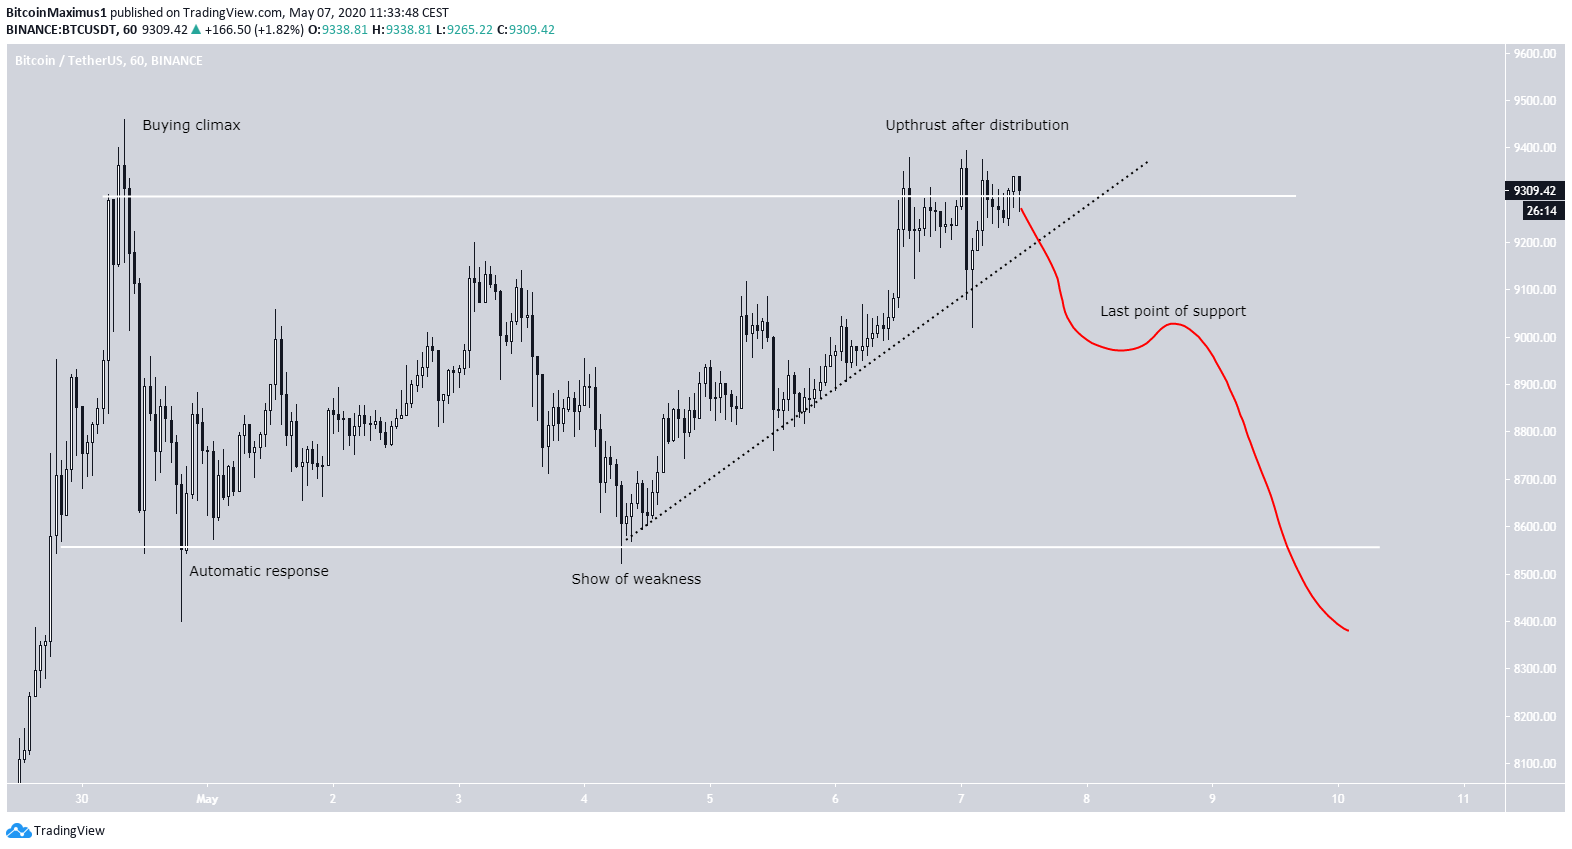
We outlined the possibility of this distribution in our previous article, so now seems like a good time to revisit this prediction. Since our article, the price has successfully completed the ‘show of weakness’ and is in the process of completing the ‘upthrust after distribution’ phase.
This particular pattern would be completed by a breakdown below the ascending support line (dashed), which would, in turn, create the ‘last point of support,’ and be followed by a breakdown.
To conclude, the Bitcoin price has reached a crucial resistance level and is possibly following a bearish Wyckoff distribution pattern. If the pattern is completed, the price will gradually decrease towards $8,500 before eventually breaking down.


