


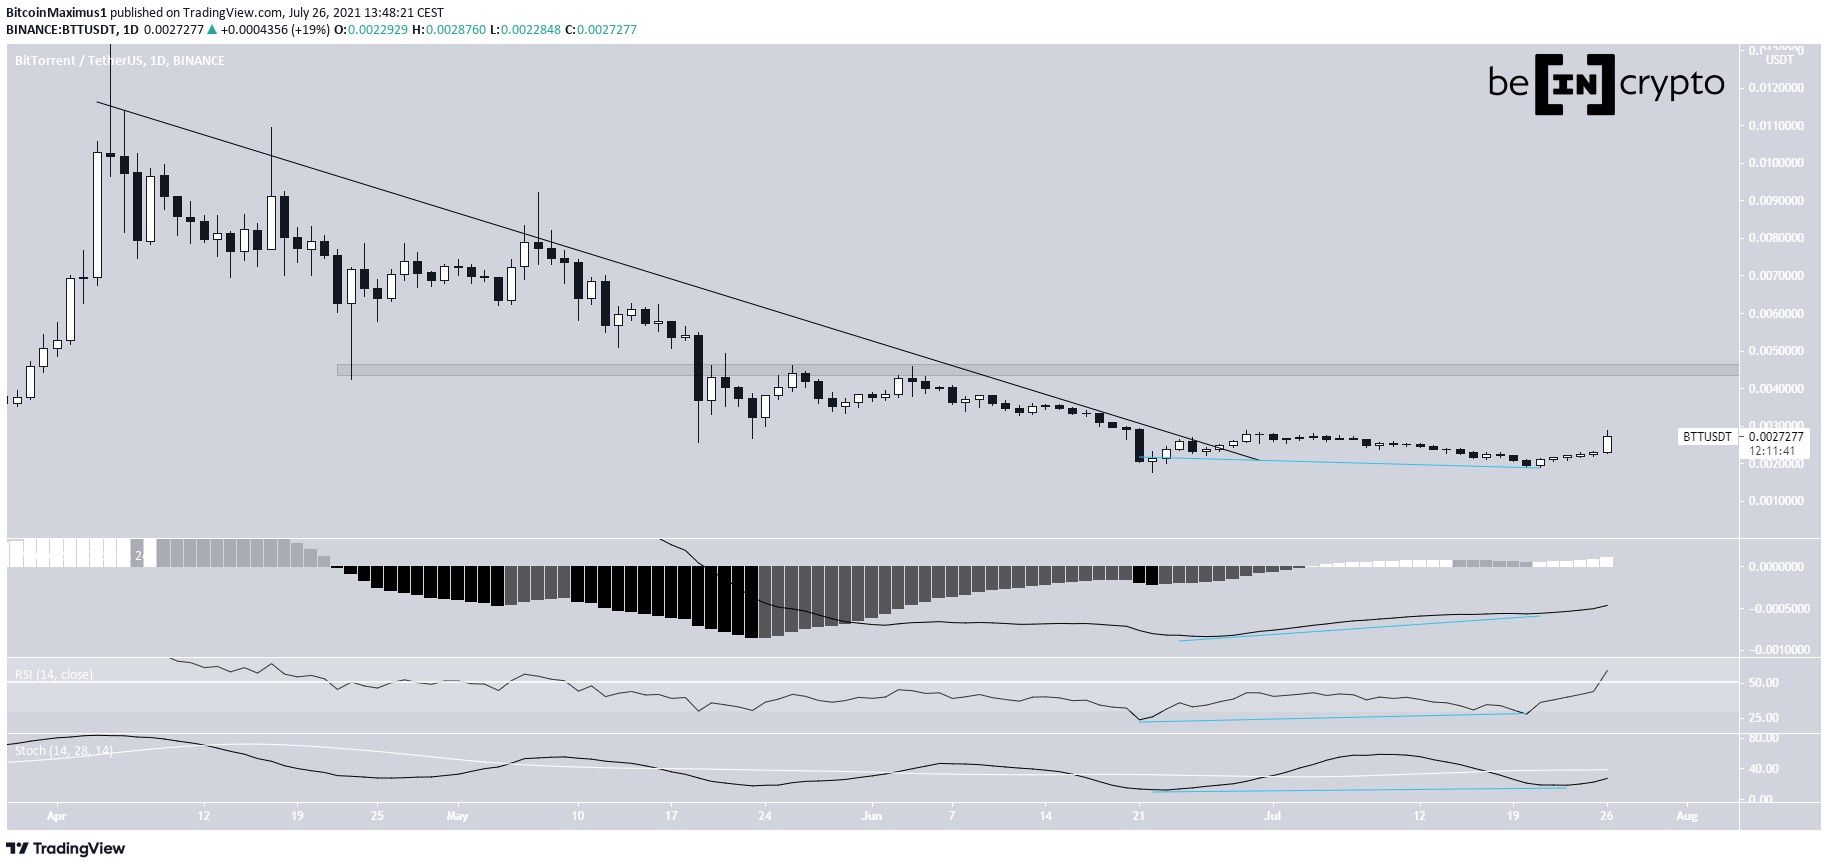
BitTorrent (BTT) has broken out from a descending resistance line and created a double bottom pattern afterwards.
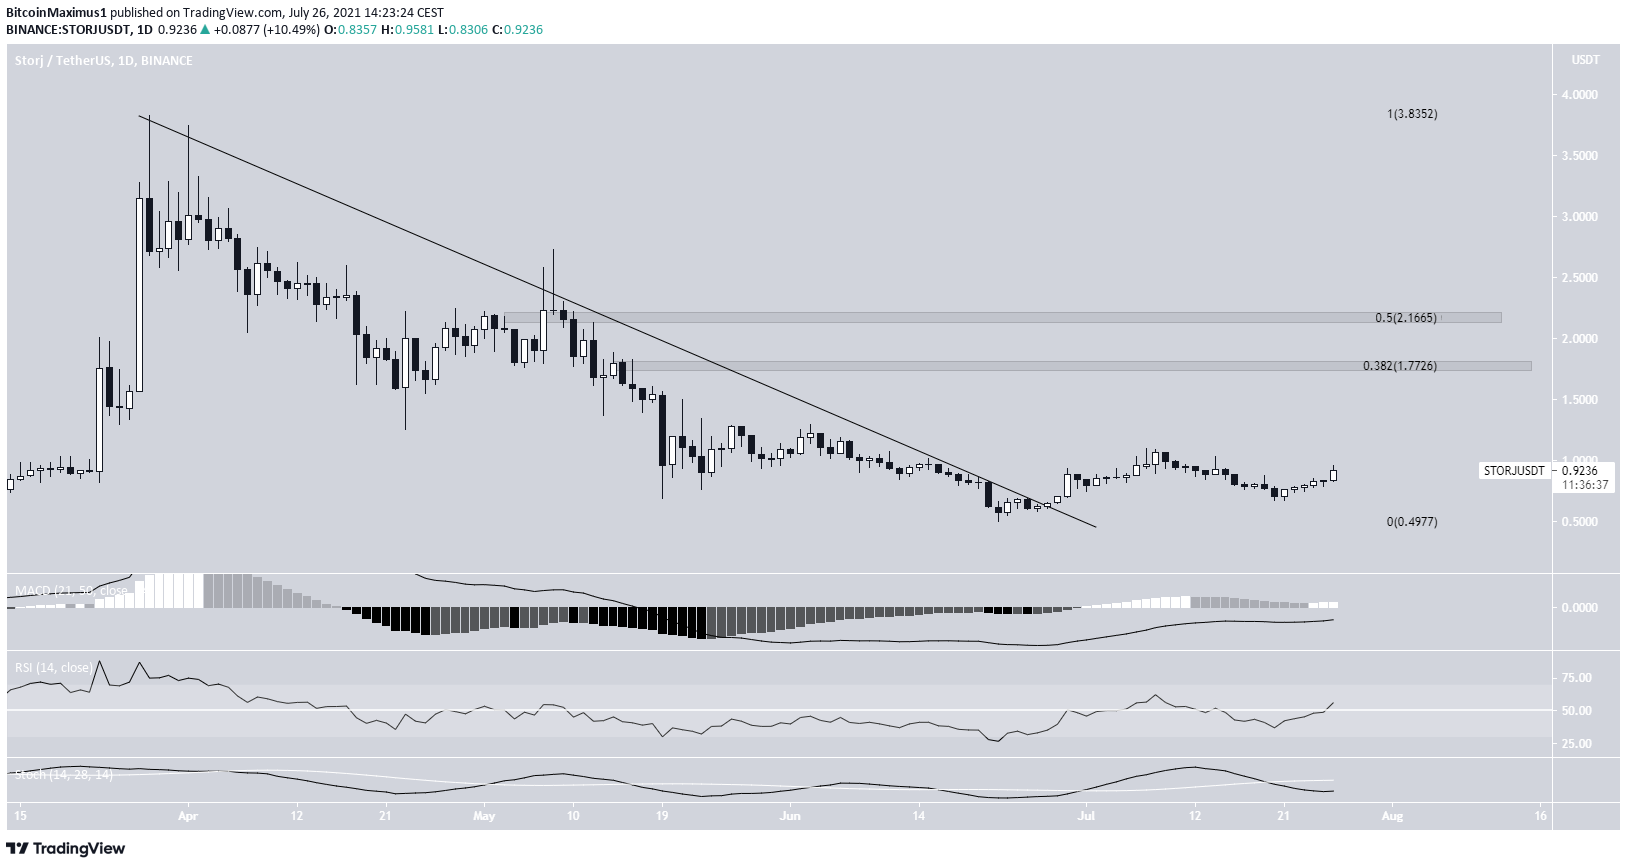
Storj (STORJ) has created a higher low after breaking out from a descending resistance line.
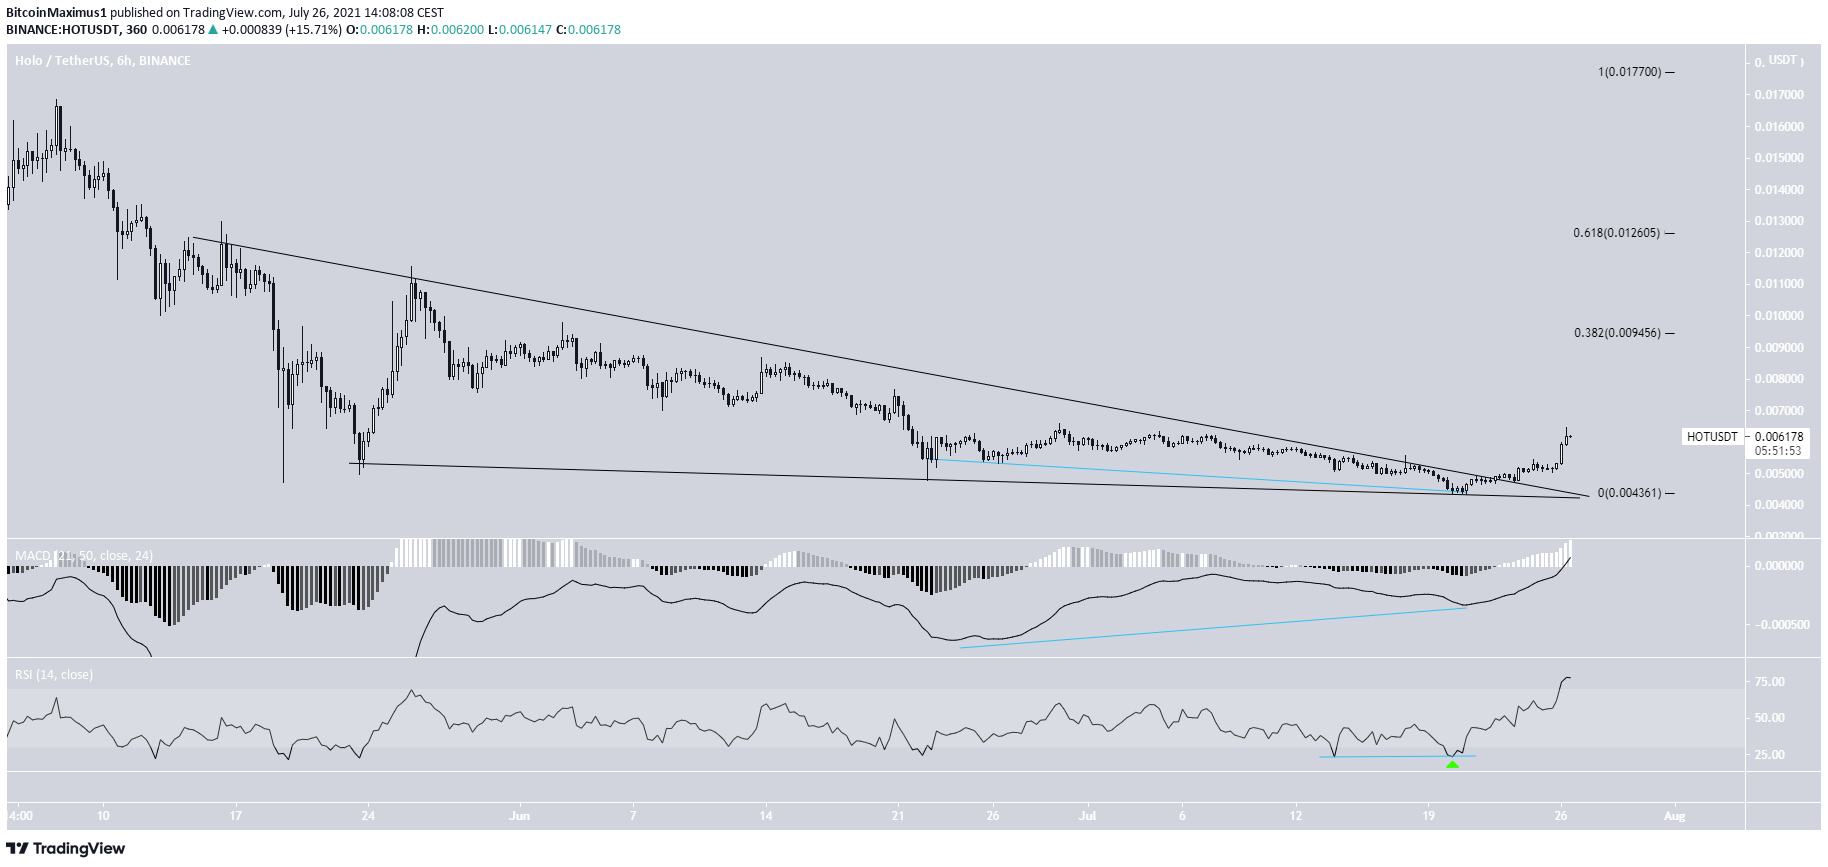
Holo (HOT) has broken out from a descending wedge.
BTT
BTT has been moving downwards since April 5, when it reached an all-time high price of $0.135. The decrease followed a descending resistance line, leading to a low of $0.00177 on June 22.
After four unsuccessful attempts, BTT finally managed to break out on June 27. The token returned towards its June 22 lows afterwards, creating a double bottom. The pattern was combined with bullish divergences in the MACD, RSI & Stochastic oscillator. These are all signs that an upward movement is likely.
If one occurs, the closest resistance area would be at $0.0045.
Highlights
- BTT has broken out from a descending resistance line.
- It has created a double bottom pattern.
STORJ
Similarly to BTT, STORJ had been following a descending resistance line since March 28. The eventually led to a low of $0.50, reached on June 22.
The token has been moving upwards since, and broke out from the resistance line on June 25.
Despite the breakout, technical indicators have not yet turned bullish. The MACD is increasing, but is still below 0. The RSI is right at the 50 line. The Stochastic oscillator has yet to make a bullish cross.
Nevertheless, the closest resistance areas are at $1.77 and $2.16, respectively. These are the 0.382 and 0.5 Fib retracement resistance levels.
The shorter-term two-hour chart is more bullish.
The move beginning on June 22 resembles a five wave bullish impulse, while the ensuing decrease looks corrective.
In addition to this, STORJ bounced after deviating below the 0.618 Fib retracement support level.
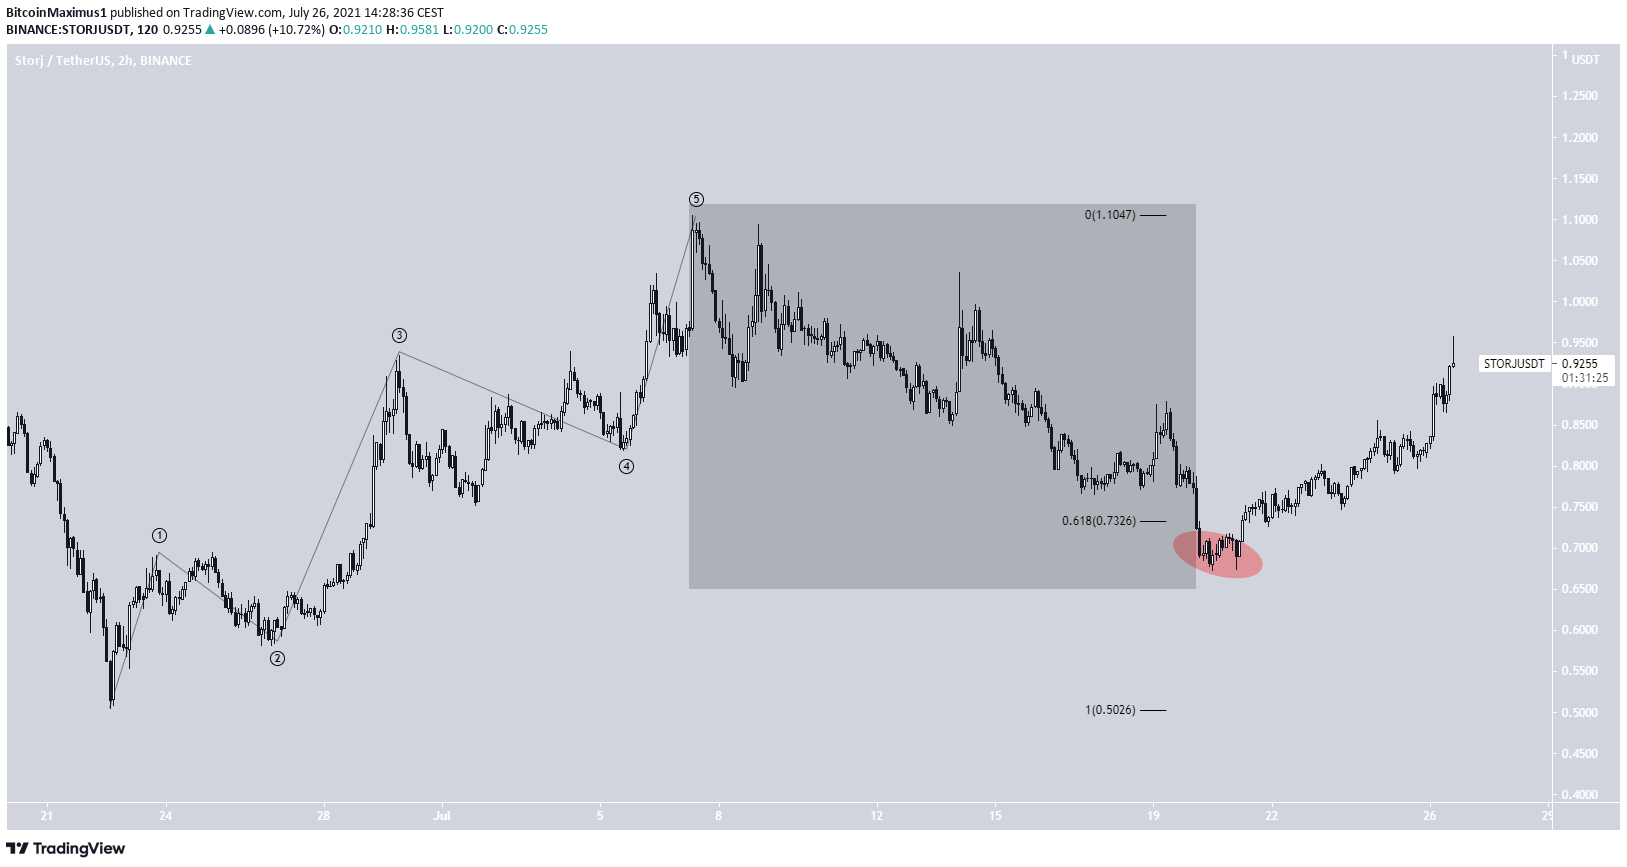
Therefore, it is likely that the token will increase towards the previously outlined resistance areas.
Highlights
- STORJ has broken out from a descending resistance line.
- It has created a higher low.
HOT
HOT had been decreasing inside a descending wedge since May 16. This led to numerous lows, most recently $0.0043 on July 20.
The bottom was combined with bullish divergence in the MACD & RSI and a heavily oversold reading in the latter. Afterwards. HOT managed to break out.
The closest resistance areas are at $0.0094 and $0.012. These are the 0.382 and 0.618 Fib retracement resistance levels, respectively.
Highlights
- HOT broke out from a descending wedge.
- There is resistance at $0.0094 and $0.012.
For BeInCrypto’s latest bitcoin (BTC) analysis, click here.
