
The Bitcoin Dominance Rate (BTCD) is struggling to move above an important horizontal level, the reaction to which is crucial in determining the future trend.
Breakout From Resistance
The Bitcoin dominance rate has been declining alongside a descending resistance since reaching a high of 64.49% on June 27. The fall continued until the rate reached a low of 57.51%, on Sept.2 and began the current upward move. Shortly afterwards, BTCD broke out from the descending resistance line, validated it as support and is currently making another attempt to break out above the 60.30% resistance area. A breakout would likely trigger a significant rally that could take BTCD towards 62.80%.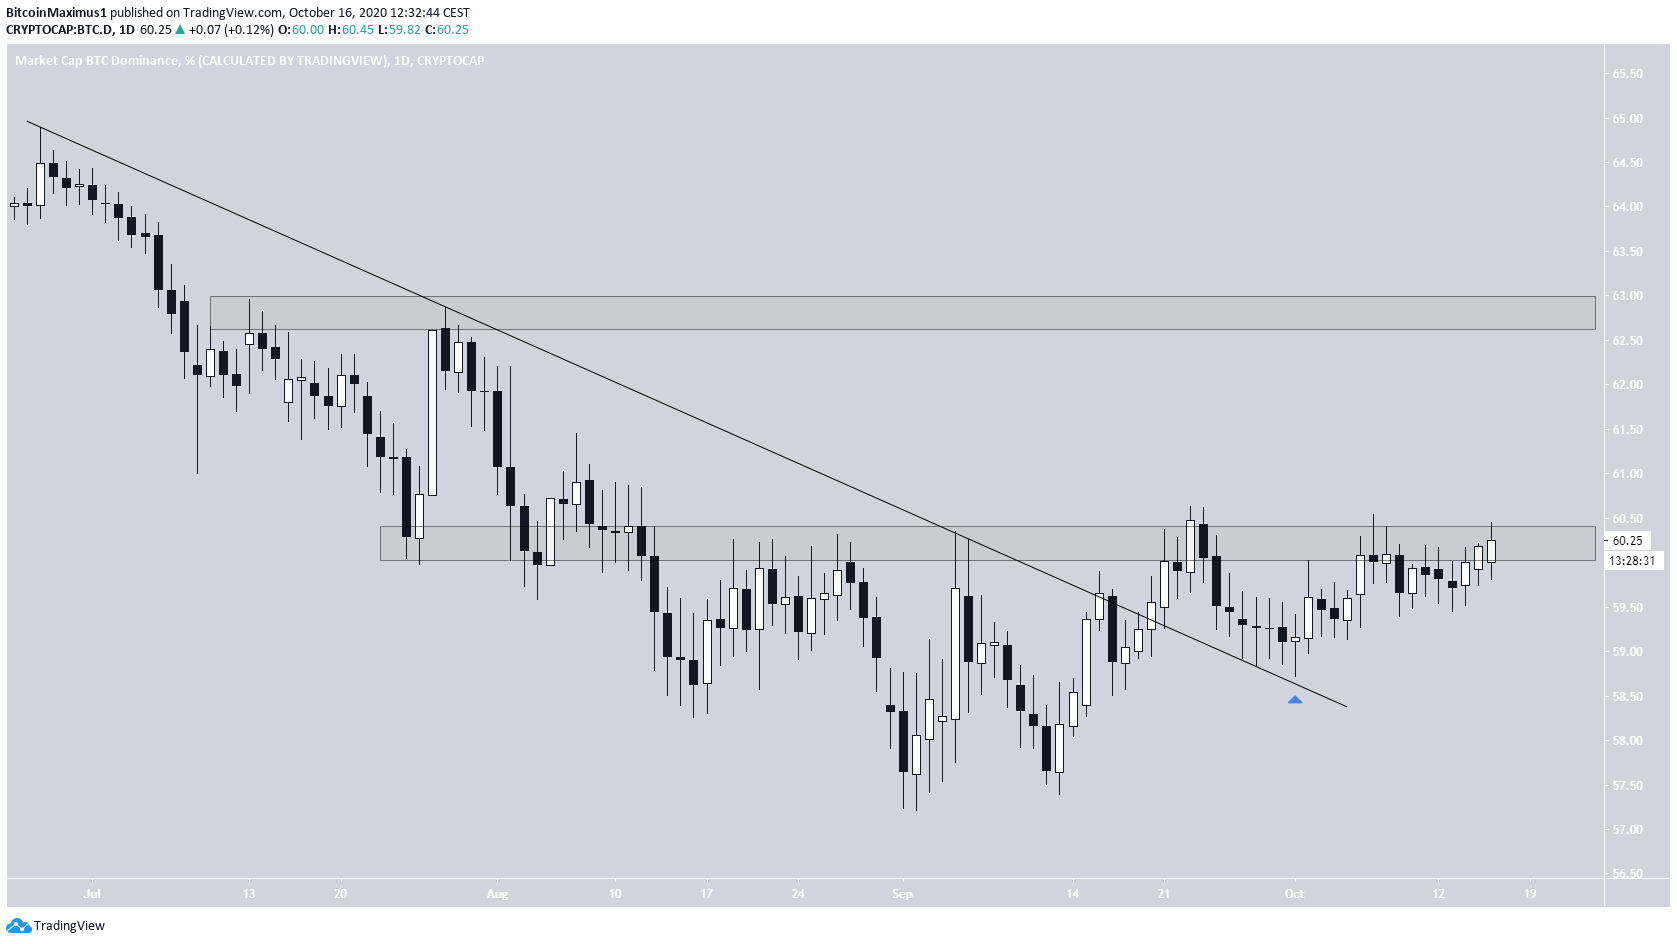

Head and Shoulders Pattern
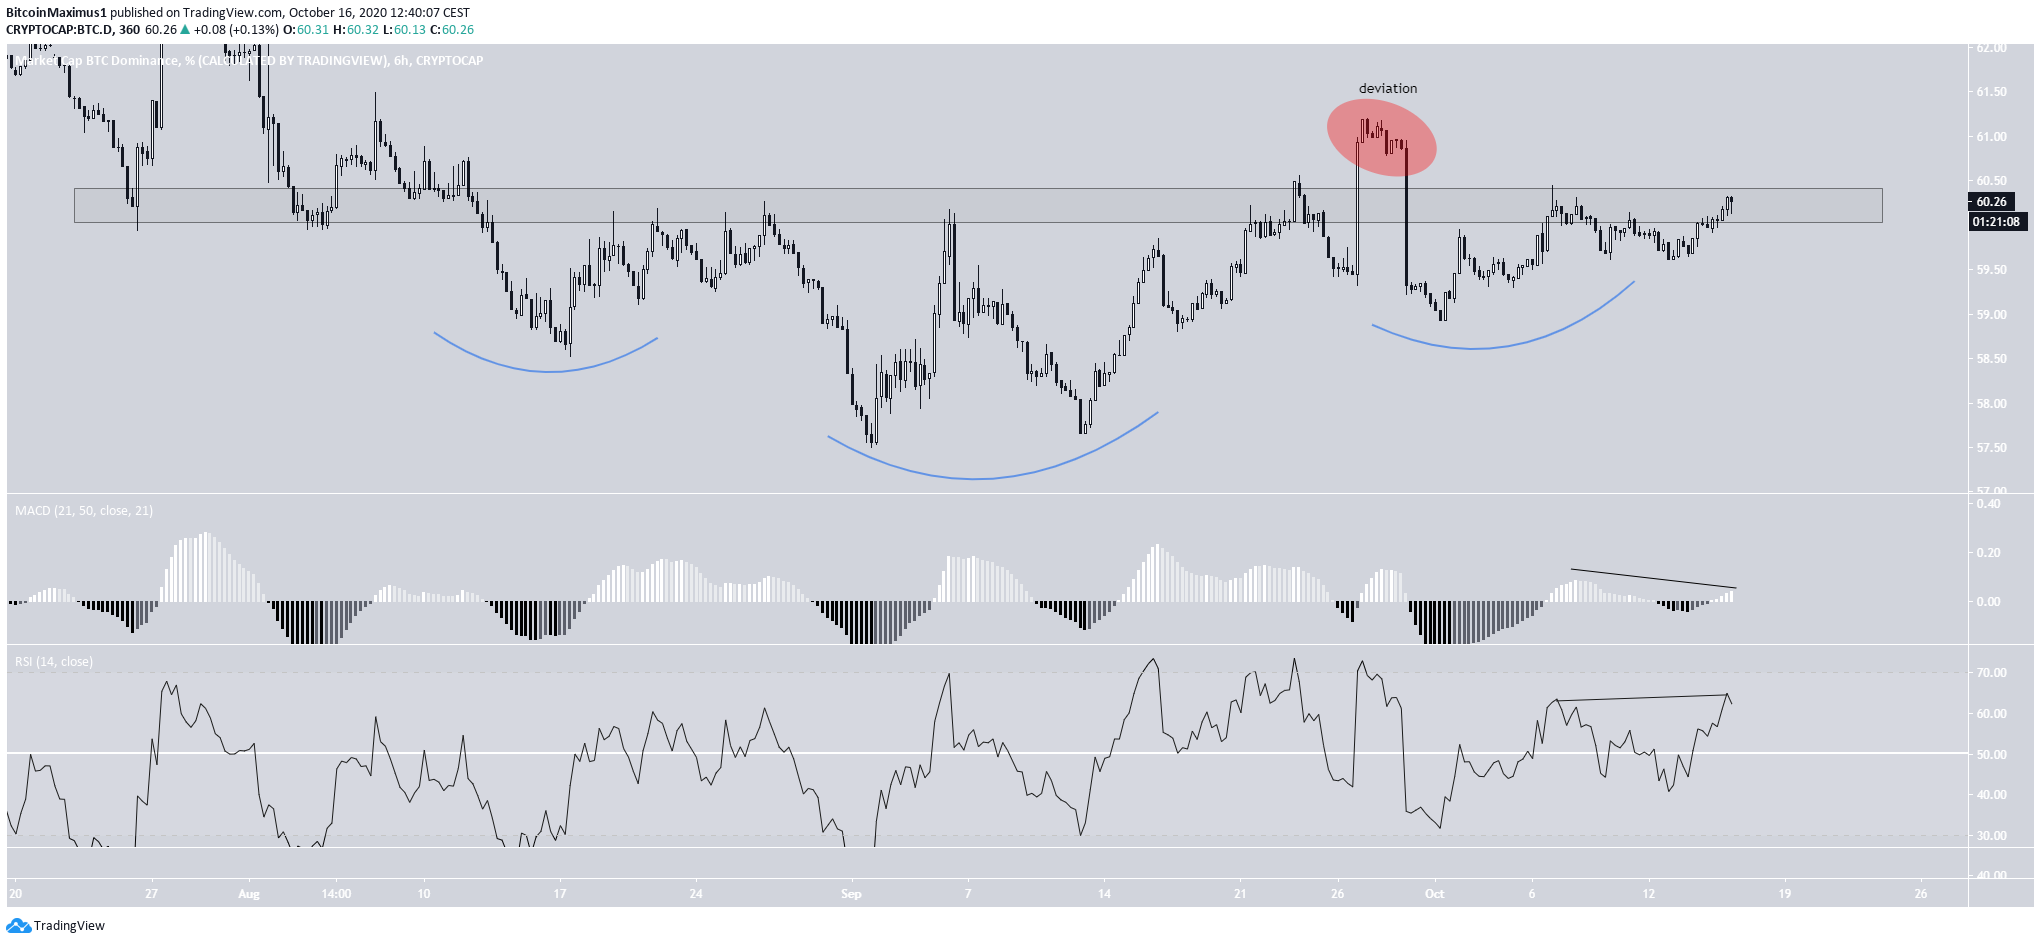
Cryptocurrency trader @JJJCycles outlined a Bitcoin dominance chart, showing an inverted head and shoulders pattern (H&S), from which a breakout is likely. The neckline of the pattern coincides with the previous 60.30% resistance area.
Top crypto projects in the US | April 2024
Trusted
Disclaimer
In line with the Trust Project guidelines, this price analysis article is for informational purposes only and should not be considered financial or investment advice. BeInCrypto is committed to accurate, unbiased reporting, but market conditions are subject to change without notice. Always conduct your own research and consult with a professional before making any financial decisions. Please note that our Terms and Conditions, Privacy Policy, and Disclaimers have been updated.

Valdrin Tahiri
Valdrin discovered cryptocurrencies while he was getting his MSc in Financial Markets from the Barcelona School of Economics. Shortly after graduating, he began writing for several different cryptocurrency related websites as a freelancer before eventually taking on the role of BeInCrypto's Senior Analyst.
(I do not have a discord and will not contact you first there. Beware of scammers)
READ FULL BIO
Sponsored
Sponsored