
The Bitcoin Dominance Rate (BTCD) has reached a crucial resistance area, and a breakout above/below it will likely determine the direction of the future trend.
Long-Term Levels
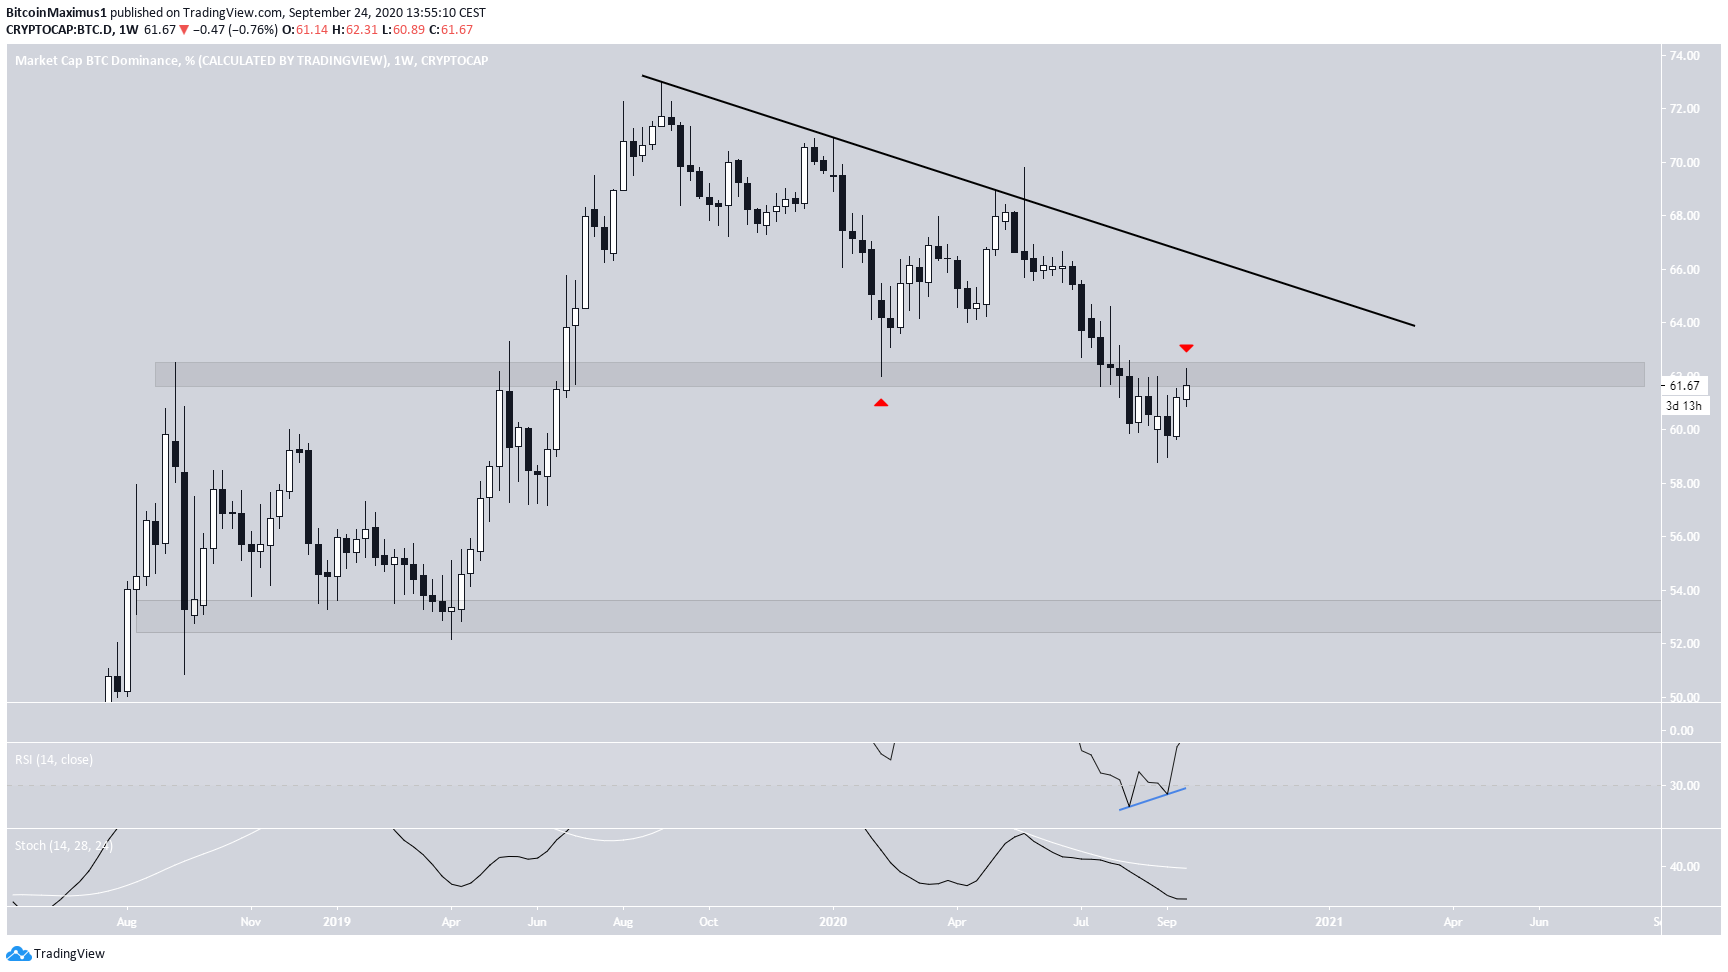
The BTCD has been declining since September 2019, when it reached a high of 73.02%. The decrease has followed a descending resistance line.
The 62% area previously acted as support in February 2020, initiating an upward move that reached the descending resistance line. However, the rate fell below this level in the beginning of August and is currently in the process of validating it as resistance or possibly reclaiming it.
Technical indicators provide an ambiguous outlook. While the weekly RSI is deep into oversold territory and has generated bullish divergence, the Stochastic oscillator has just rejected a bearish cross.
If the price fails to reclaim the 62% area, it could decrease all the way to 52%.
Possible Rejection
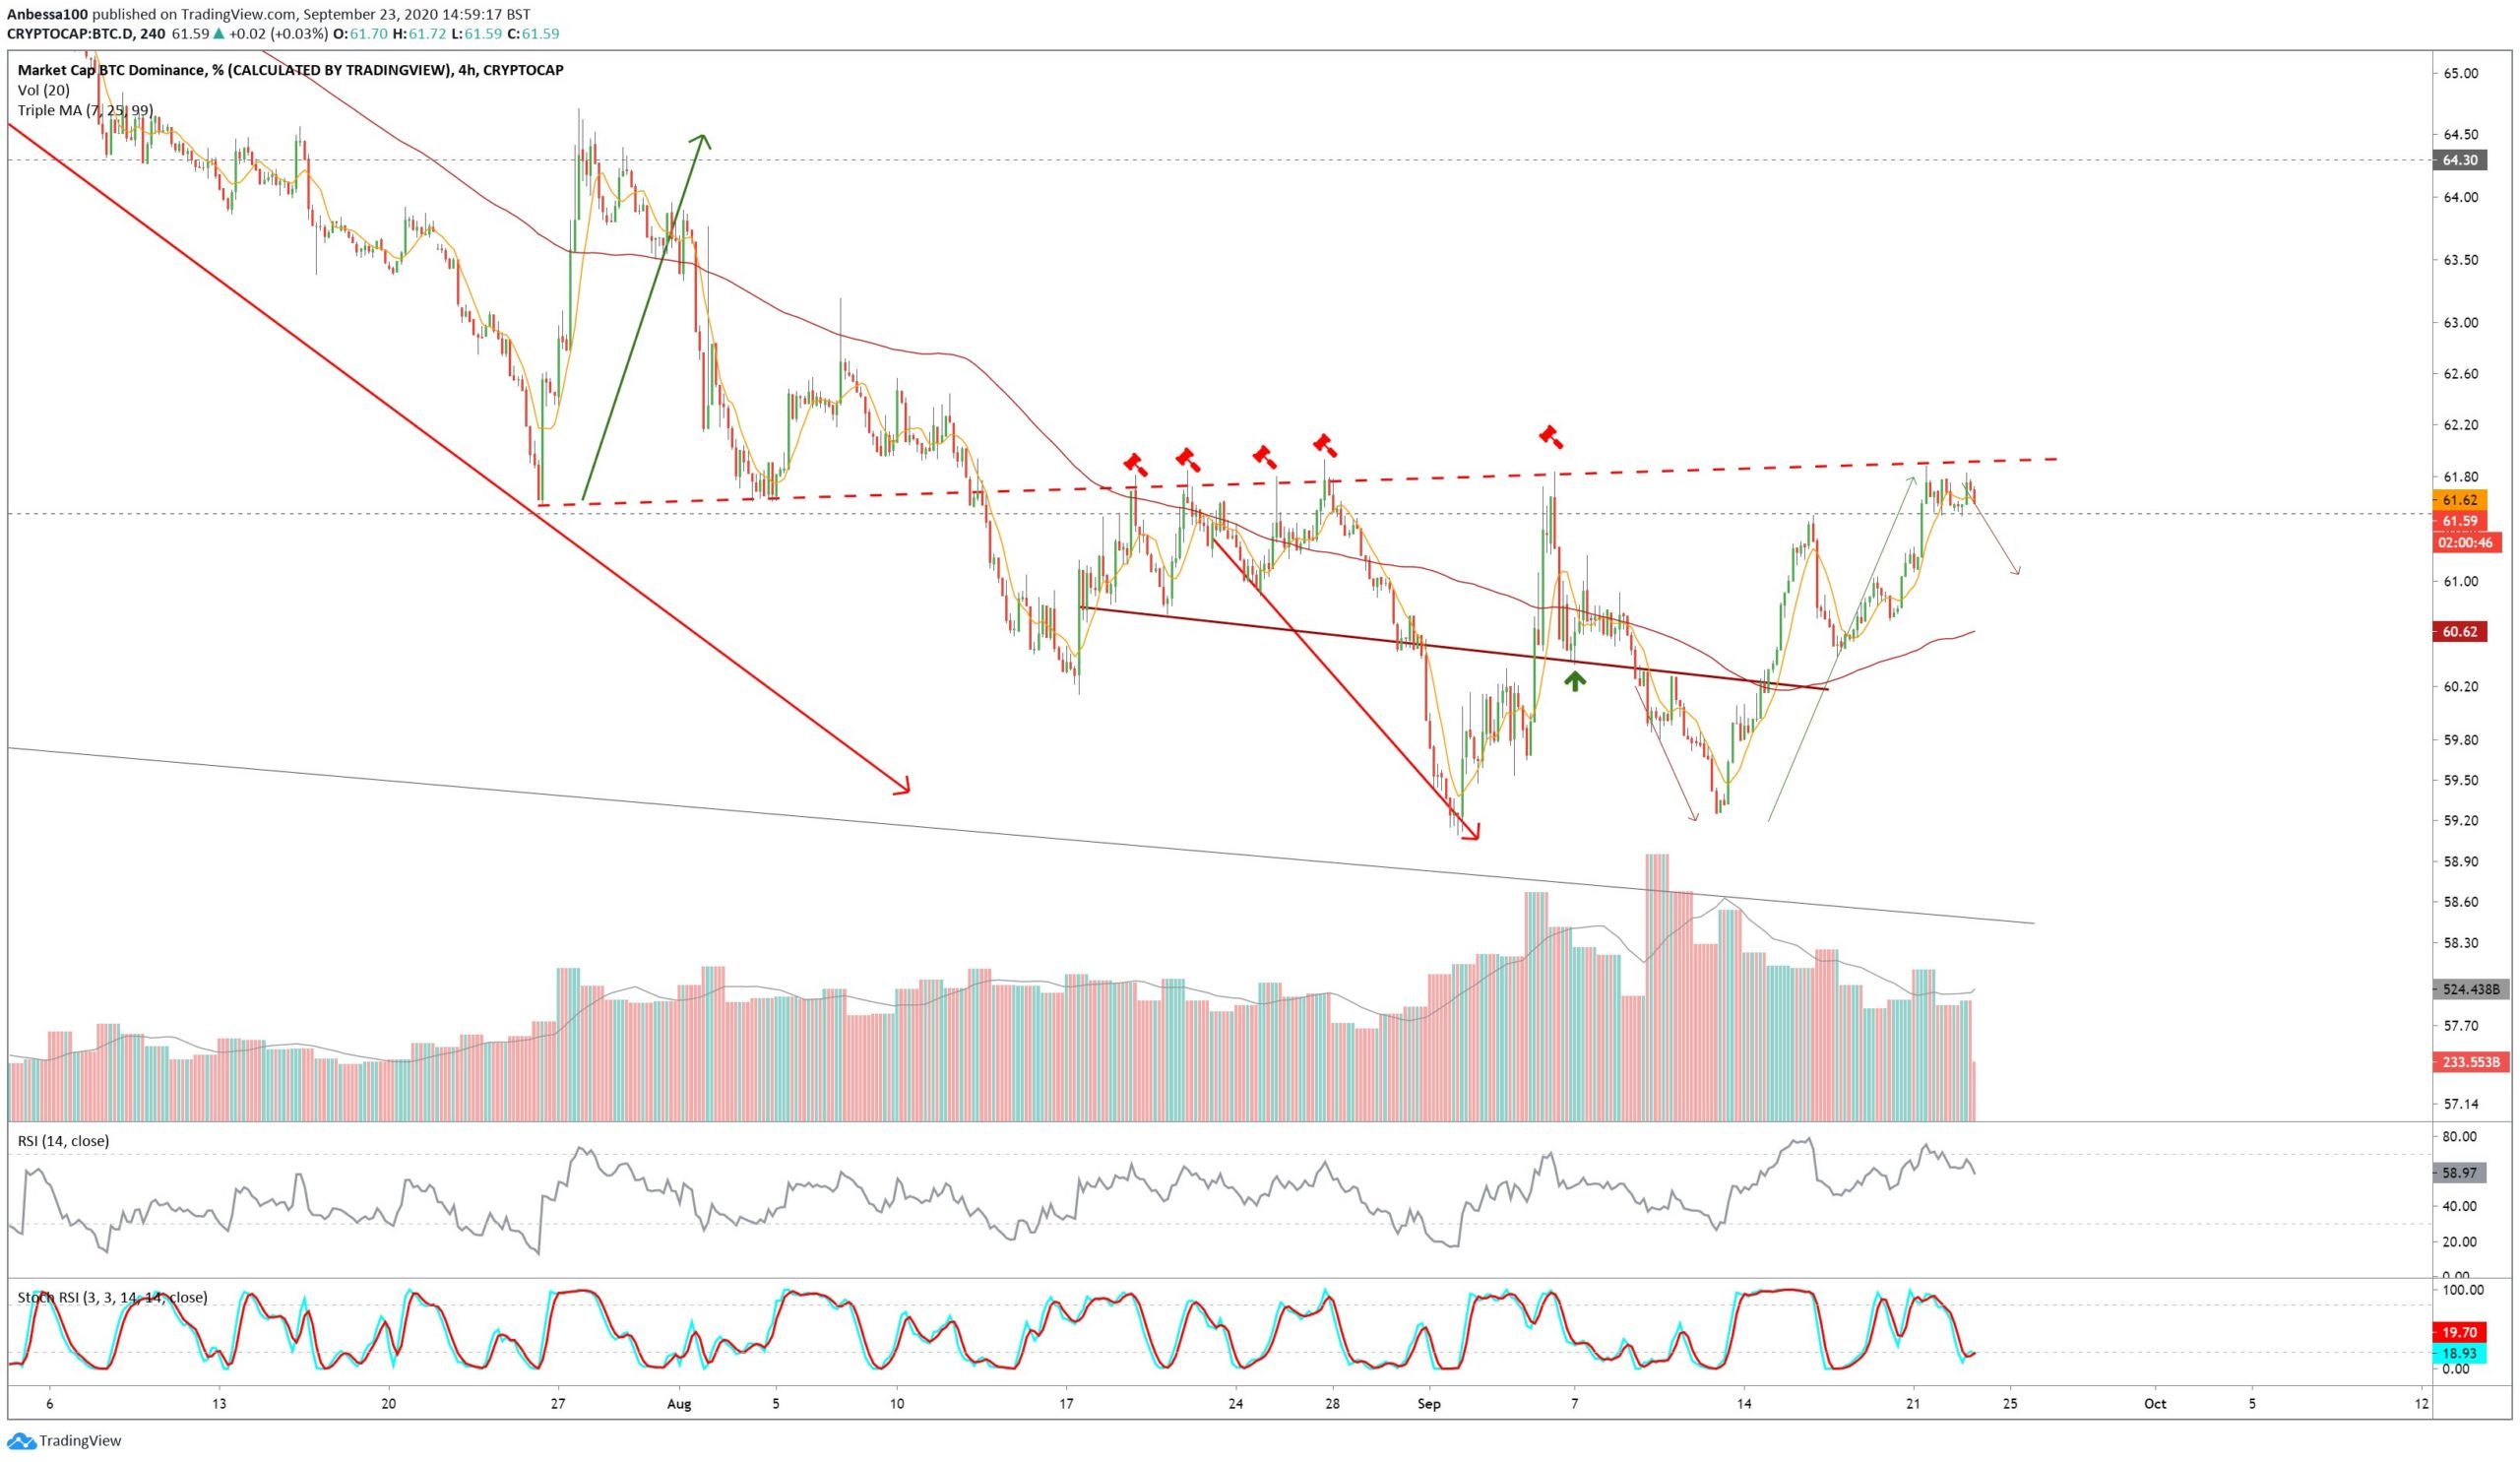
Cryptocurrency trader @anbessa100 outlined a Bitcoin Dominance Chart, stating that she expects a decrease, which would lead to an altcoin rally.
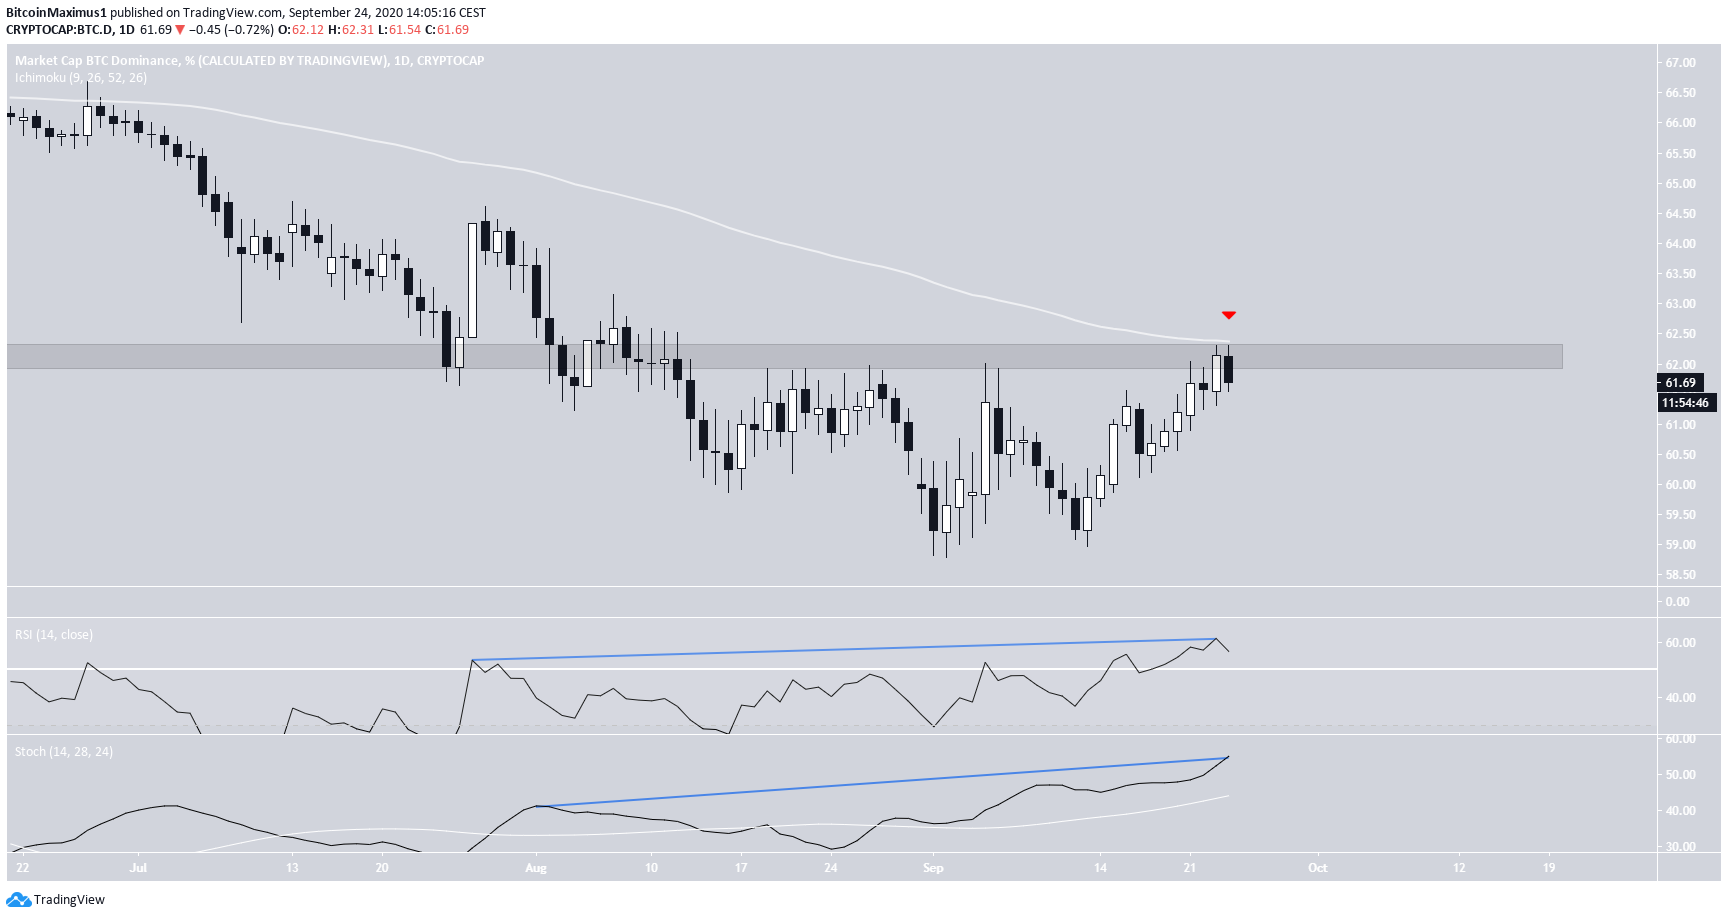
The daily chart shows the considerable resistance right above the current price. The area is also strengthened by the 100-day moving average (MA) above which the price has not traded since June.
Even in the daily time-frame, technical indicators are ambiguous. While the RSI has moved above 50 and the Stochastic Oscillator has made a bullish cross, both have generated considerable hidden bearish divergence.
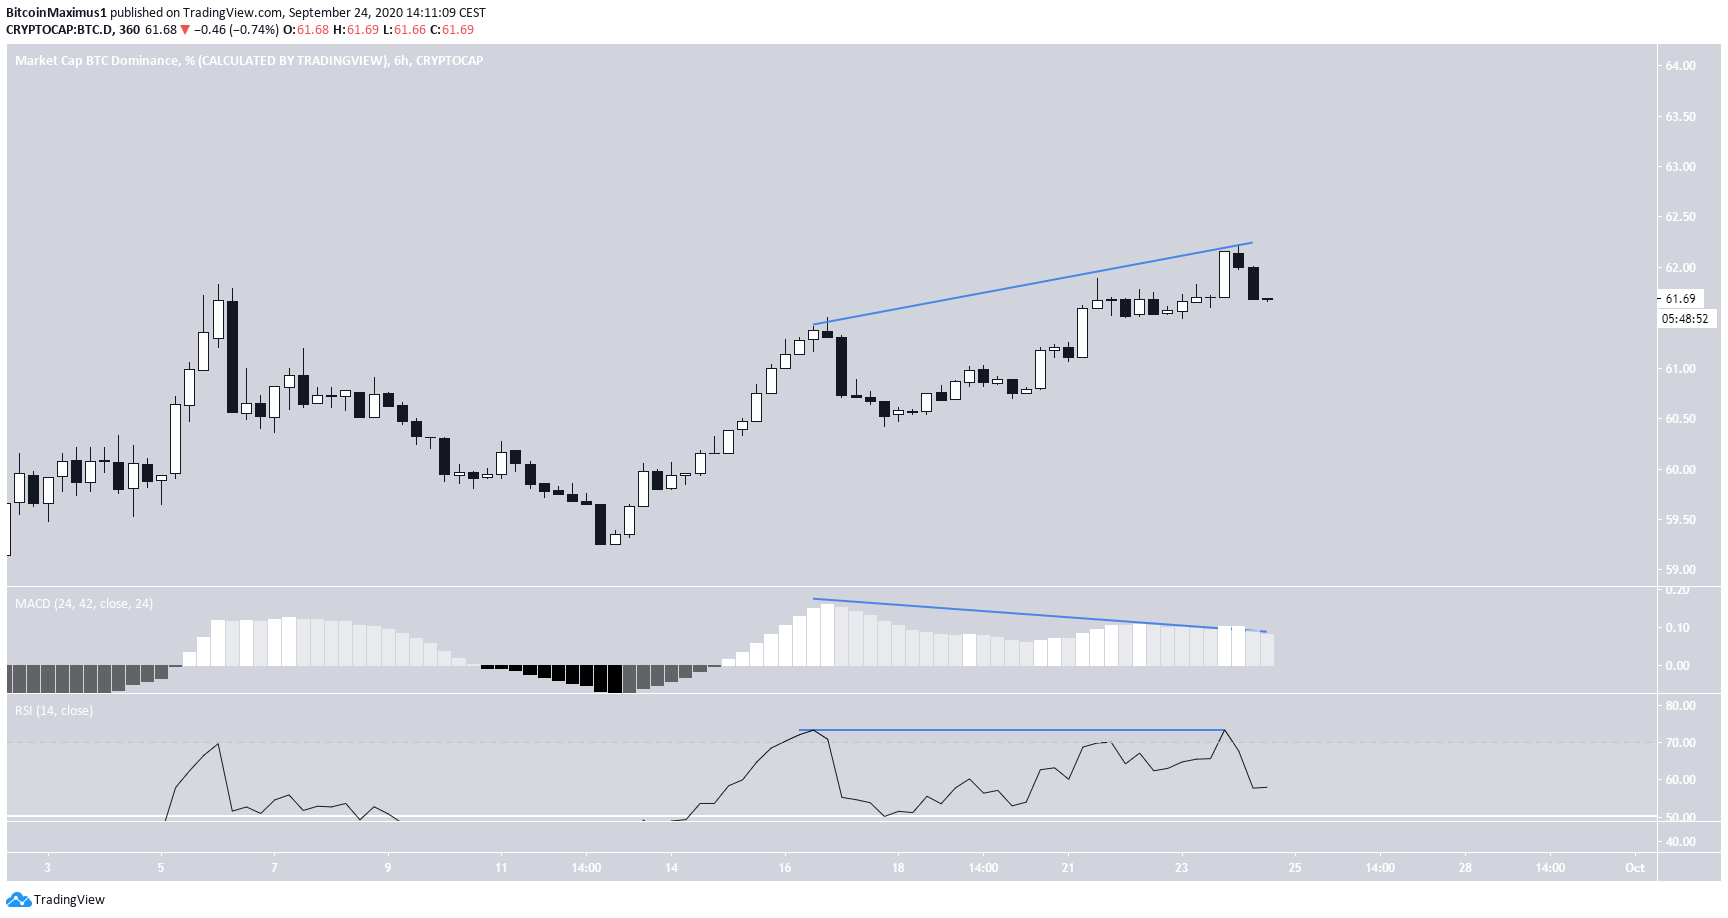
The shorter-term six-hour chart is clearer, since it shows a pronounced bearish divergence in both the RSI and the MACD.
Therefore, while the direction of the longer-term trend is unclear, a short-term decrease in BTCD is expected.
Wave Count
Beginning in January 2018, BTCD has likely completed a bullish impulse (in white below), and is in the process of completing a complex W-X-Y correction.
The correction would be expected to end between the 0.5-0.618 Fib levels, between 49.5-54%, fitting with the support area outlined in the first section.
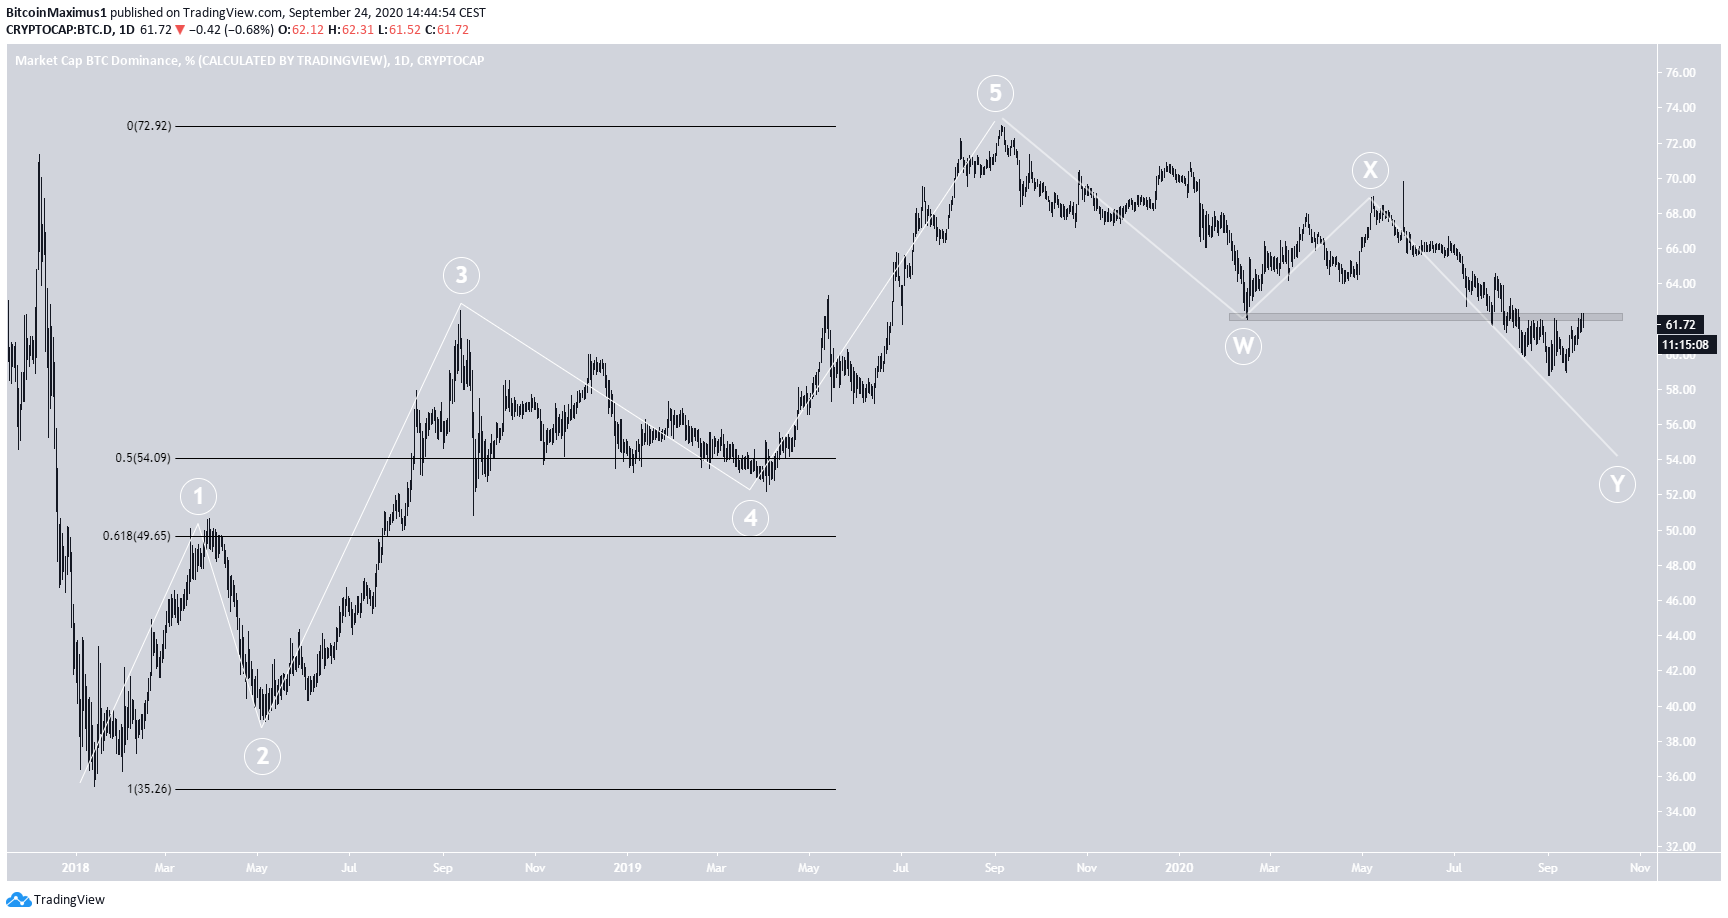
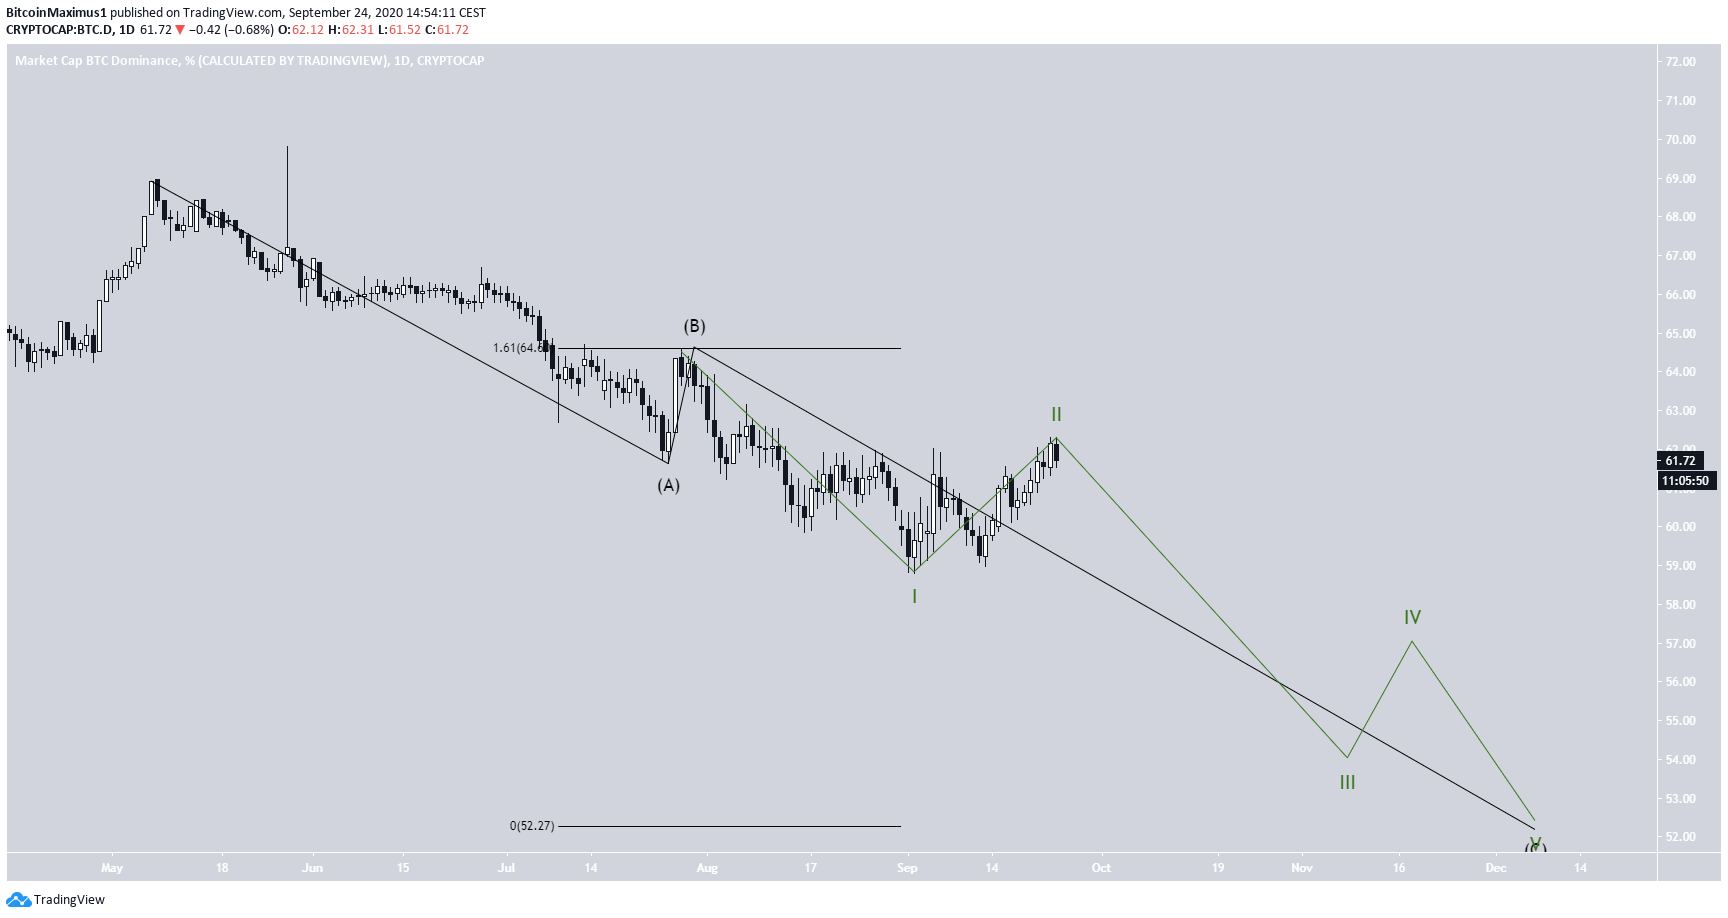
The final wave has taken the A-B-C corrective form (black) and the rate seems to be in the C wave, which is created by a bearish impulse (green).
If the count is correct, the price has just reached the top of sub-wave 2, and will soon begin to decrease. The wave count would be invalidated with an increase above 64.5%.
A likely target for the bottom of the correction would be at 52.5%, fitting both with the support area in the first section and the 0.5-0.618 Fib levels of the entire upward move. The target would be reached if waves A:C had a 1:1.61 ratio, which is common in such corrections.
To conclude, BTCD is expected to decrease in the short-term. Unless the rate reclaims the 62% area, it could decrease all the way to 52%.
