
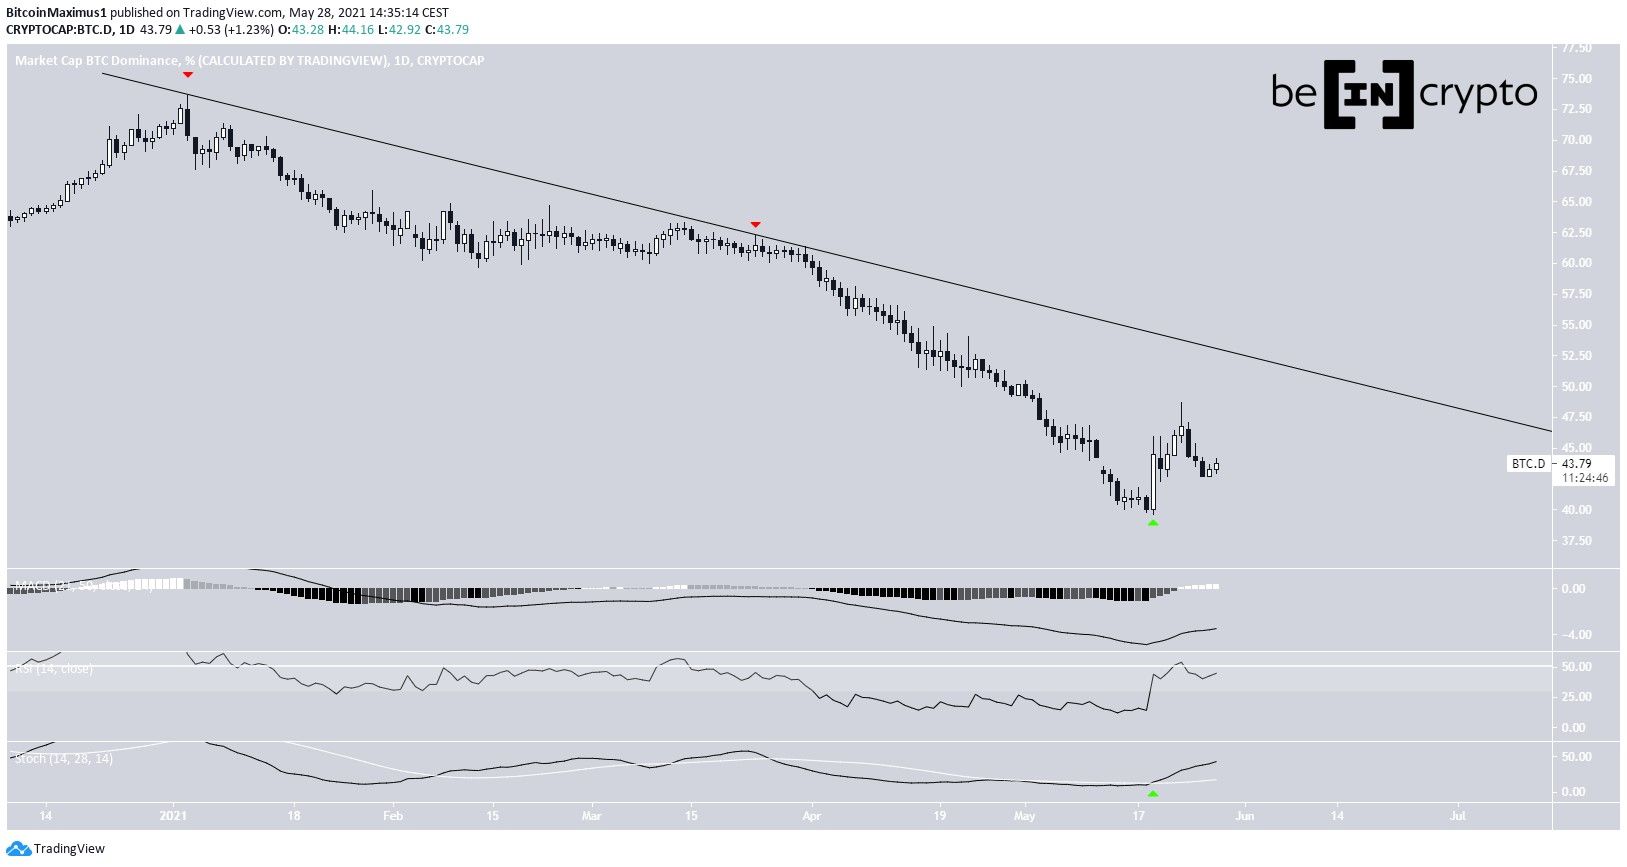
The Bitcoin Dominance Rate (BTCD) has been decreasing alongside a descending resistance line since Jan. 3, 2021.
While it bounced on May 19, it has been decreasing since reaching a high of 48.67%, on May 23.
BTCD resistance line
BTCD has been following a descending resistance line since Jan. 3, 2021. The line caused a rejection on March 24, leading to an accelerated downward movement.
On May 19, BTCD settled on a low of 39.66% and bounced considerably, leading to a high of 48.67%, four days later. However, it failed to reach the resistance line and has been moving downward since.
Technical indicators are showing bullish signs. The Stochastic oscillator made a bullish cross (green icon) and the MACD histogram is increasing. However, the signal line is still below 0 and the RSI is below 50.
Therefore, the bullish reversal is not confirmed yet.
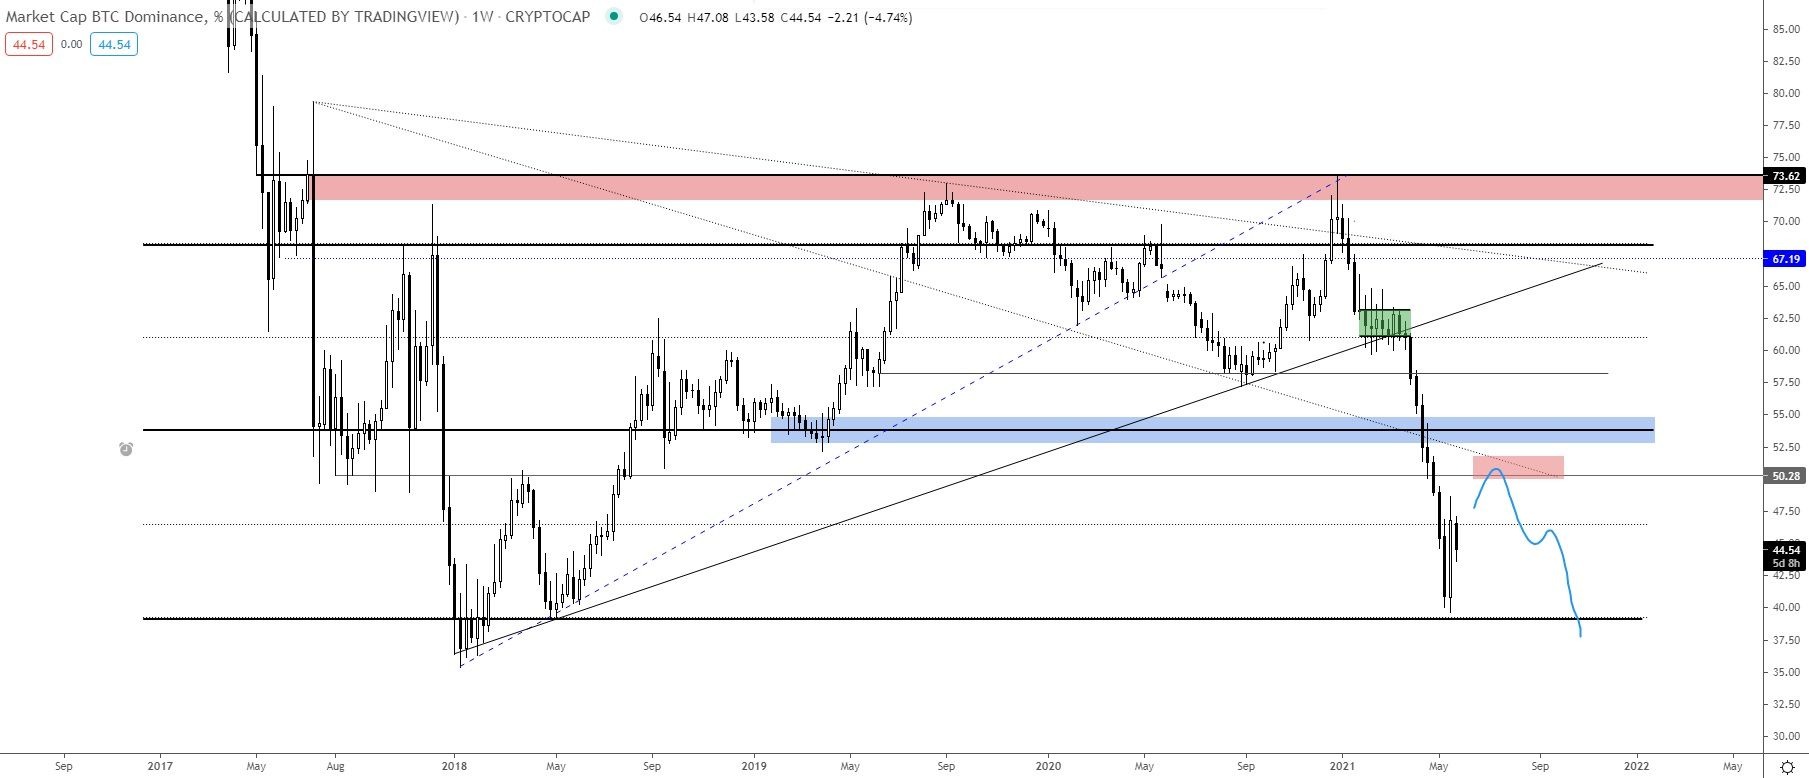
Cryptocurrency trader @TheEuroSniper outlined a BTCD chart, stating that he expects a bounce towards the 50% area, before another fall towards a new all-time low. As seen above, the bounce has already transpired and BTCD has been decreasing since May 23.
Future BTCD movement
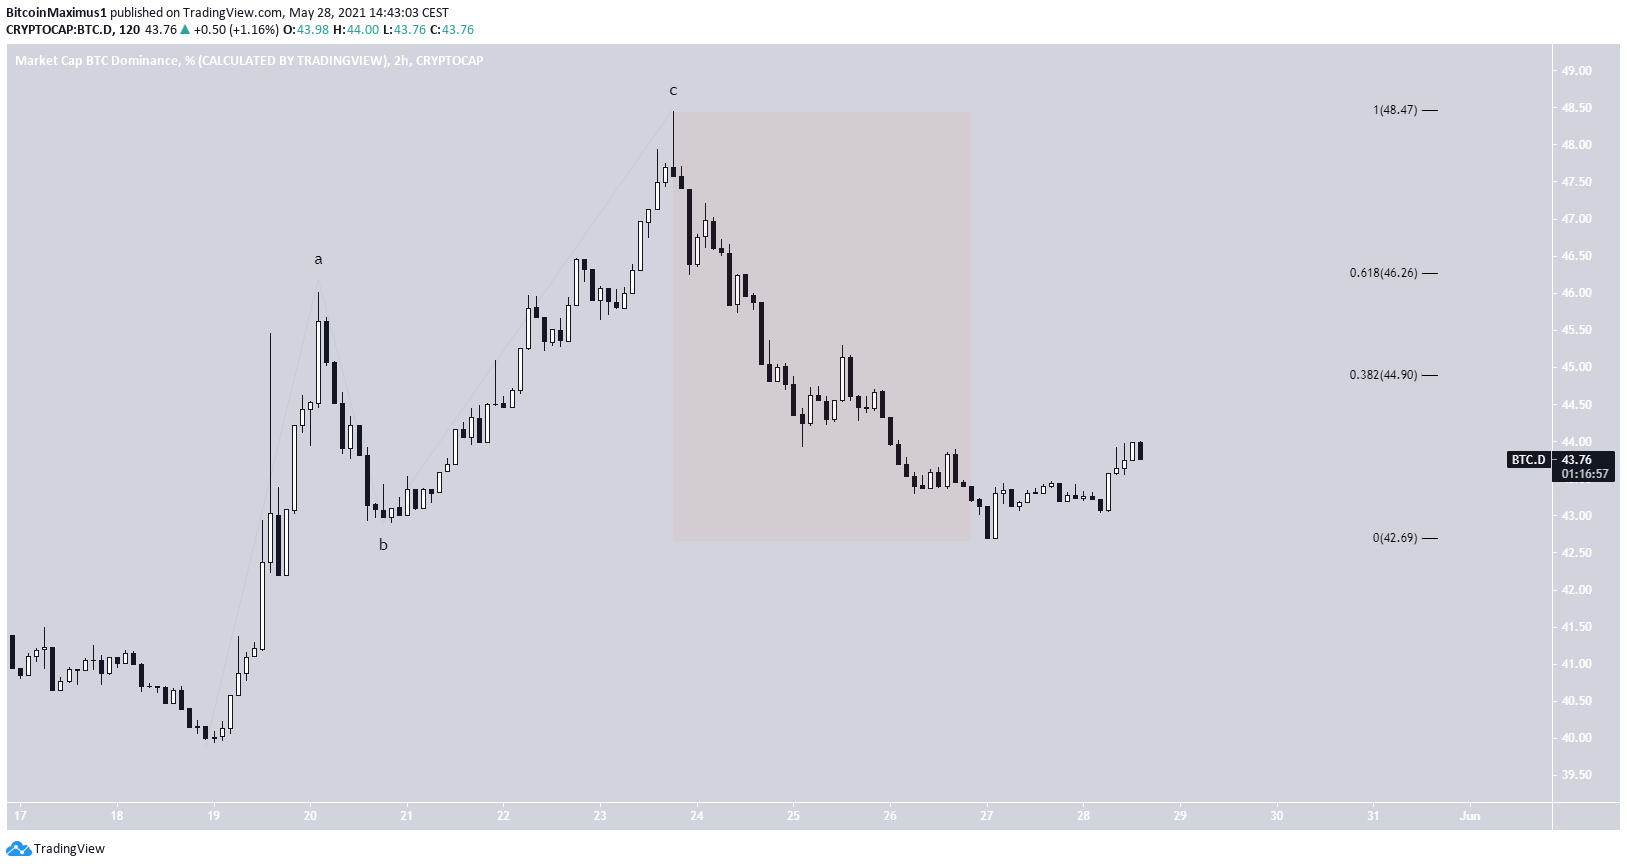
The bounce after the May 19 lows looks like a three wave corrective structure. Furthermore, the ensuing downward movement looks impulsive (highlighted in red).
Therefore, it is possible that after a push to resistance at 44.9% or 46.26%, BTCD gets rejected and continues falling towards a new all-time low.
This would also fit with the longer-term count.
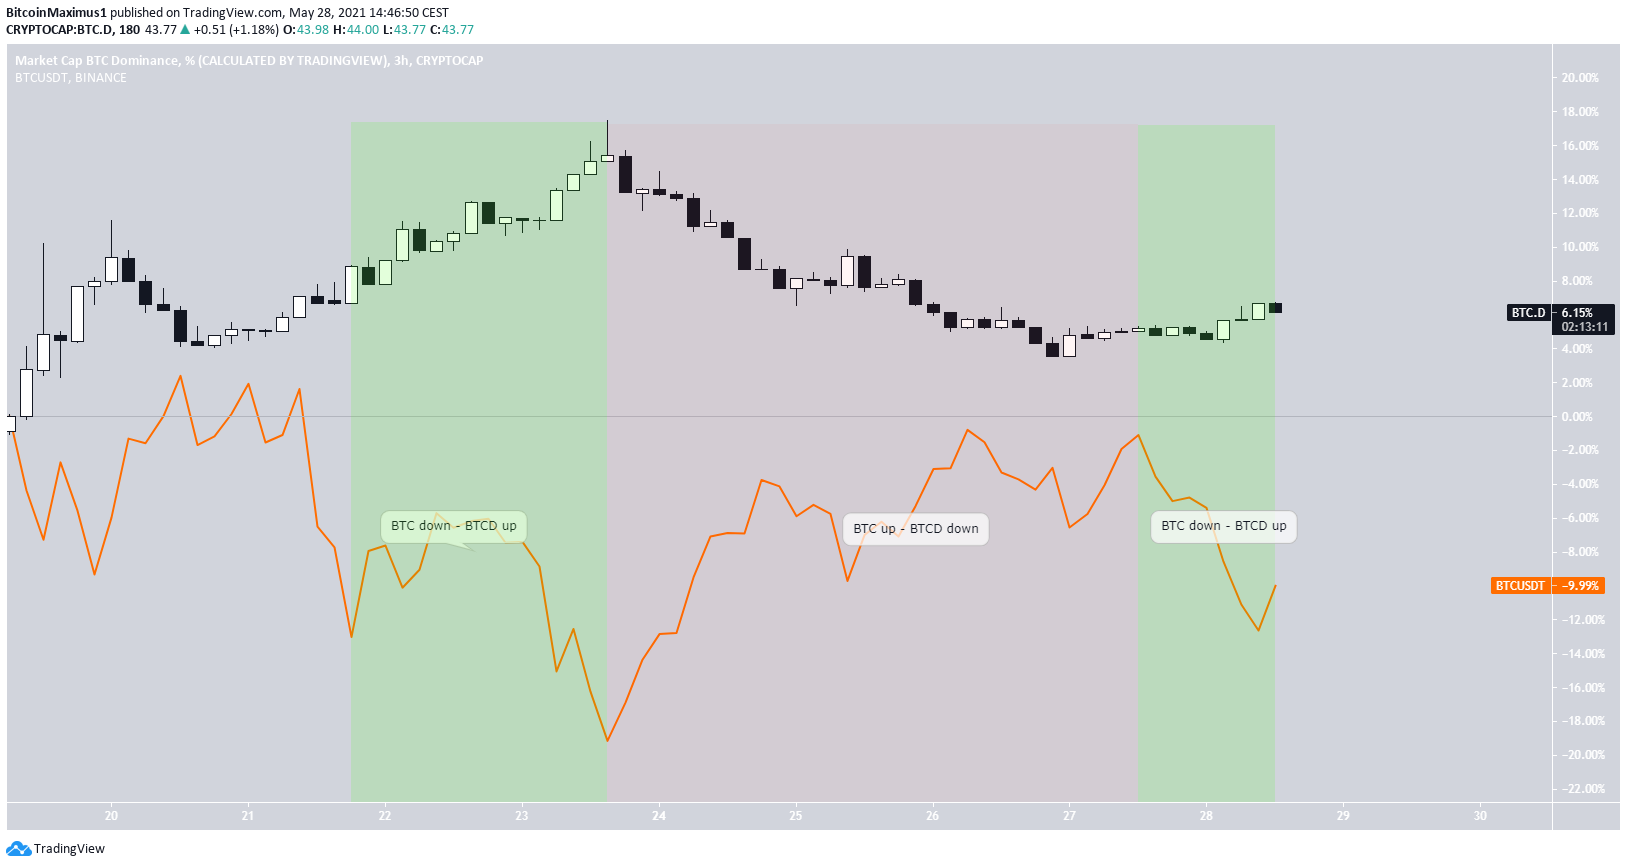
The relationship between bitcoin (BTC) and BTCD has been negative since May 19. Therefore, an increase in the BTC price causes a decrease in BTCD (highlighted in red) and vice-versa (highlighted in green).
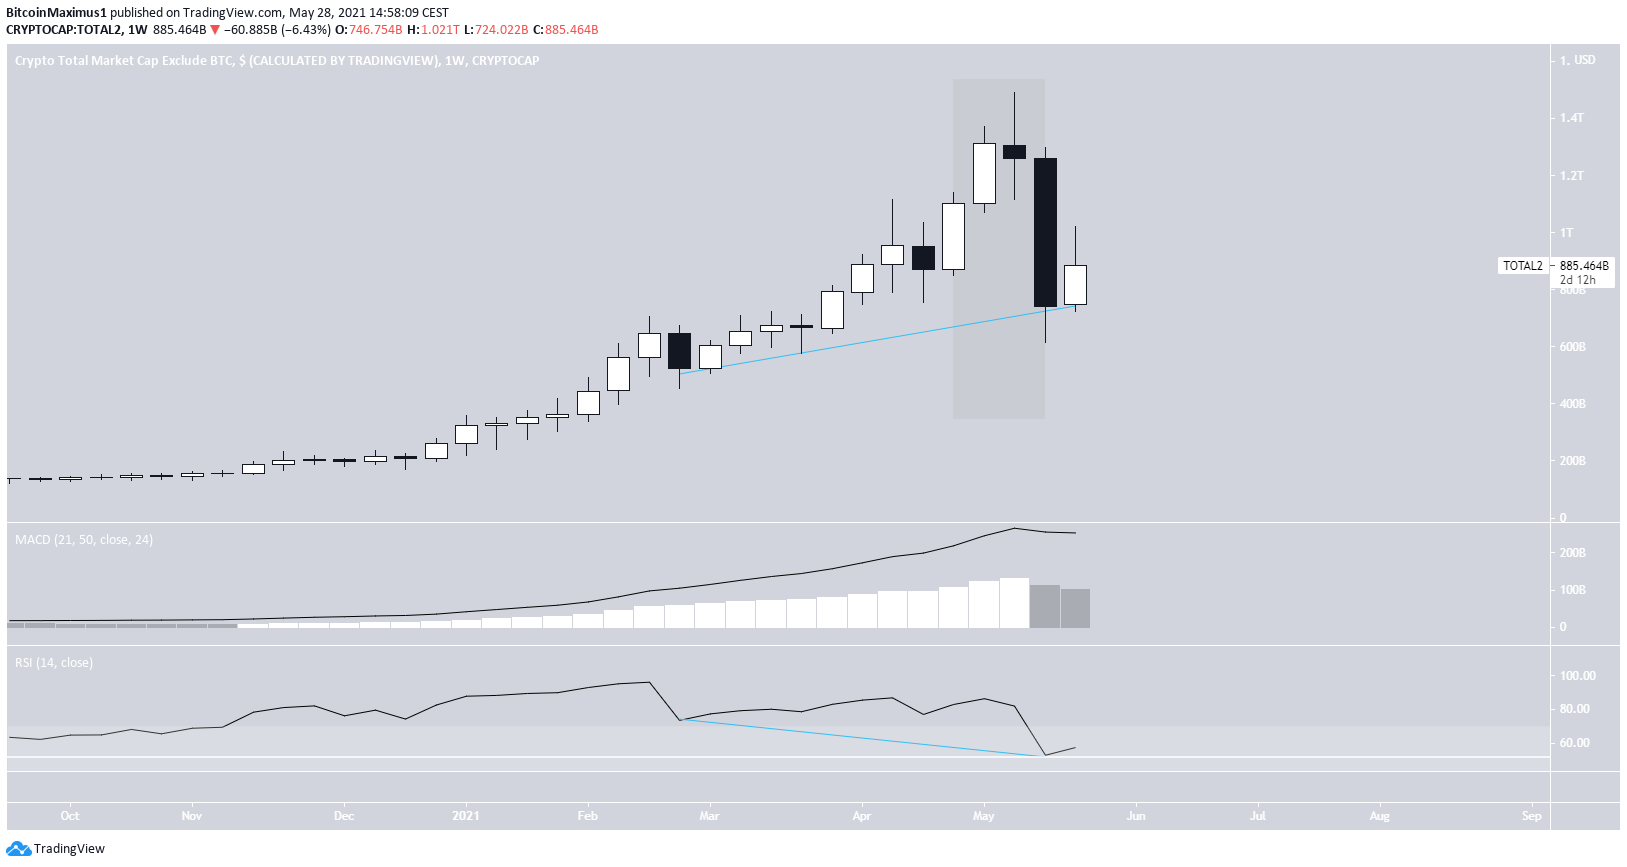
Altcoin market cap
The altcoin market cap has fallen significantly, over the past two weeks. In addition, it created an evening star pattern, which is considered a bearish reversal pattern.
Technical indicators are mixed. The RSI has generated hidden bullish divergence and bounced above the 50 line. Despite this, the MACD has created a lower momentum bar.
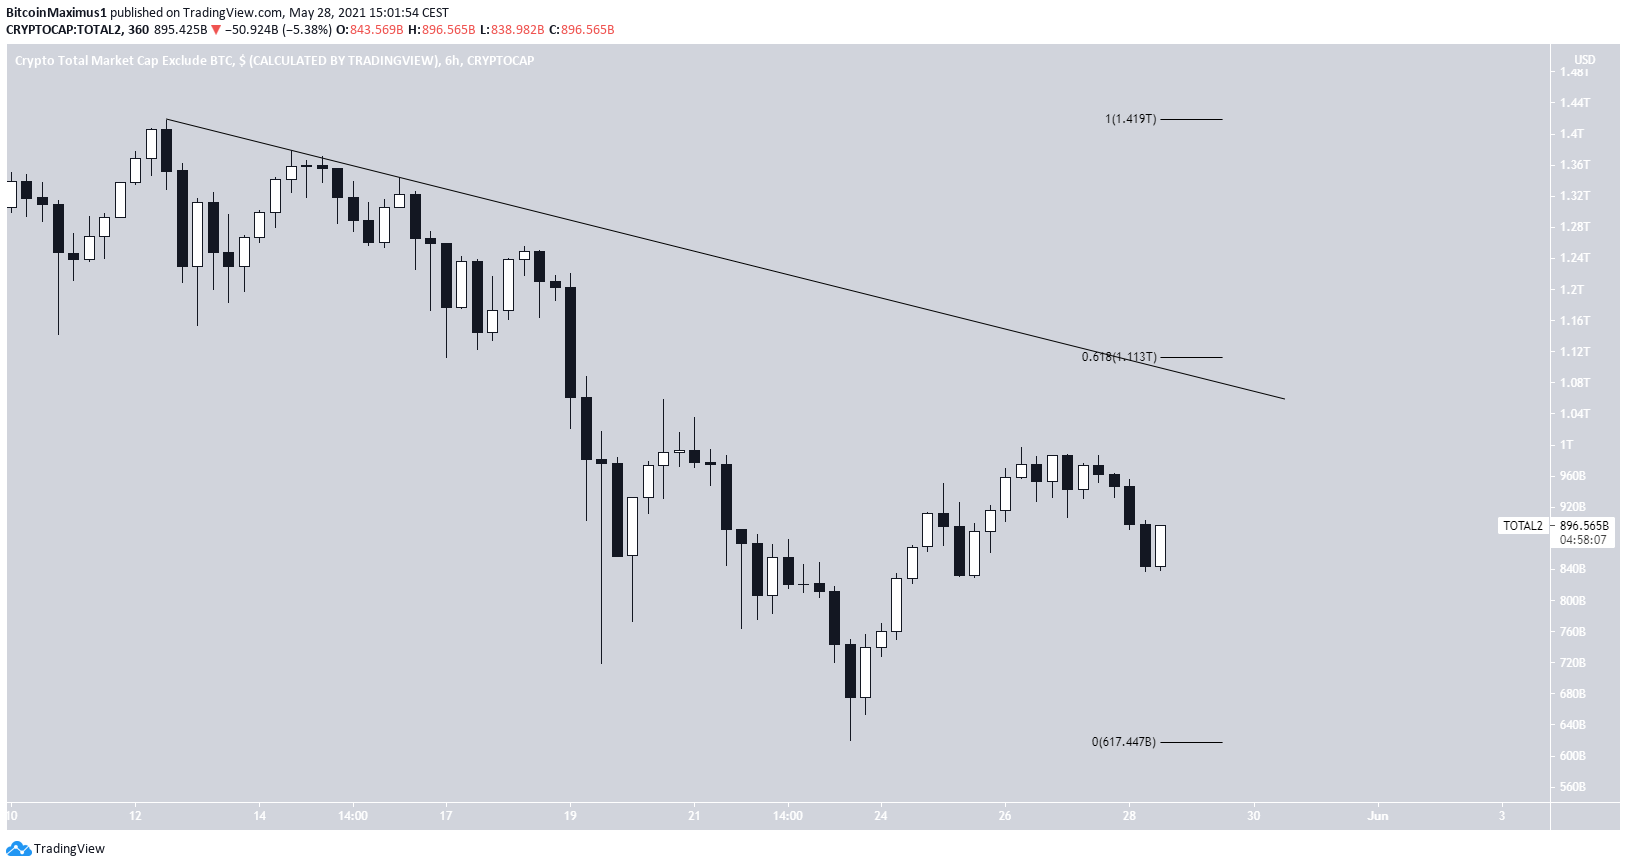
The shorter-term six-hour chart shows a descending resistance line in place since the all-time high on May 12. The line coincides with the 0.618 Fib retracement resistance level.
Whether a breakout or a rejection occurs will determine the direction of the long-term trend.
For BeInCrypto’s latest bitcoin (BTC) analysis, click here.
