
The Bitcoin dominance rate (BTCD) has been following a descending resistance line since July 30 and just broke down below the 41.30% horizontal area.
Technical indicators and the price action indicate that a new all-time low is likely to eventually be reached.
Potential double bottom
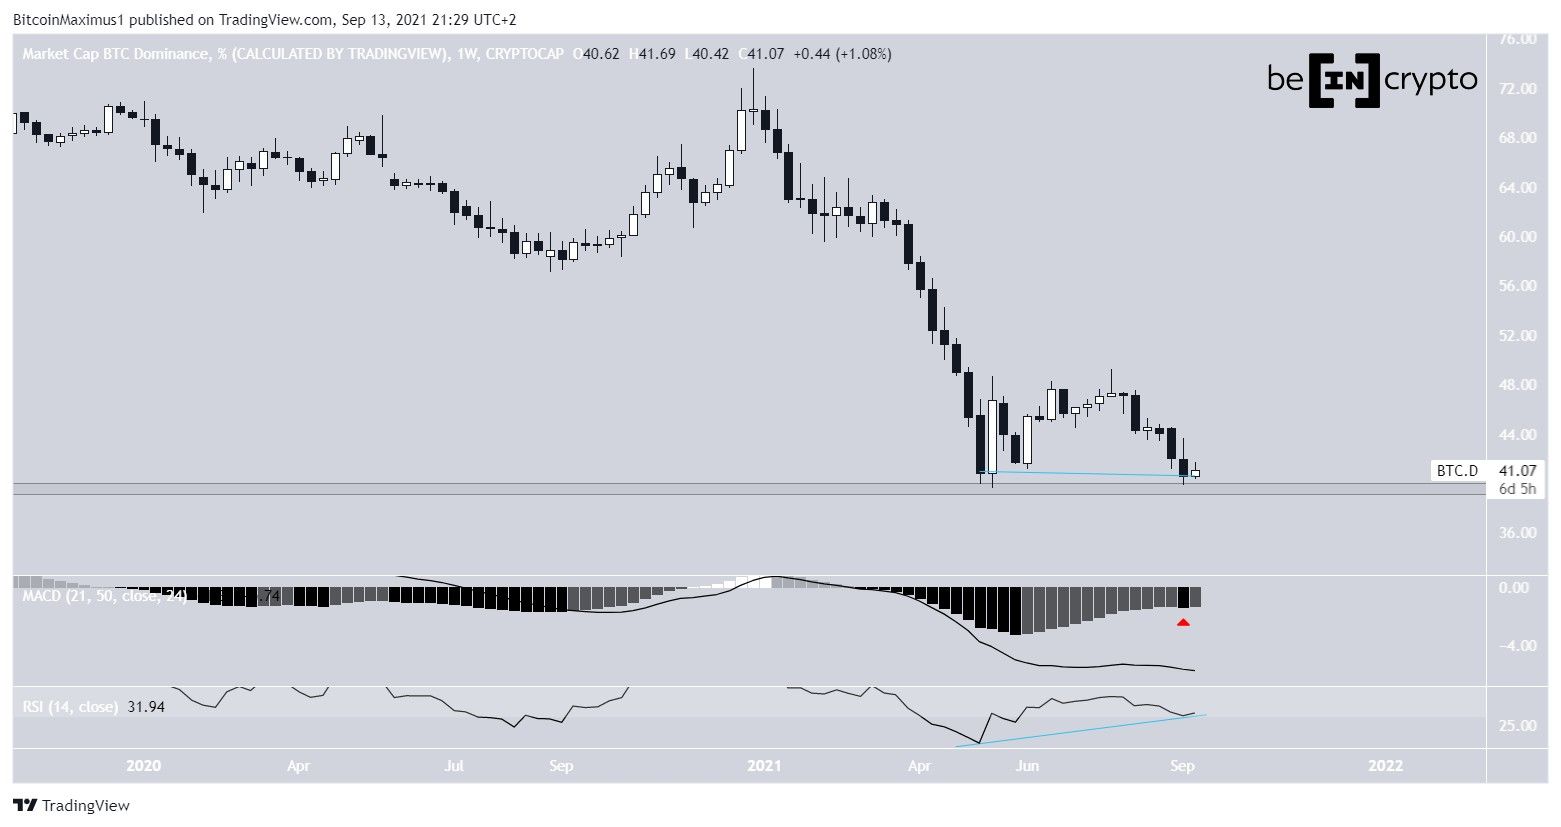
BTCD has been falling since January, when it had just reached a high of 73.65%. The decrease continued until May 19, culminating with a low of 39.66%.
While the rate has bounce since then, BTCD has been trading close to 40% over the last two weeks, potentially creating a double bottom pattern.
The double bottom is considered a bullish pattern, and there are some potential bullish reversal signs in place, such as the bullish divergence in the RSI. However, neither the divergence nor the pattern are confirmed, since a lower low could invalidate them. In addition to this, the MACD is decreasing and created a lower momentum bar last week (red icon). Also, the RSI is at risk of falling below 30.
Therefore, there aren’t sufficient bullish signs that would serve as confirmation for a bullish trend reversal.
New all-time low?
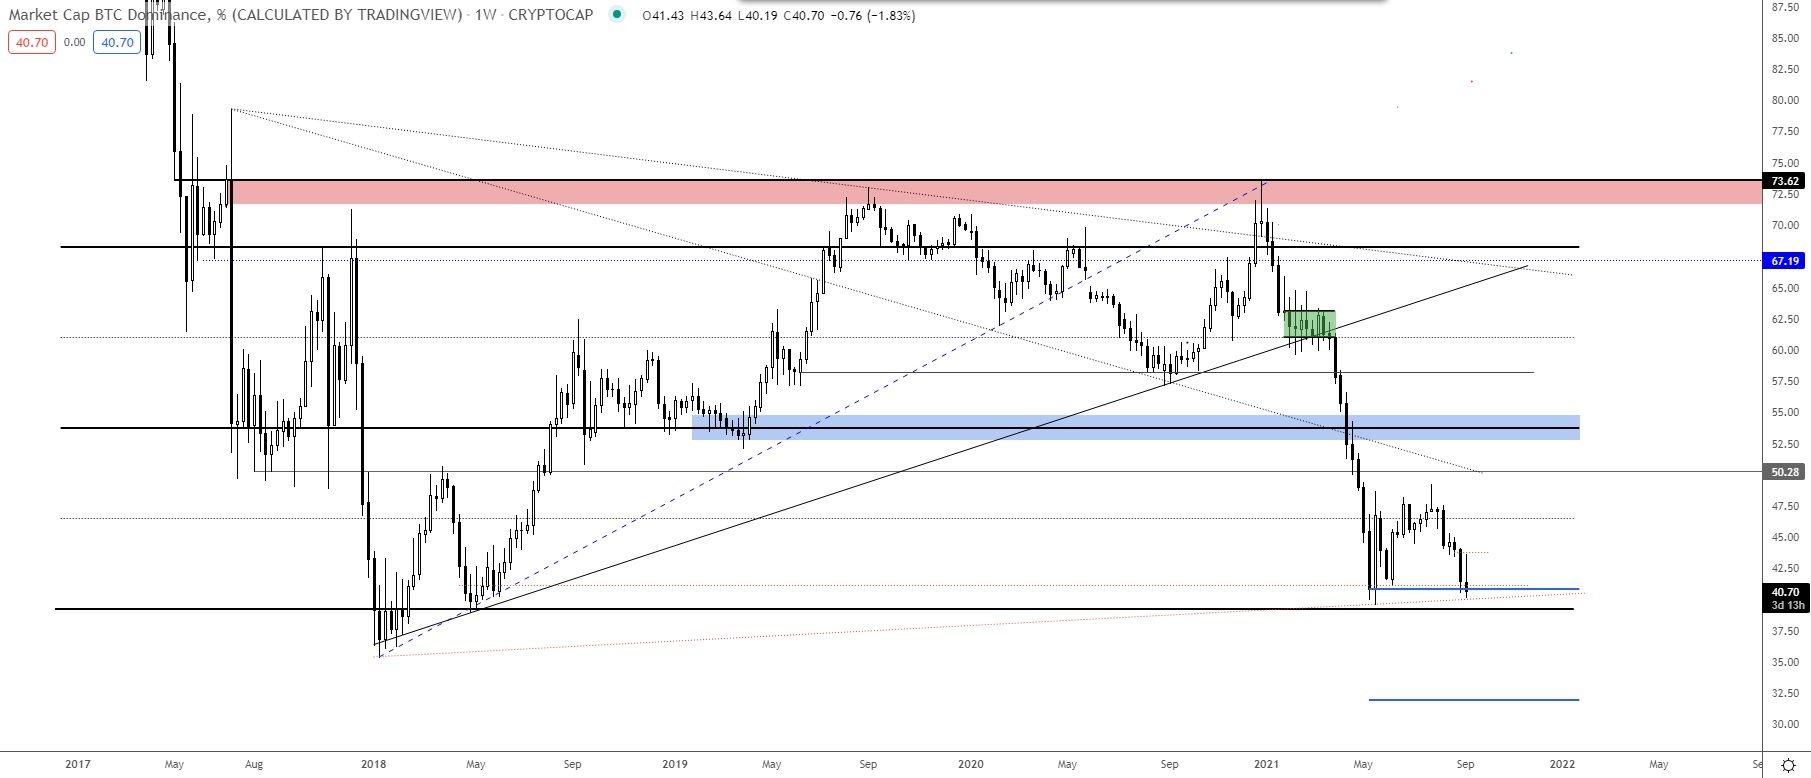
Cryptocurrency trader @TheEuroSniper outlined a BTCD chart, stating that a close below the 40% area can lead to a downward movement towards 32%.
Wave Count
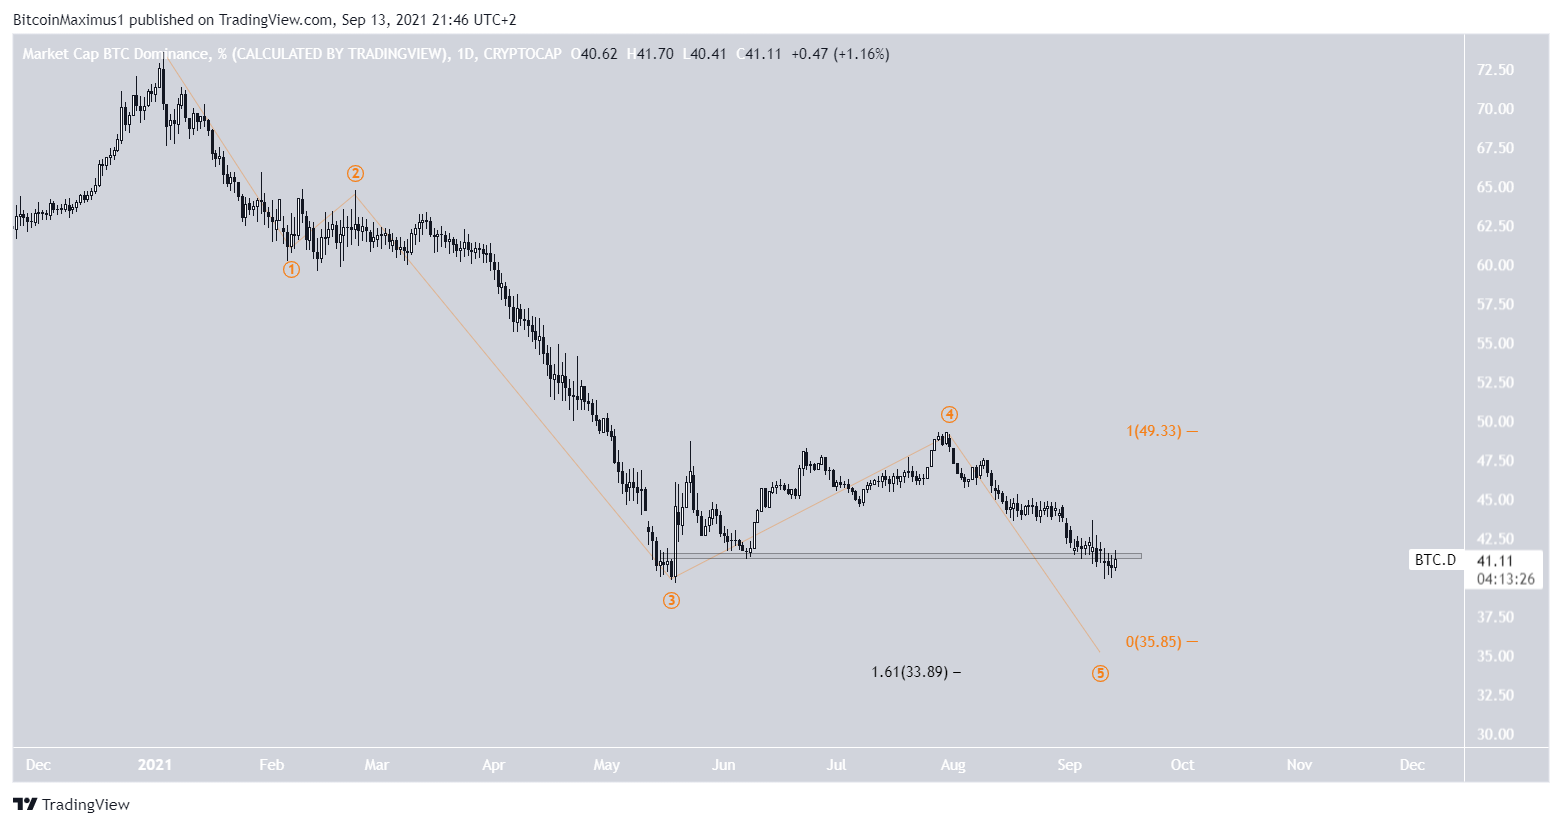
The daily chart also provides a bearish picture. BTCD has been decreasing alongside a descending resistance line since July 30.
Furthermore, it fell below the 41.50% support area on Sept 8 and is now in the process of validating it as resistance.
Technical indicators are also bearish. While the RSI has potentially generated some bullish divergence, it is still below 30. Furthermore, the MACD is falling.
A decrease below the May 17 low of 39.66% would likely send BTCD towards the 2018 lows at 36%.

The most likely wave count suggests that BTCD is in wave five of a bearish impulse (orange).
A potential target for the bottom of the movement is between 35.85% and 33.89%. It is found using the length of wave one (orange) and the 1.61 external Fib retracement on wave four (black).
The latter would constitute a new all-time low.
For BeInCrypto’s latest Bitcoin (BTC) analysis, click here.
