
The Bitcoin Dominance Rate (BTCD) has reached an important resistance level that will likely cause a rejection. Despite the rally that is ongoing since September, it’s not yet clear if the long-term trend is bullish.
Long-Term Resistance
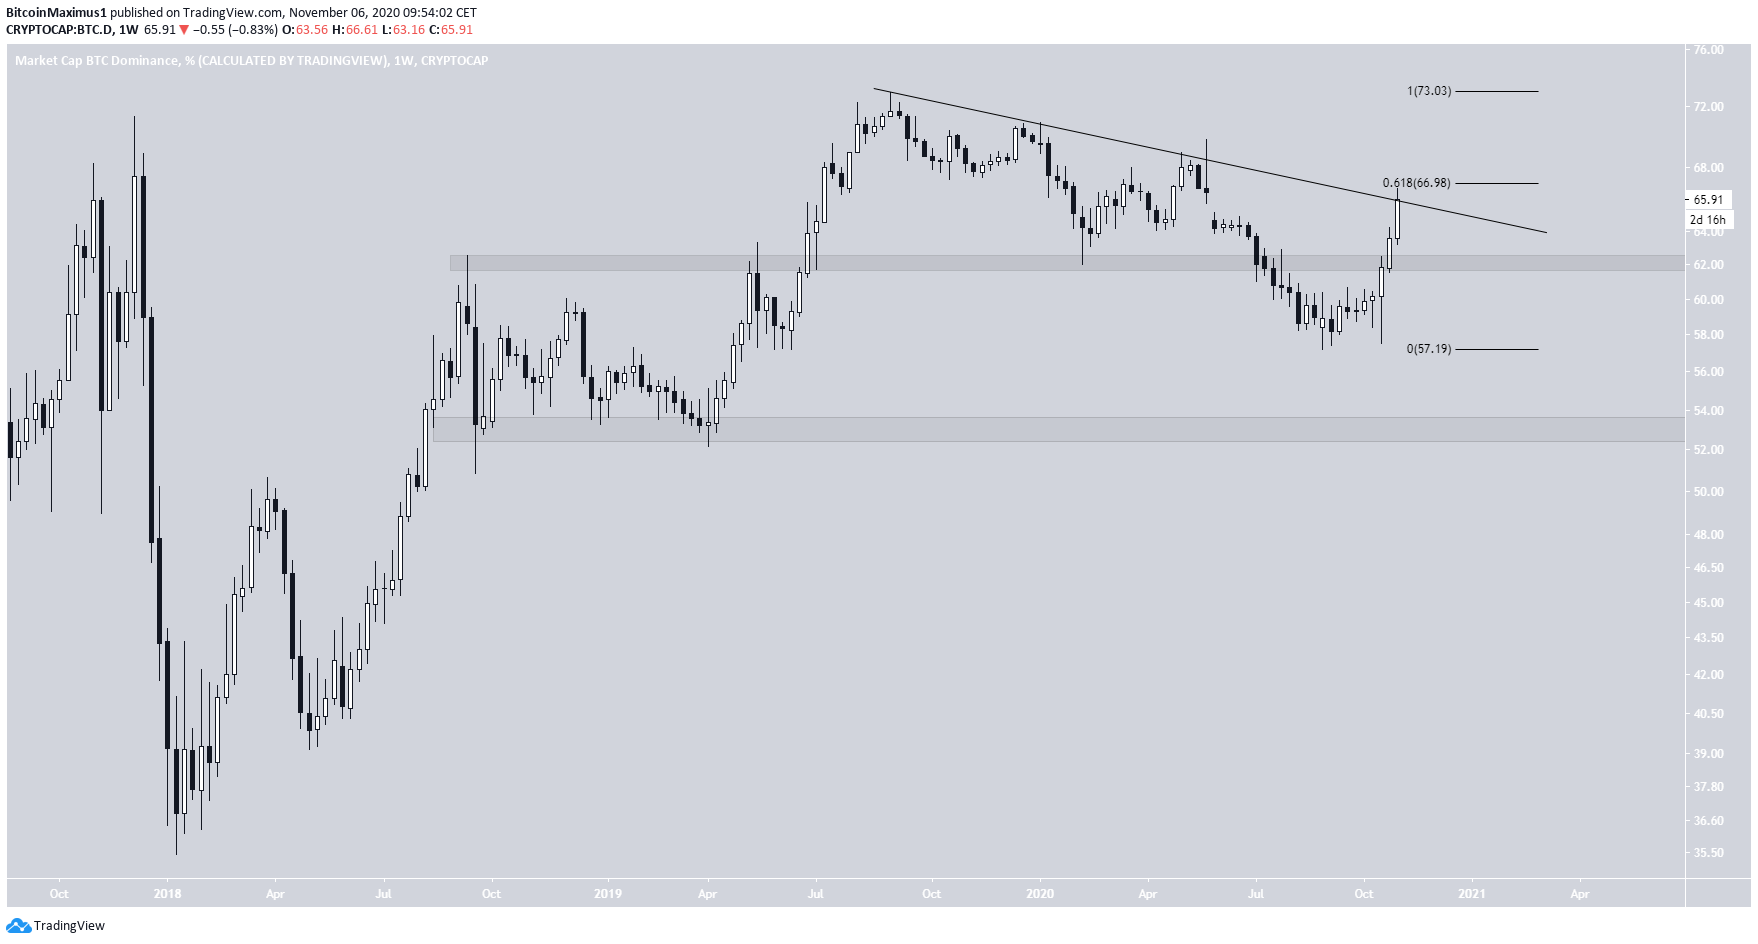
BTCD has been increasing since the beginning of September and has just reached a descending resistance line that has been in place since July 2019. This is the fourth time the resistance line has been validated.
Furthermore, the line coincides with the 0.618 Fib level of the entire fall, increasing its significance. If the price were to get rejected, the closest major support area would be found at 62%.
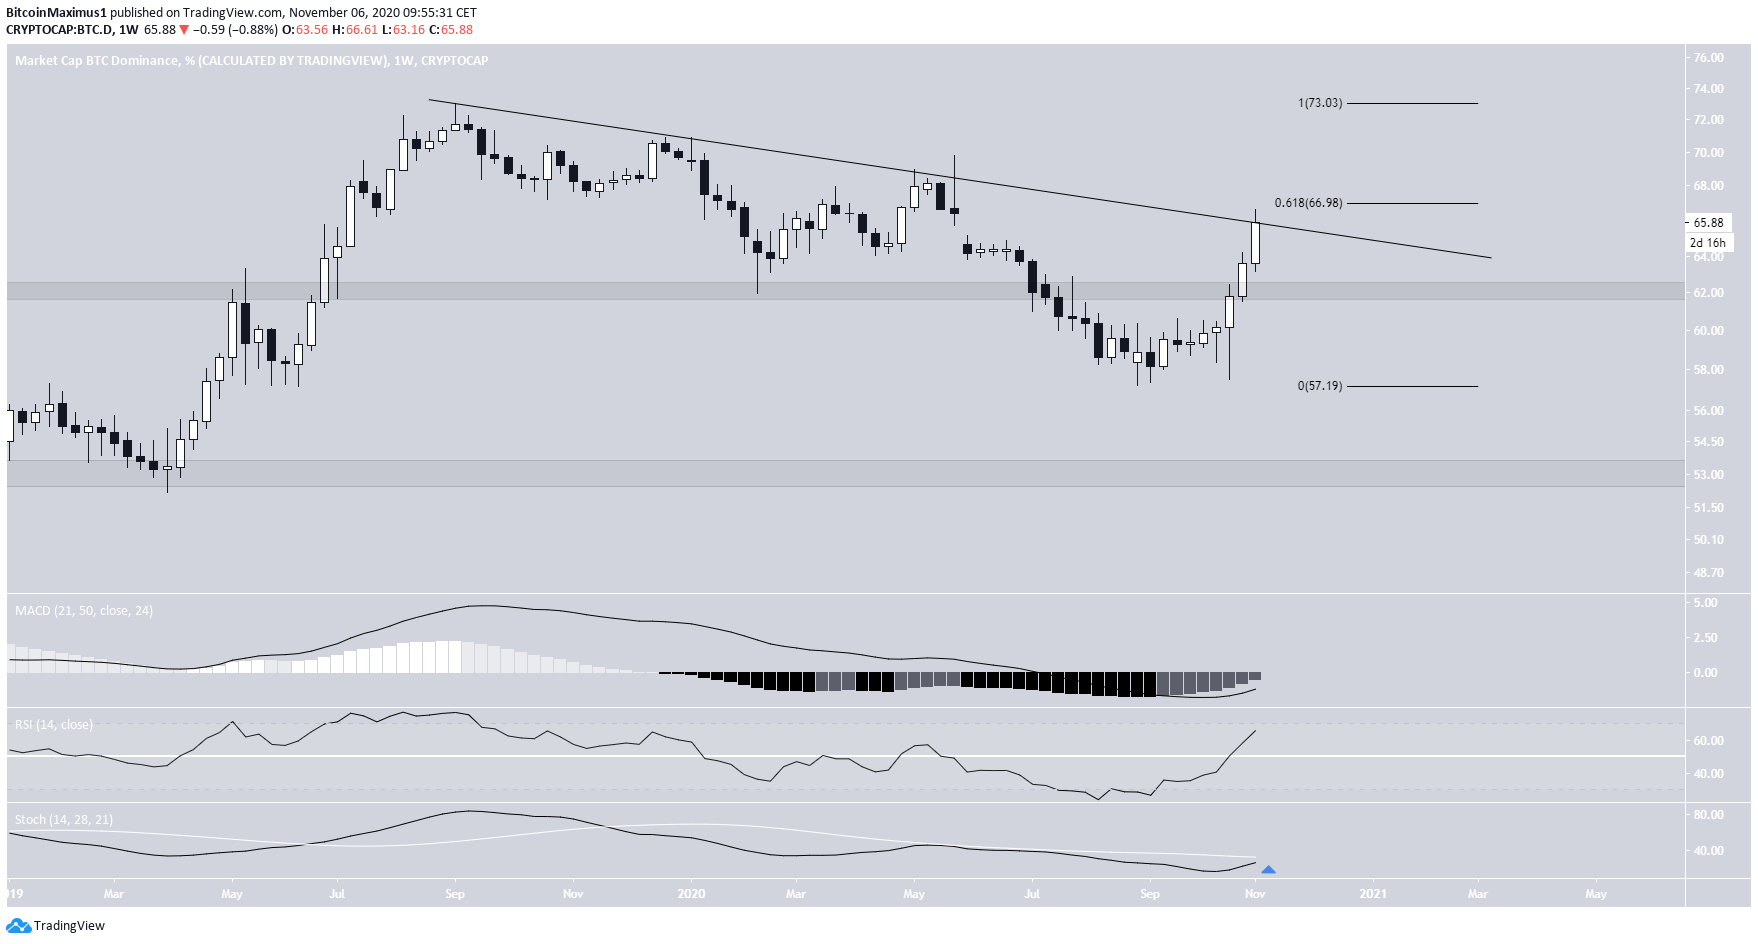
Despite the ongoing rally, technical indicators have not yet decisively turned bullish. While the RSI has crossed above 50, the MACD is below 0, and the Stochastic Oscillator has yet to make a bullish cross.
Therefore, we cannot confidently predict that the rate will break out from the current resistance.
Cryptocurrency trader @anbessa100 outlined a BTCD chart, stating that the rate has finally reached resistance at 66.5%. The area coincides with the descending resistance line we have drawn, and could act as the top.
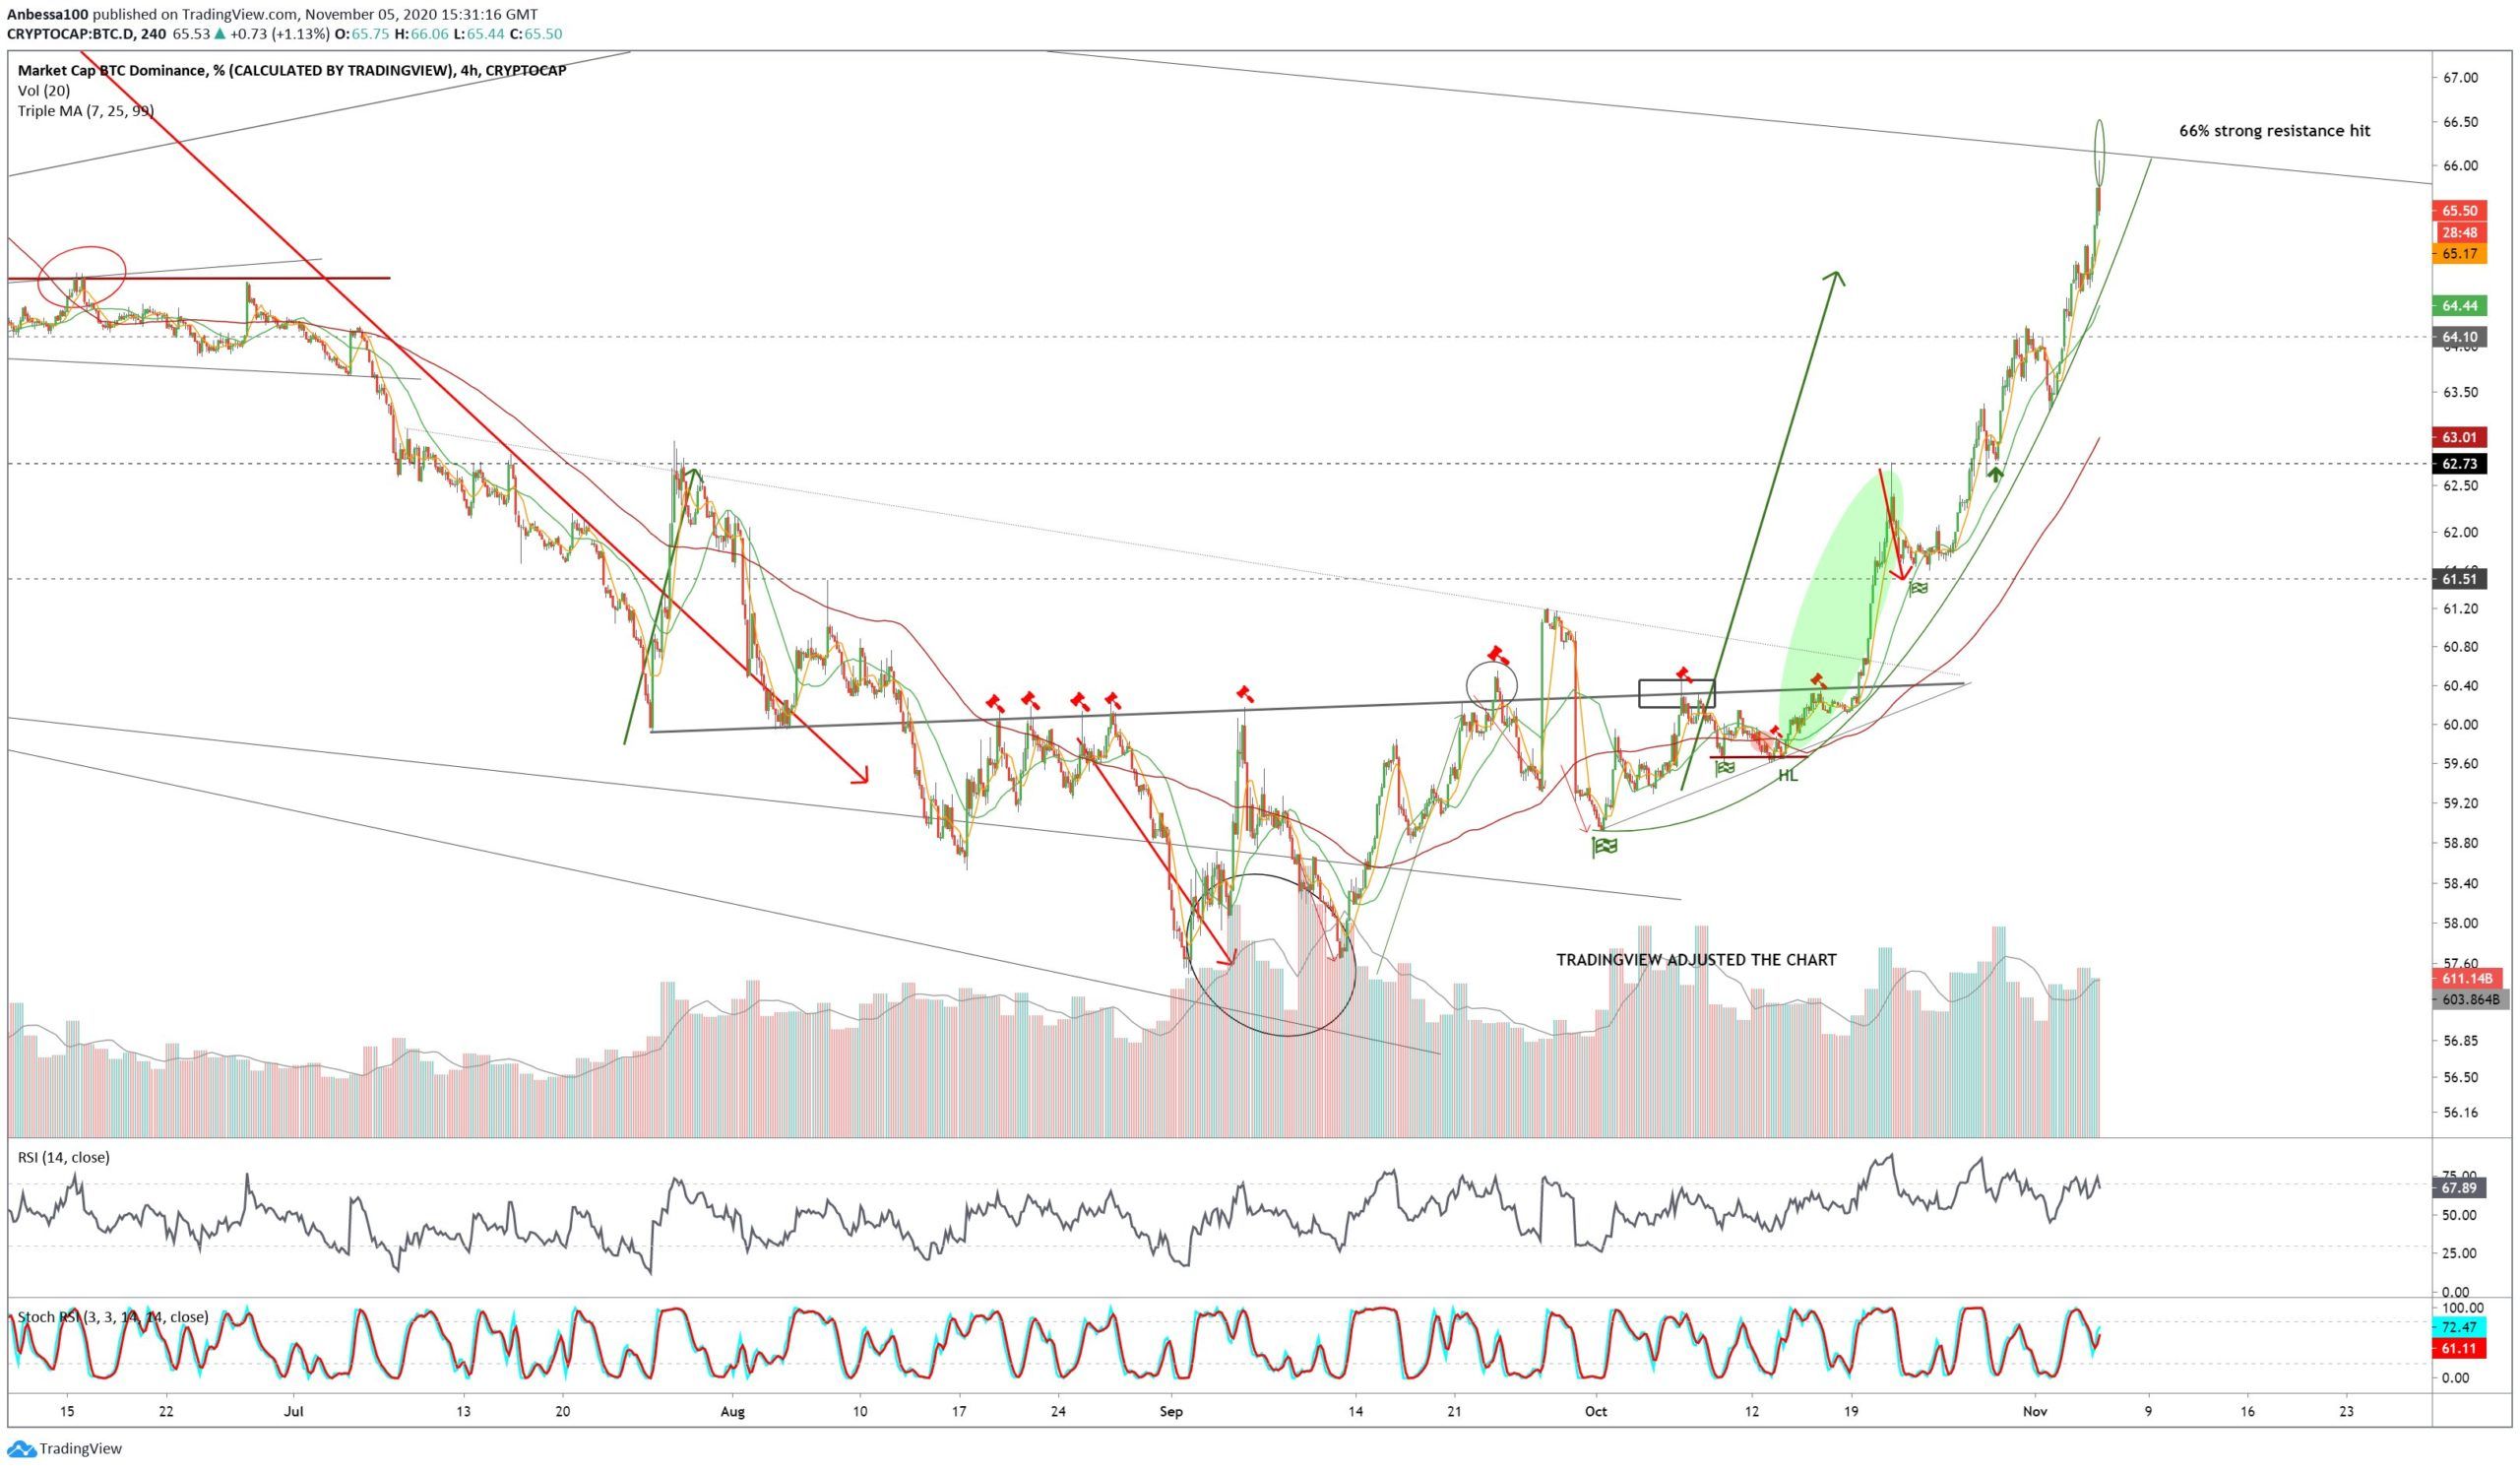
In order to determine that, a look at lower time-frames is required.
Future Movement
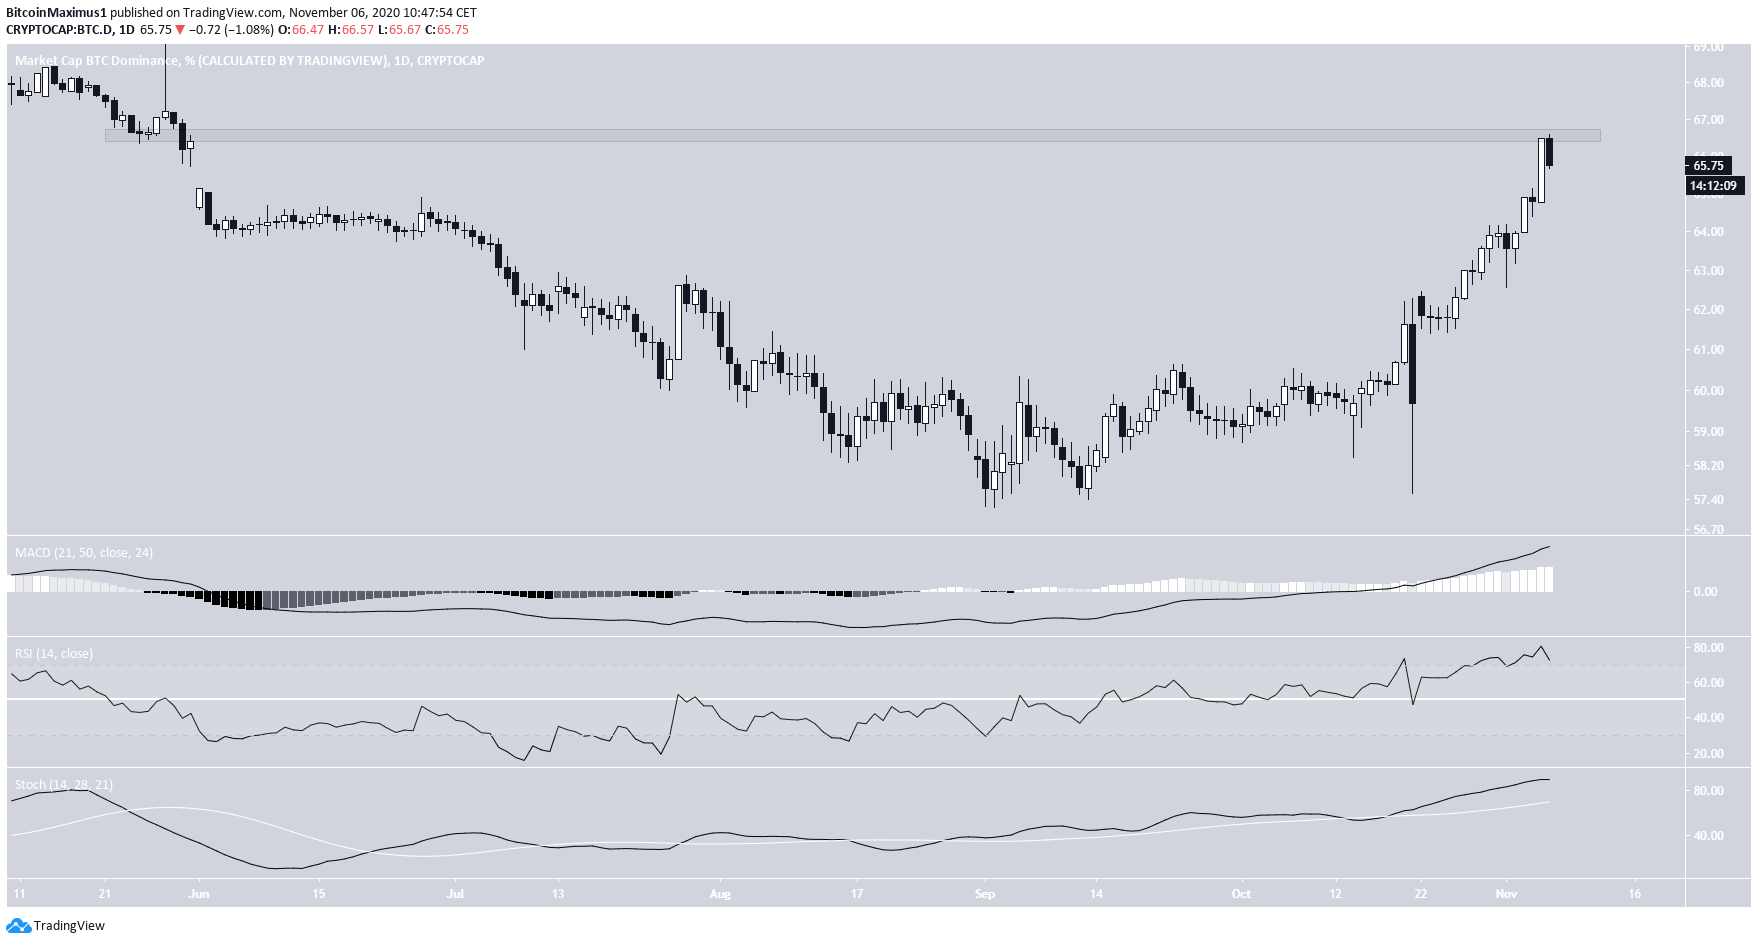
The daily chart shows that the 66.5% area also previously acted as support, further increasing its significance.
Despite the parabolic rally, technical indicators have yet to show any weakness, even if they are showing overbought conditions.
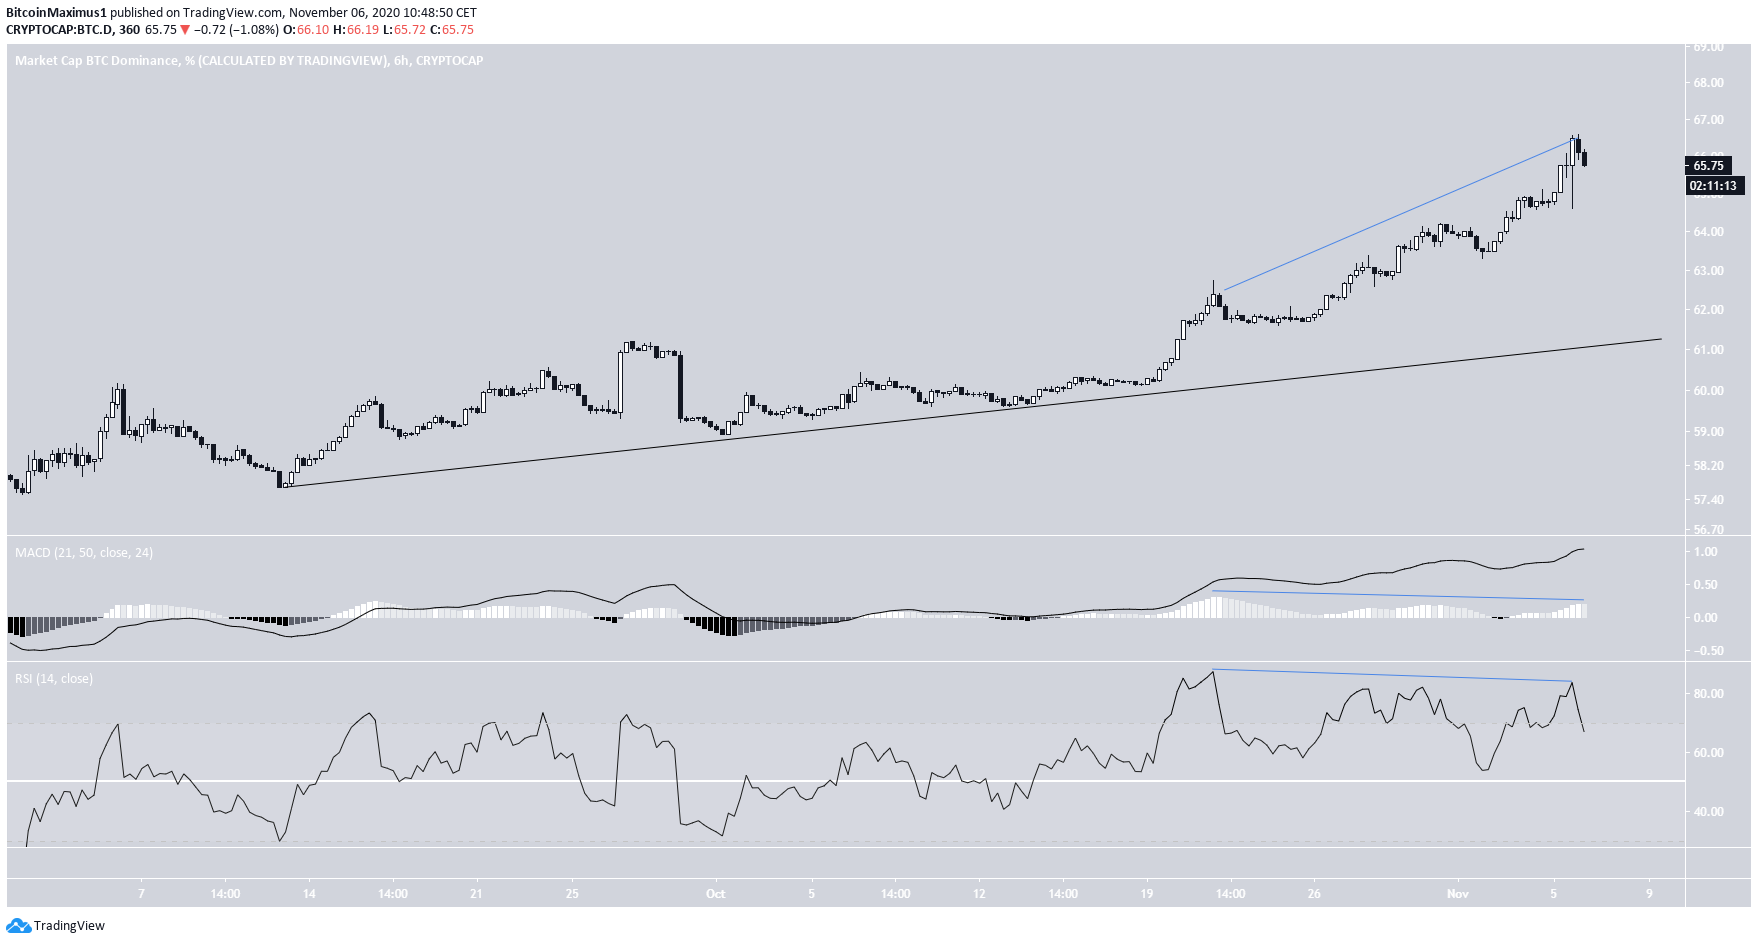
However, there are several bearish divergences present in the 6-hour chart, both in the RSI and the MACD.
It’s possible that they will cause BTCD to drop, possibly tagging the short-term ascending support line, which also coincides with the previous 62.5% support area.
Relationship to BTC
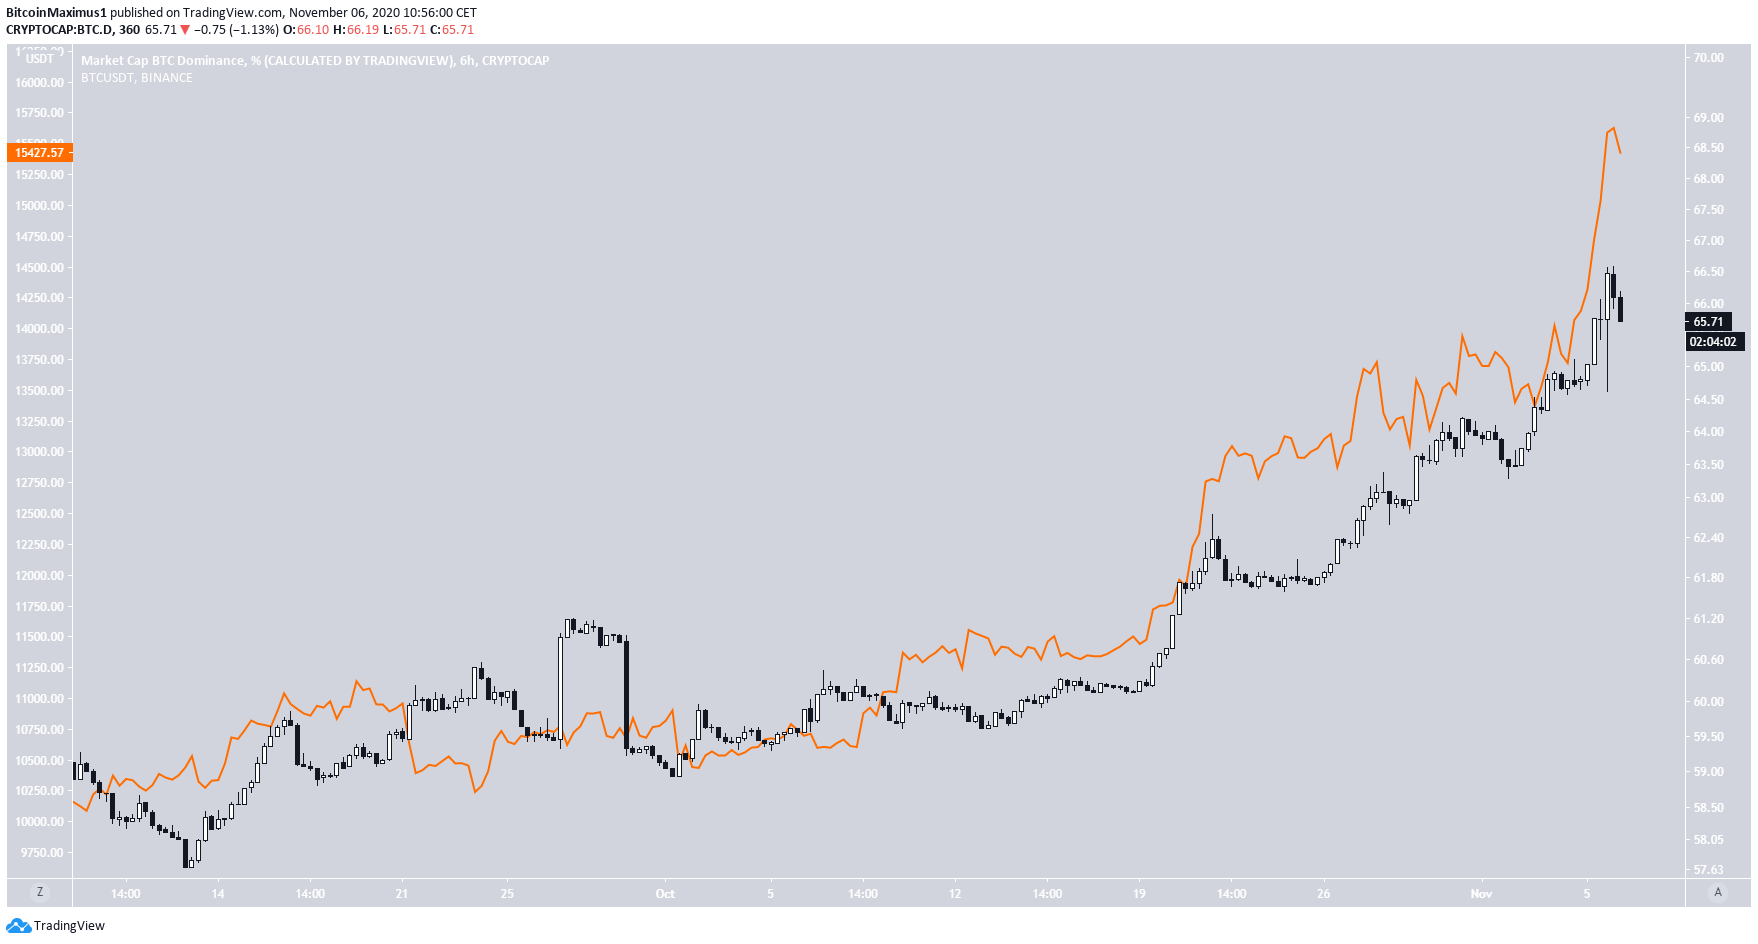
Over the past month, the relationship between BTC (shown in orange below) and BTCD has been positive, meaning an increase in the BTC price has also caused an increase in BTCD.
Therefore, if a decline in the BTC price occurs, the same could occur in BTCD.
Conclusion
To conclude, the BTCD has reached an important resistance area which could cause a rejection and a drop in the rate. This would also fit with the short-term readings from technical indicators.
For BeInCrypto’s previous Bitcoin analysis, click here!
Disclaimer: Cryptocurrency trading carries a high level of risk and may not be suitable for all investors. The views expressed in this article do not reflect those of BeInCrypto.
