
The Bitcoin Dominance Rate (BTCD) has been rejected by a long-term resistance area and is currently declining. BTCD should drop until it reaches the ascending support line near 66%.
Rejection From Long-Term Resistance
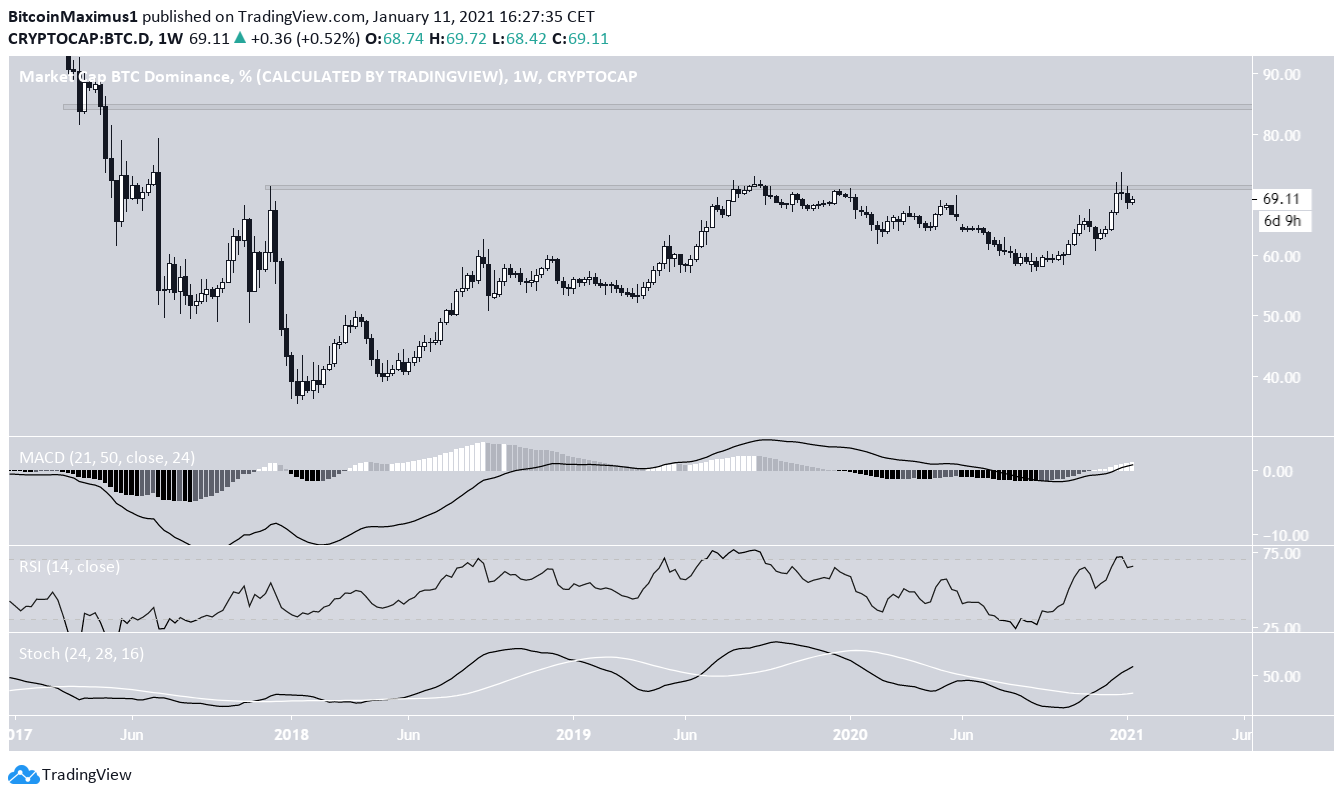
During the week of Dec. 27 – Jan. 4, BTCD fell from the long-term 71.5% resistance area. It has not traded above this level since June 2017.
Despite the rejection, technical indicators are still bullish. While the RSI has fallen below 70, the MACD is increasing, and the Stochastic Oscillator has made a bullish cross.
If it breaks out, the next resistance area would be at 84.5%.
BTCD Ongoing Support
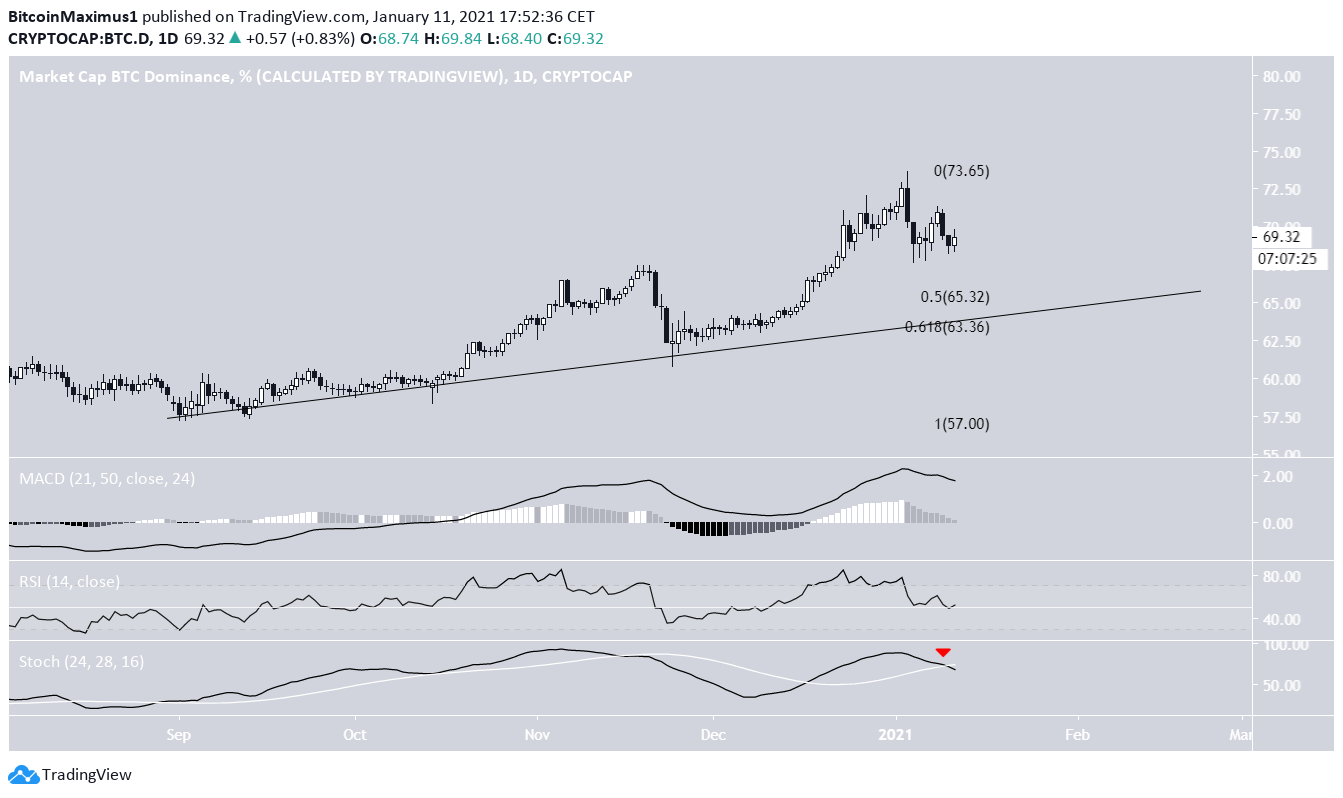
BTCD has been following an ascending support line since Sept. 01, and the line is currently near 65%, coinciding with the 0.5 Fib retracement level.
Technical indicators on the daily time-frame are bearish. The MACD has lost all of its strength, nearly crossing into negative territory. The RSI has fallen below 50, and the Stochastic Oscillator has just made a bearish cross.
Therefore, BTCD is likely to fall towards this support line and area.
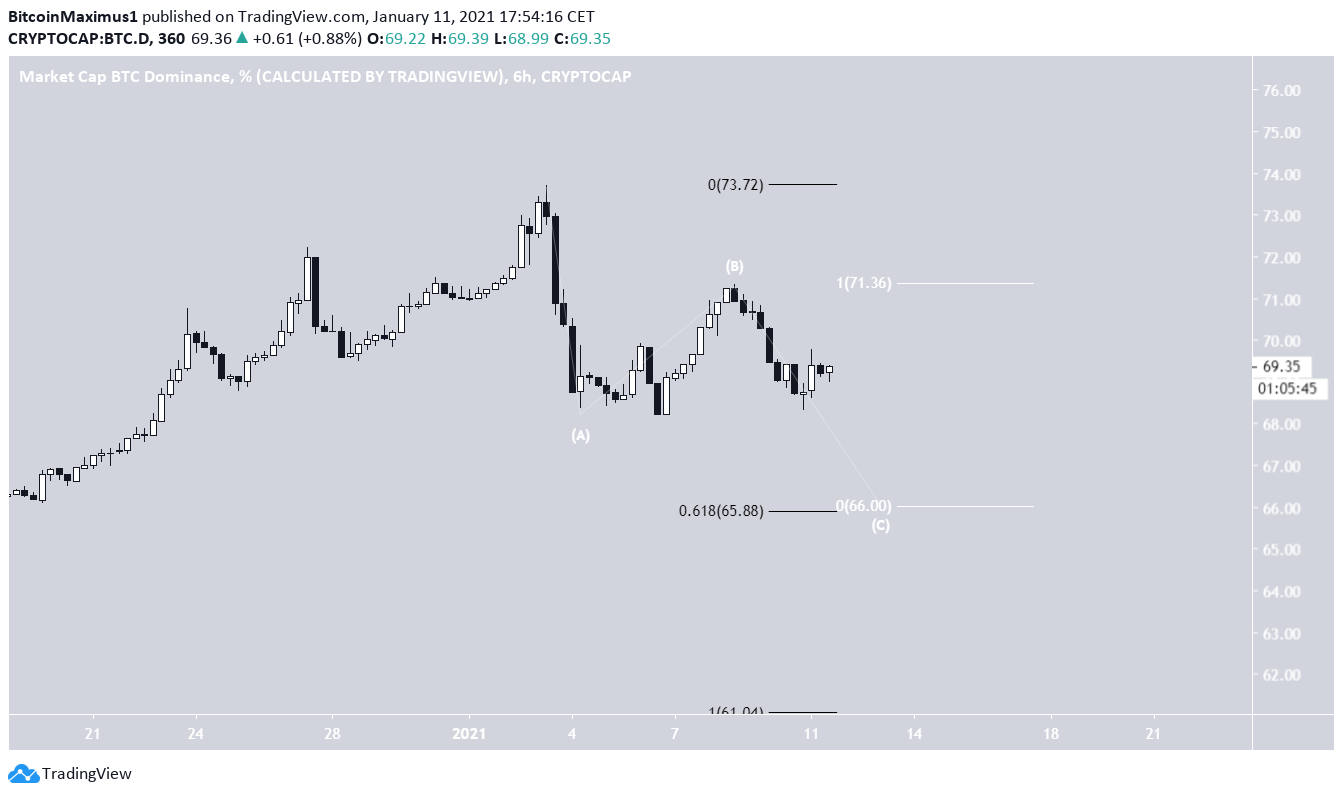
Cryptocurrency trader @TheEWguy stated that the price is in a bearish A-B-C corrective formation and should continue falling towards 66%.
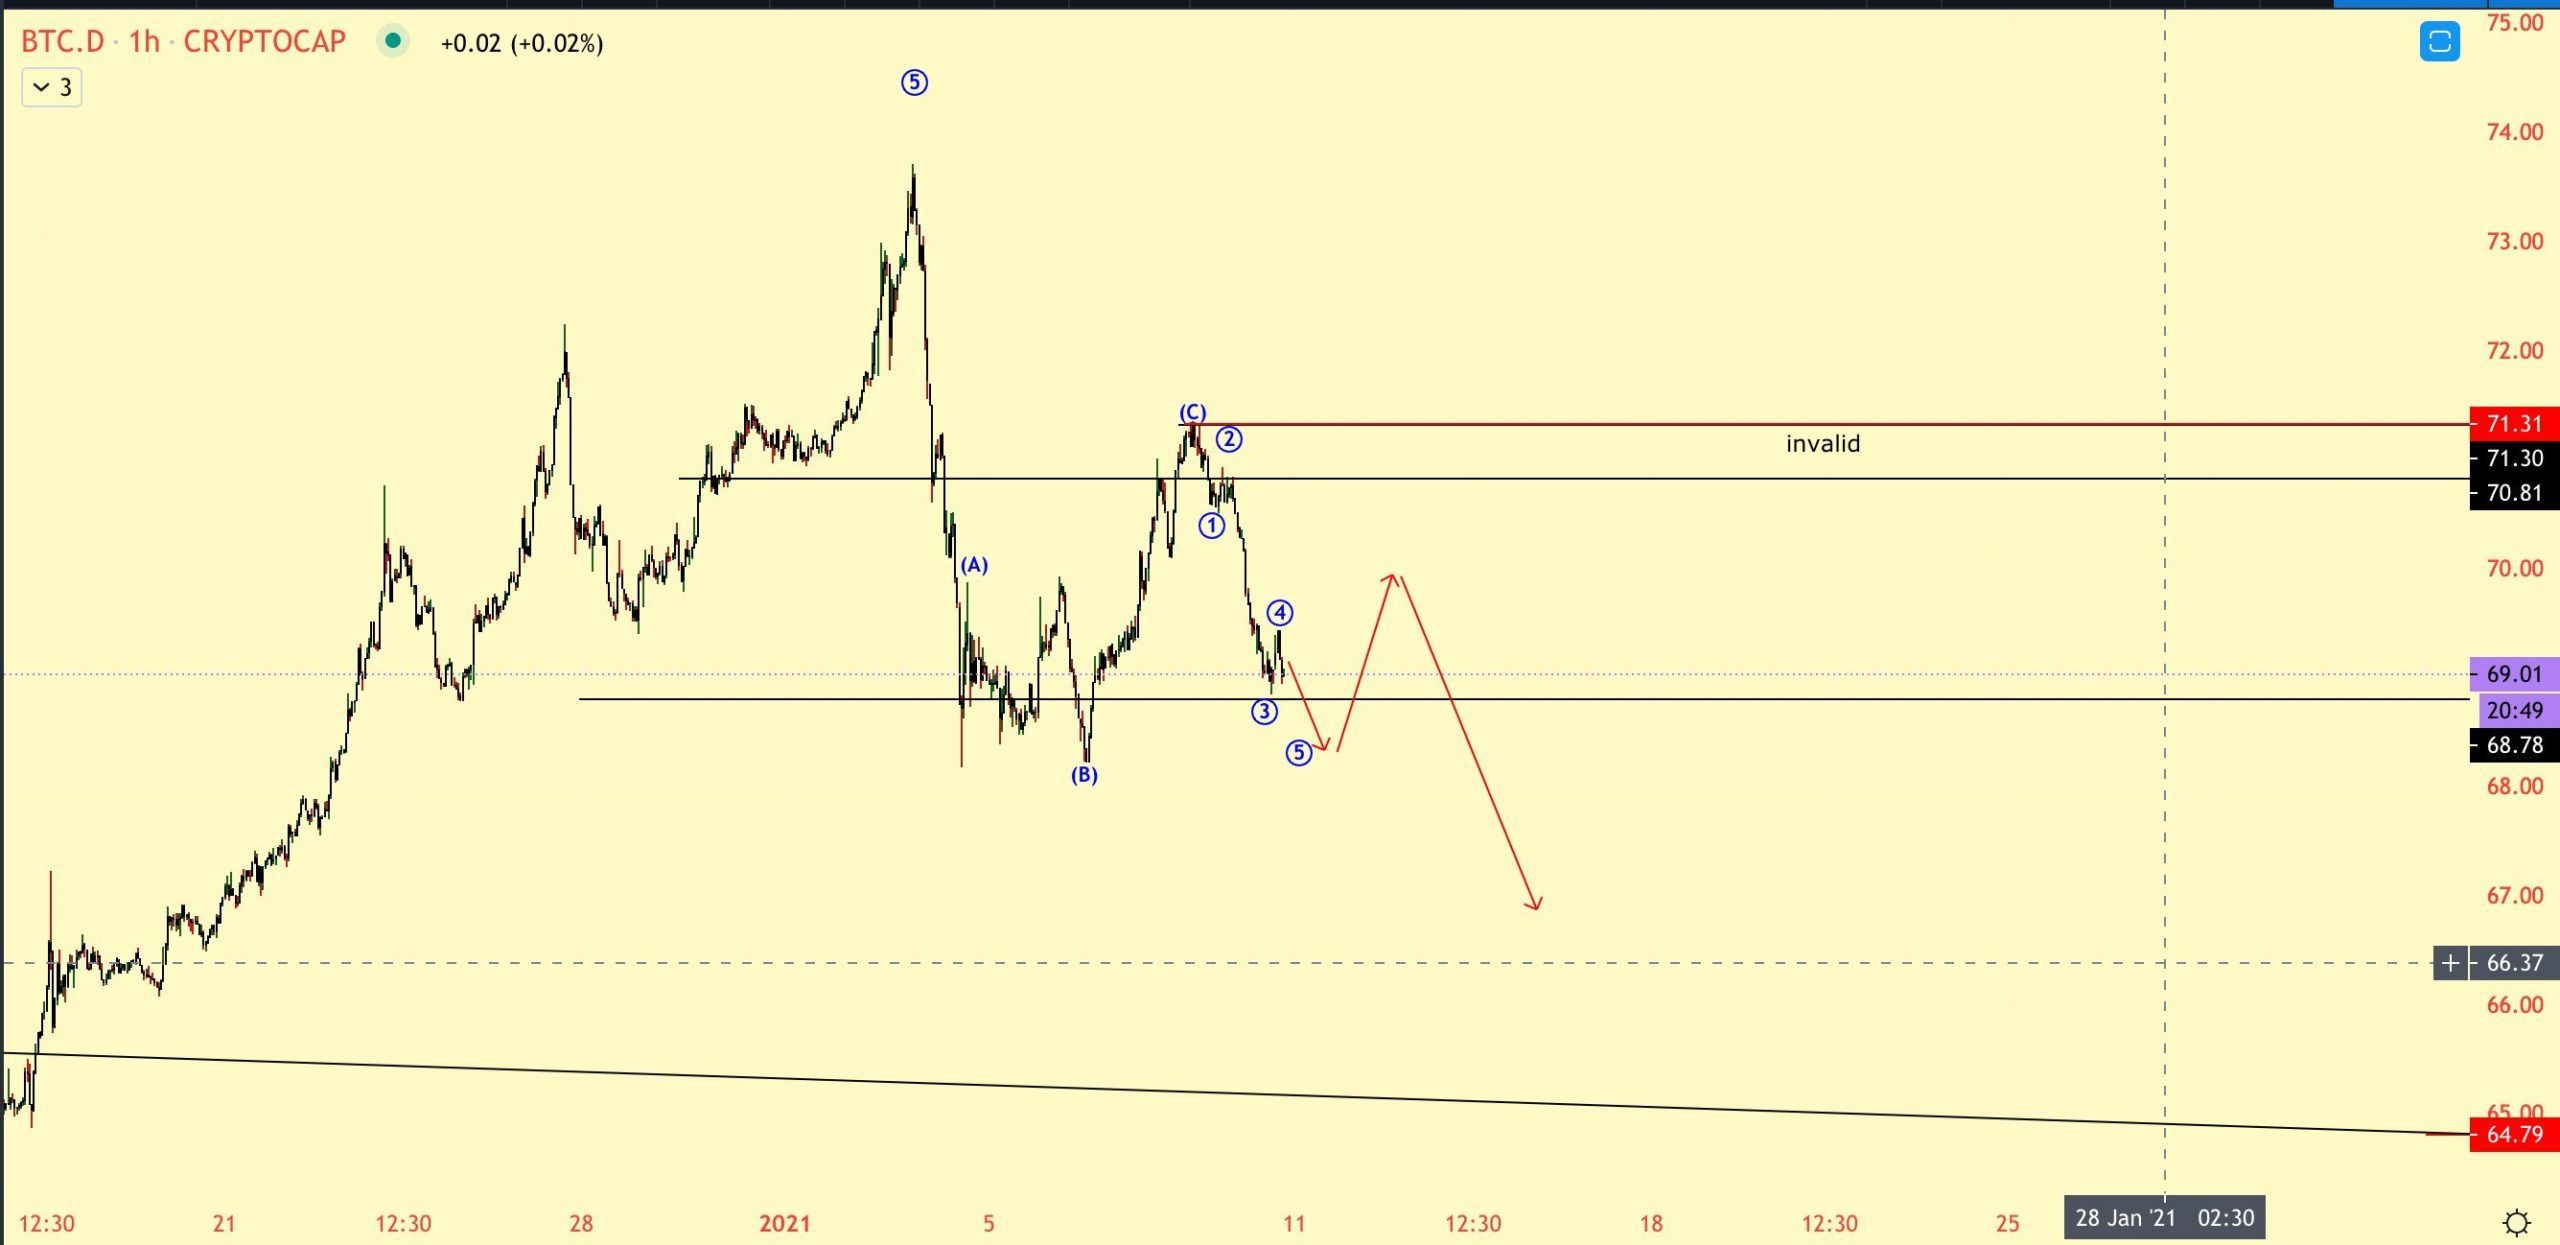
The wave count suggests that this is the C portion of an A-B-C corrective structure.
If waves A:C has a 1:1 ratio, which is very common in such corrections, BTCD will fall all the way to 66%, fitting with the 0.618 Fib retracement level.
Therefore, this is a very likely level for it to reach a bottom before moving higher.
Conclusion
To conclude, BTCD should continue declining until it reaches the ascending support line and area at 66%.
Despite this, the long-term trend is likely bullish.
For BeInCrypto’s latest Bitcoin (BTC) analysis, click here!
Disclaimer: Cryptocurrency trading carries a high level of risk and may not be suitable for all investors. The views expressed in this article do not reflect those of BeInCrypto.
