


At BeInCrypto, we offer regular price analyses and predictions of the most popular and relevant cryptoassets. Today, we are beginning a weekly series in which we compare price fluctuations of Bitcoin (BTC) against two of the most viewed stock market indices in the world: the S&P 500 and The NASDAQ Composite.
NASDAQ is weighted towards information technology companies while the S&P 500 is largely considered the best single gauge of large cap U.S. equities.
Bitcoin, on the other hand, has been selected because it remains the industry’s leading cryptocurrency.
NASDAQ
The price of NDAQ reached a low of $83.20 on Mar 24. Since, it has been increasing, creating several higher lows.
Tracing these lows gives us an ascending support line.
It reached highs of $90.50 on Apr 21; however, NASDAQ does not appear to be following any observable It is not following any apparent resistance lines.
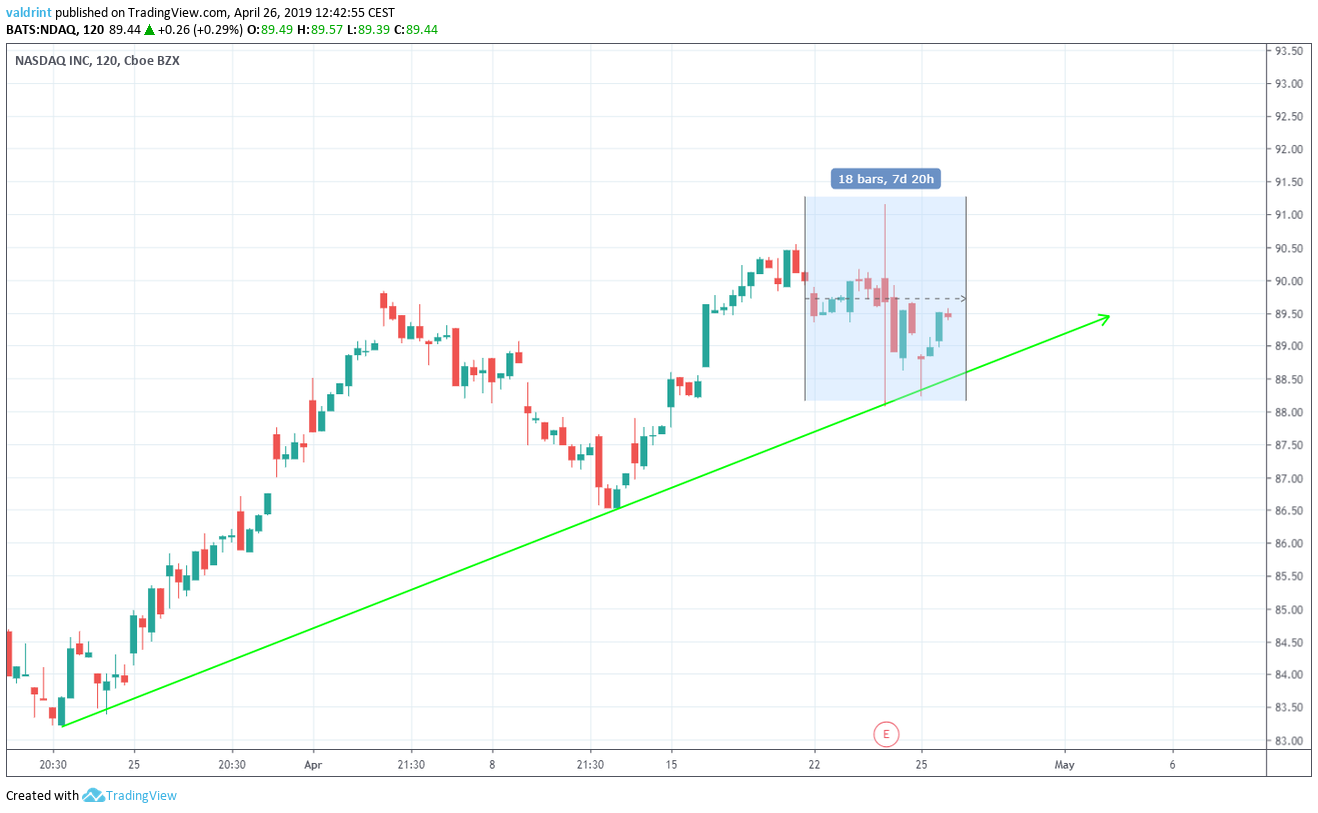
The highlighted part of the graph is the price of NDAQ during the week of Apr 19-26. During this period, it has seen slight price decreases.
At the time of writing, the price is trading close to the support line near $89.50.
S&P 500
The price of SP500 reached a low of $2886.00 on Apr 21. A gradual increase ensued. It reached high of $2936.60 on Apr 23.
The price has been trading inside the ascending triangle outlined below.
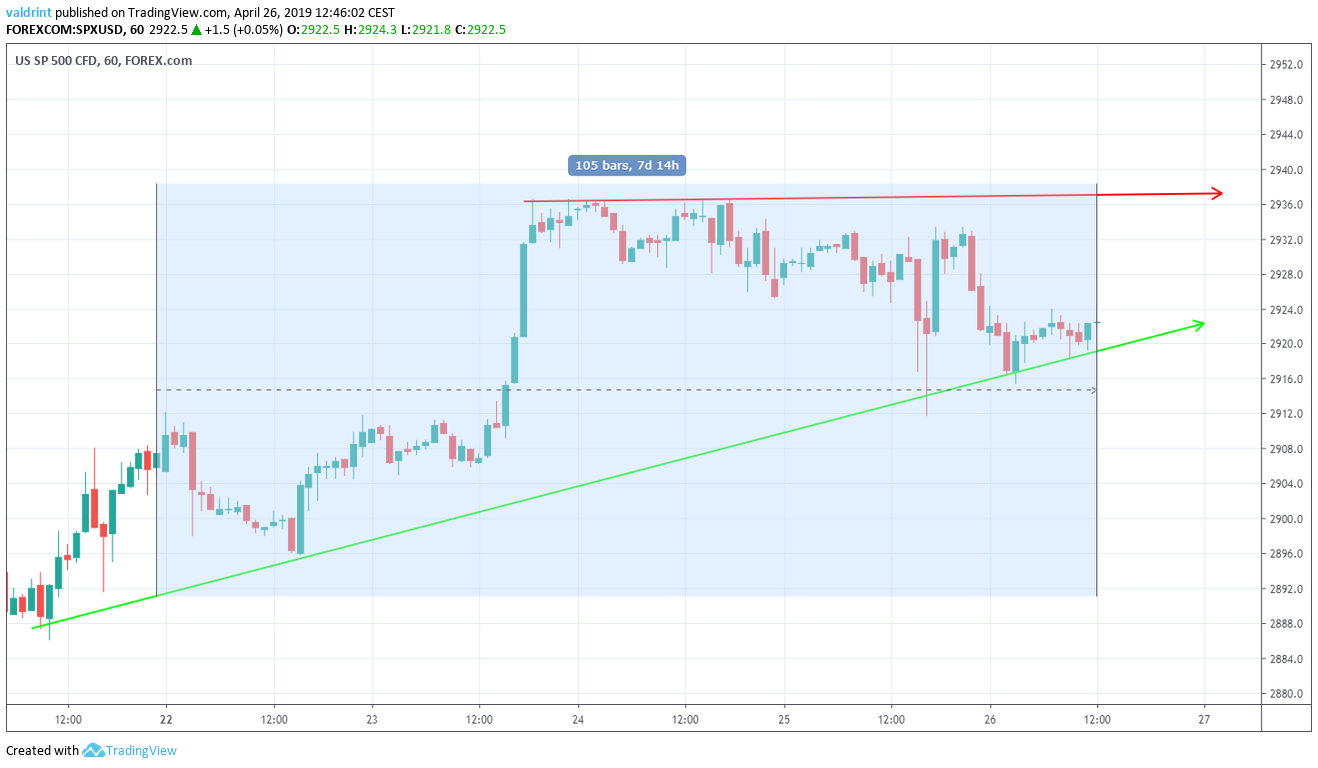
The highlighted part is the price of SP500 during the week of Apr 19-26. During this period, it has experienced slight increases.
At the time of writing, the price was trading near $2933, close to the support line of the triangle.
Bitcoin
On Apr 2, a massive spike caused Bitcoin to break out of its previous trading pattern. The price reached a high of $5335.50 the following day.
Since then, the price has been trading inside an ascending channel. It has touched both the resistance and support lines several times.
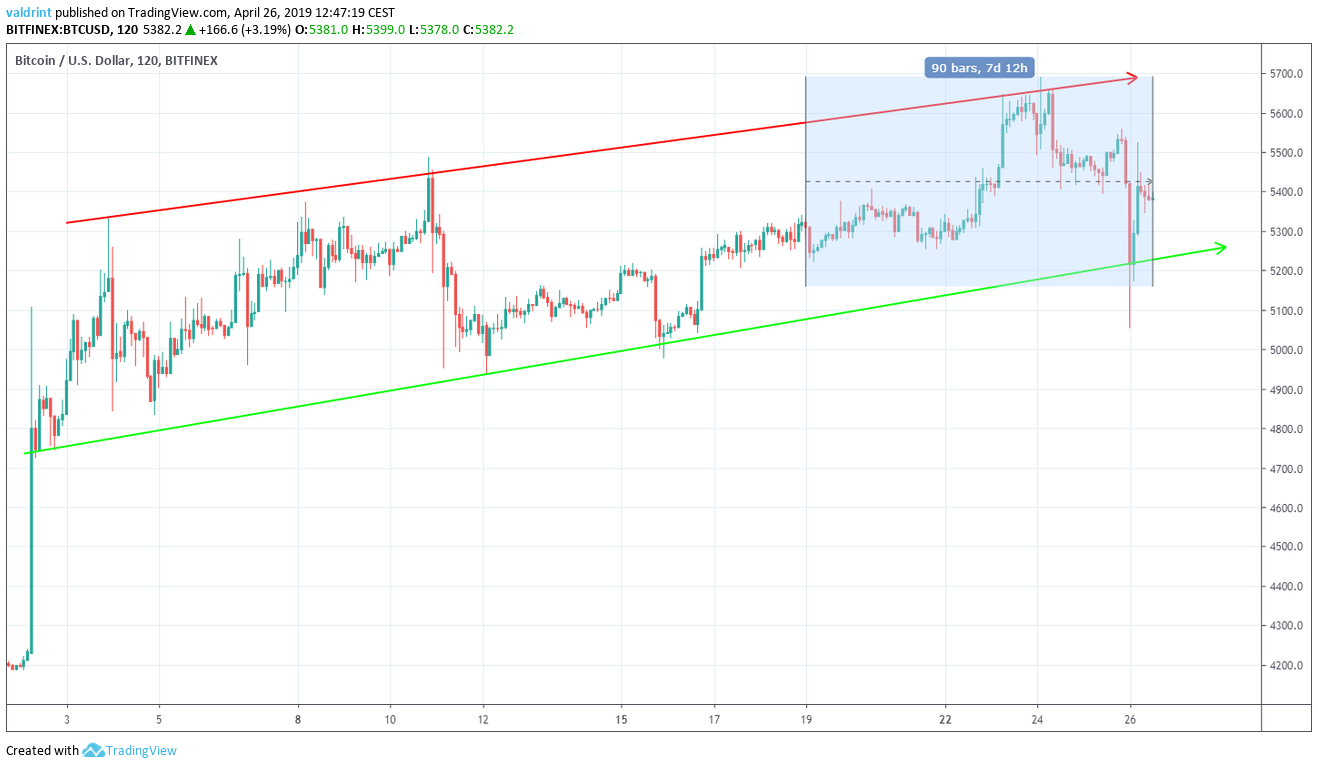
The highlighted part is the price of BTC during the week of Apr 19-26, during which the price of it has seen slight price increases.
At the time of writing the price was trading close to the support line of the channel at $5400.
Comparing April 19-26 Performances
The price of BTC (candle bars), S&P500 (blue line) and NDAQ (orange line) are compared at one-hour intervals from Apr 19 to Apr 26 in the graph below. The right-hand scale presents the percentage increase/decrease of the three assets during this period.
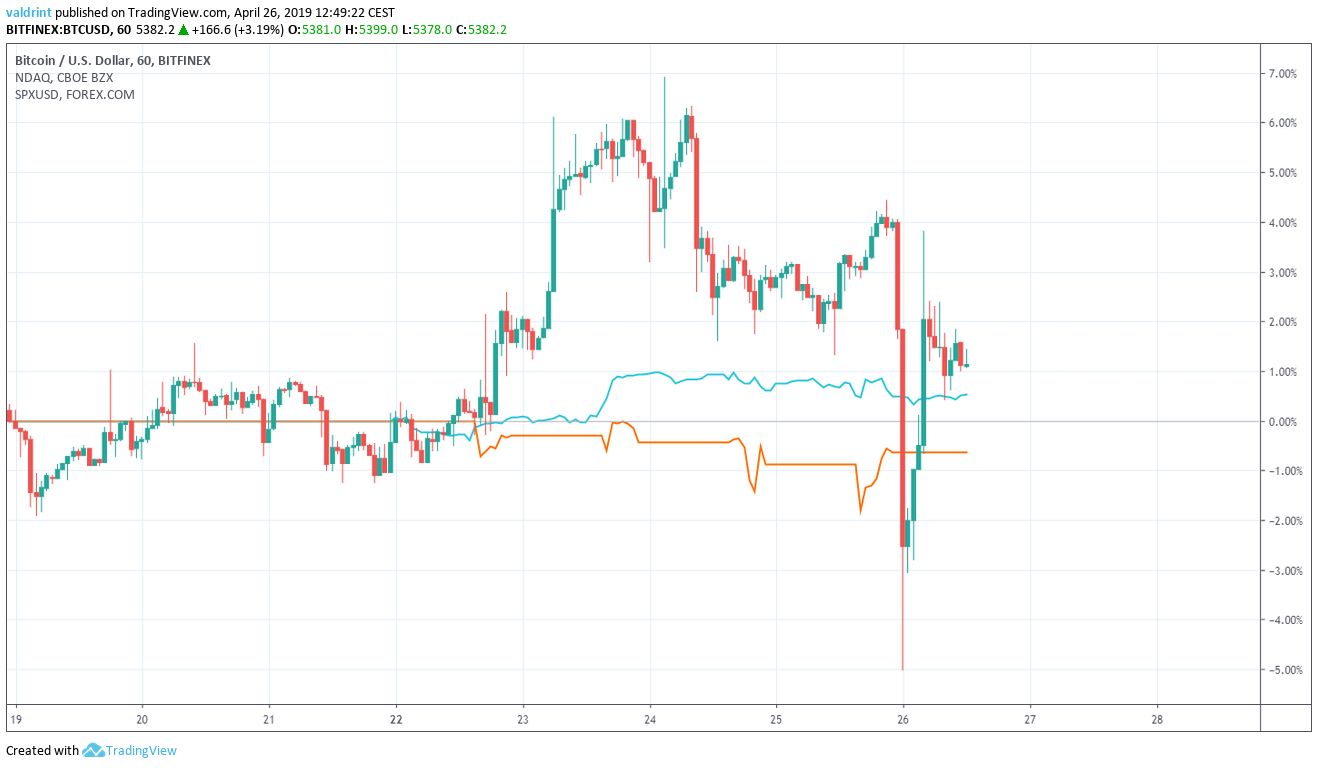
The price of BTC began the measuring period with a gradual increase, which intensified on Apr 23. On Apr 24, the price reached a high of almost 7% increase from the beginning of the measuring period. However, a sharp decrease took it to lows of -5%, before the price rebounded to an overall increase of 1.1% for the week.
The price of NDAQ has been gradually decreasing since the beginning of the measuring period. It did not experience significant fluctuations and finished the period with a decrease of 0.65%.
Finally, the price of S&P 500 has been gradually increasing since Apr 19. It finished the measuring period with an increase of 0.53%.
Summary
As evidenced by the charts above, we can come to the conclusion that the price of BTC has enjoyed the biggest increase, followed by the price of S&P 500. The price of NDAQ decreased slightly.
Furthermore, we can see that the price of BTC was the subject of considerable volatility relative to the two indices. All three assets are currently trading in positive patterns.
Based on this week’s findings, we can make the assumption that the price of BTC is significantly more volatile than the stock indices. Since both indices are created by the market capitalization of numerous companies, this is to be expected.
Interested in long-term bitcoin predictions? Click on the button below.
Disclaimer: This article is not trading advice and should not be construed as such. Always consult a trained financial professional before investing in cryptocurrencies, as the market is particularly volatile.


