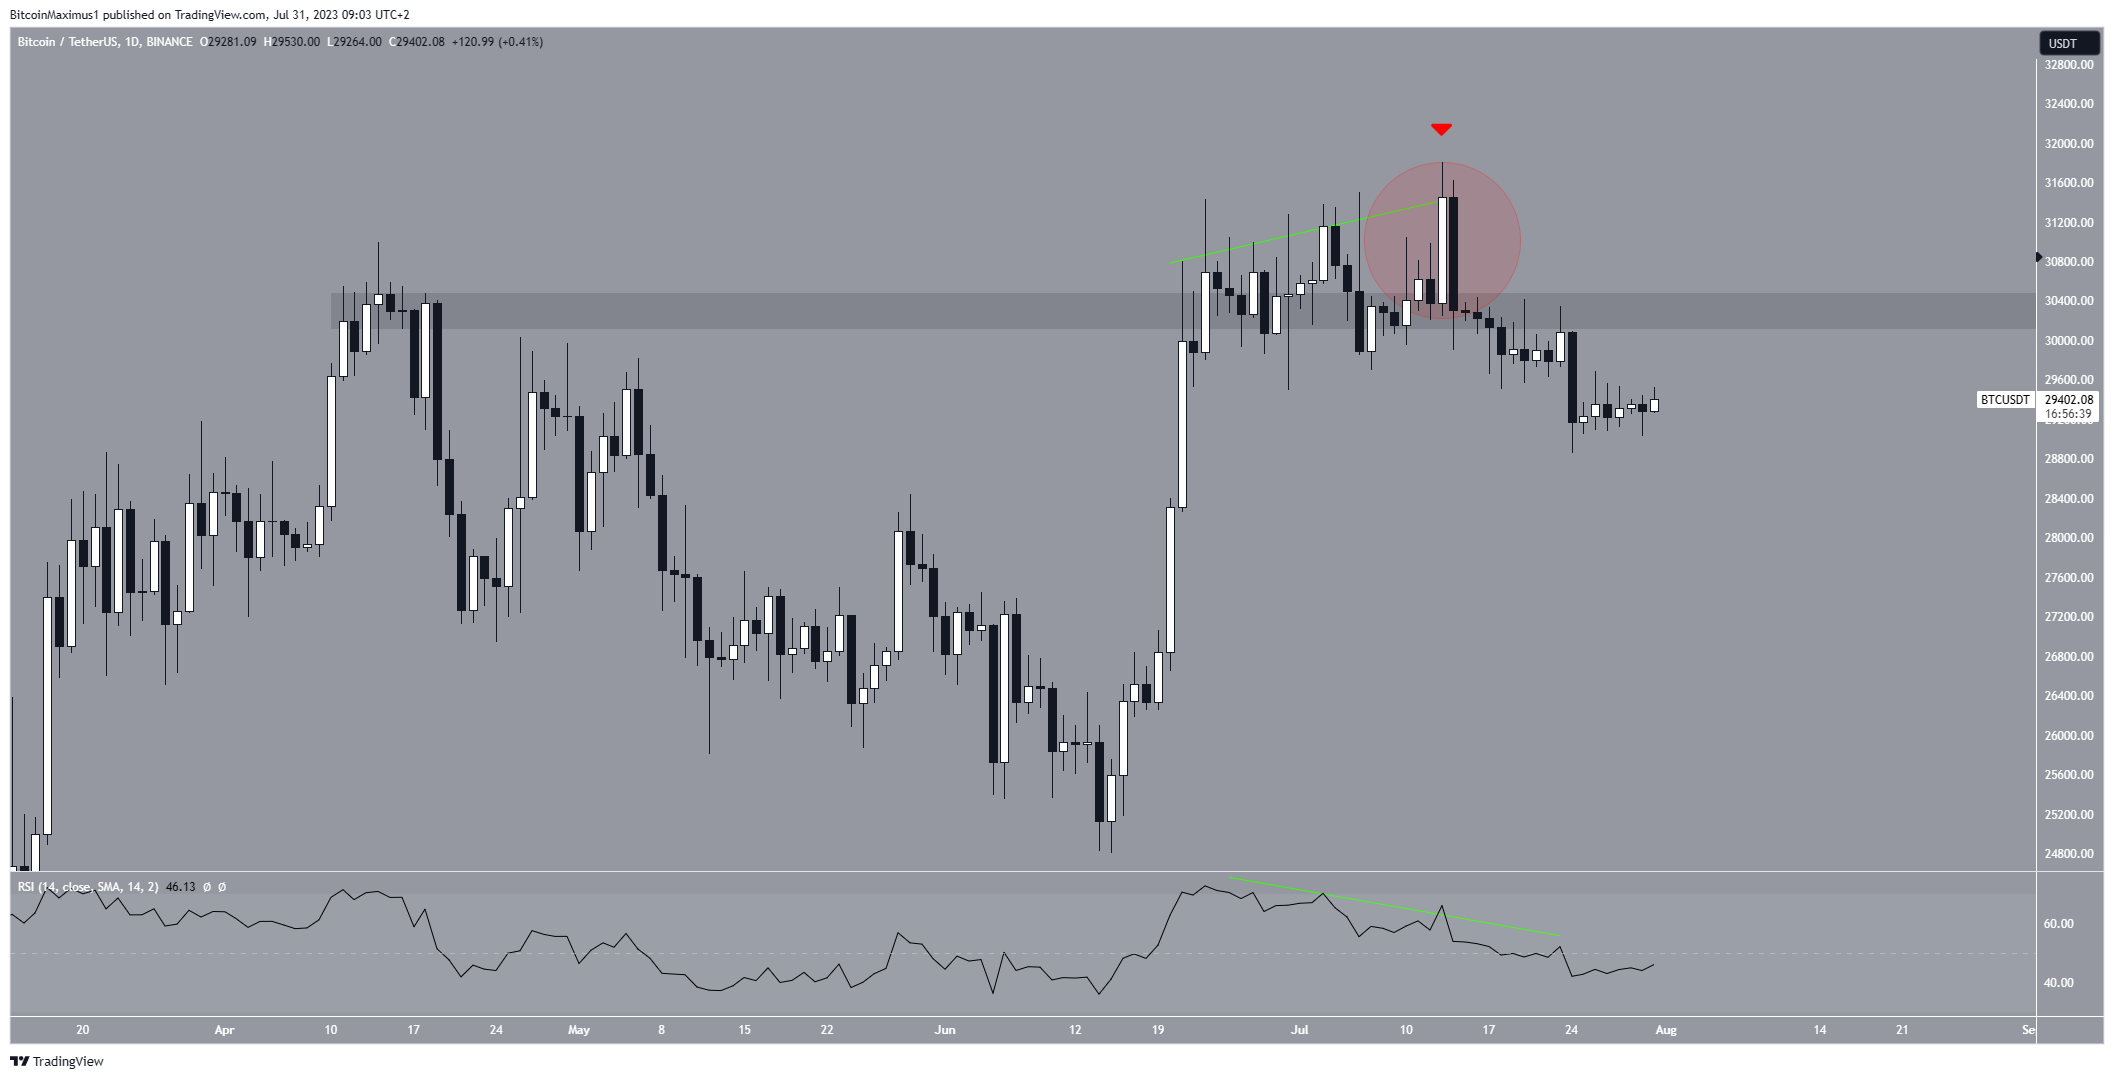
The price of Bitcoin (BTC) broke down from a horizontal resistance area on July 21, the culmination of a downward movement that had begun eight days before.
The readings from the daily timeframe are bearish, regarding to both the price action and RSI readings. However, the short-term wave count indicates that a price will reach a bottom soon if it has not already done so.
Bitcoin Price Deviates and Falls Below Resistance
The technical analysis from the daily time frame indicates a bearish outlook for BTC. On July 13, the price of BTC reached a new yearly high at $31,800 but quickly dropped afterward.
The following day, a bearish engulfing candlestick pattern was formed. The pattern is characterized by a large bearish candlestick (red circle) that completely engulfs the previous day’s bullish candle. Such patterns often signal potential downward movements.
Following the bearish candlestick pattern, BTC remained above the $30,000 horizontal level for a while. But, it eventually broke down decisively on July 23. This breakdown renders the entire previous breakout as a deviation, which is a bearish movement frequently followed by a sharp decrease.

The daily Relative Strength Index (RSI) presents a distinctly bearish reading. The RSI is a momentum indicator used by traders to assess market conditions and the sentiment surrounding an asset, indicating whether it’s overbought or oversold.
Typically, an RSI reading above 50, along with an upward trend, suggests that buyers have an advantage. On the other hand, a reading below 50 indicates the opposite. Currently, the RSI is in a declining trend and below 50, both of which are signs of a bearish trend.
Furthermore, with the price decrease, the RSI confirmed a triple bearish divergence that has been forming since June 23 (green line). A bearish divergence occurs when the price rises while the momentum indicator decreases. This indicates that the strength behind the upward movement is diminishing. This pattern often foreshadows a bearish trend reversal.
Unveil your crypto’s future! Predict now: Bitcoin (BTC) Price Prediction
BTC Price Prediction: Wave Count Predicts Bottom
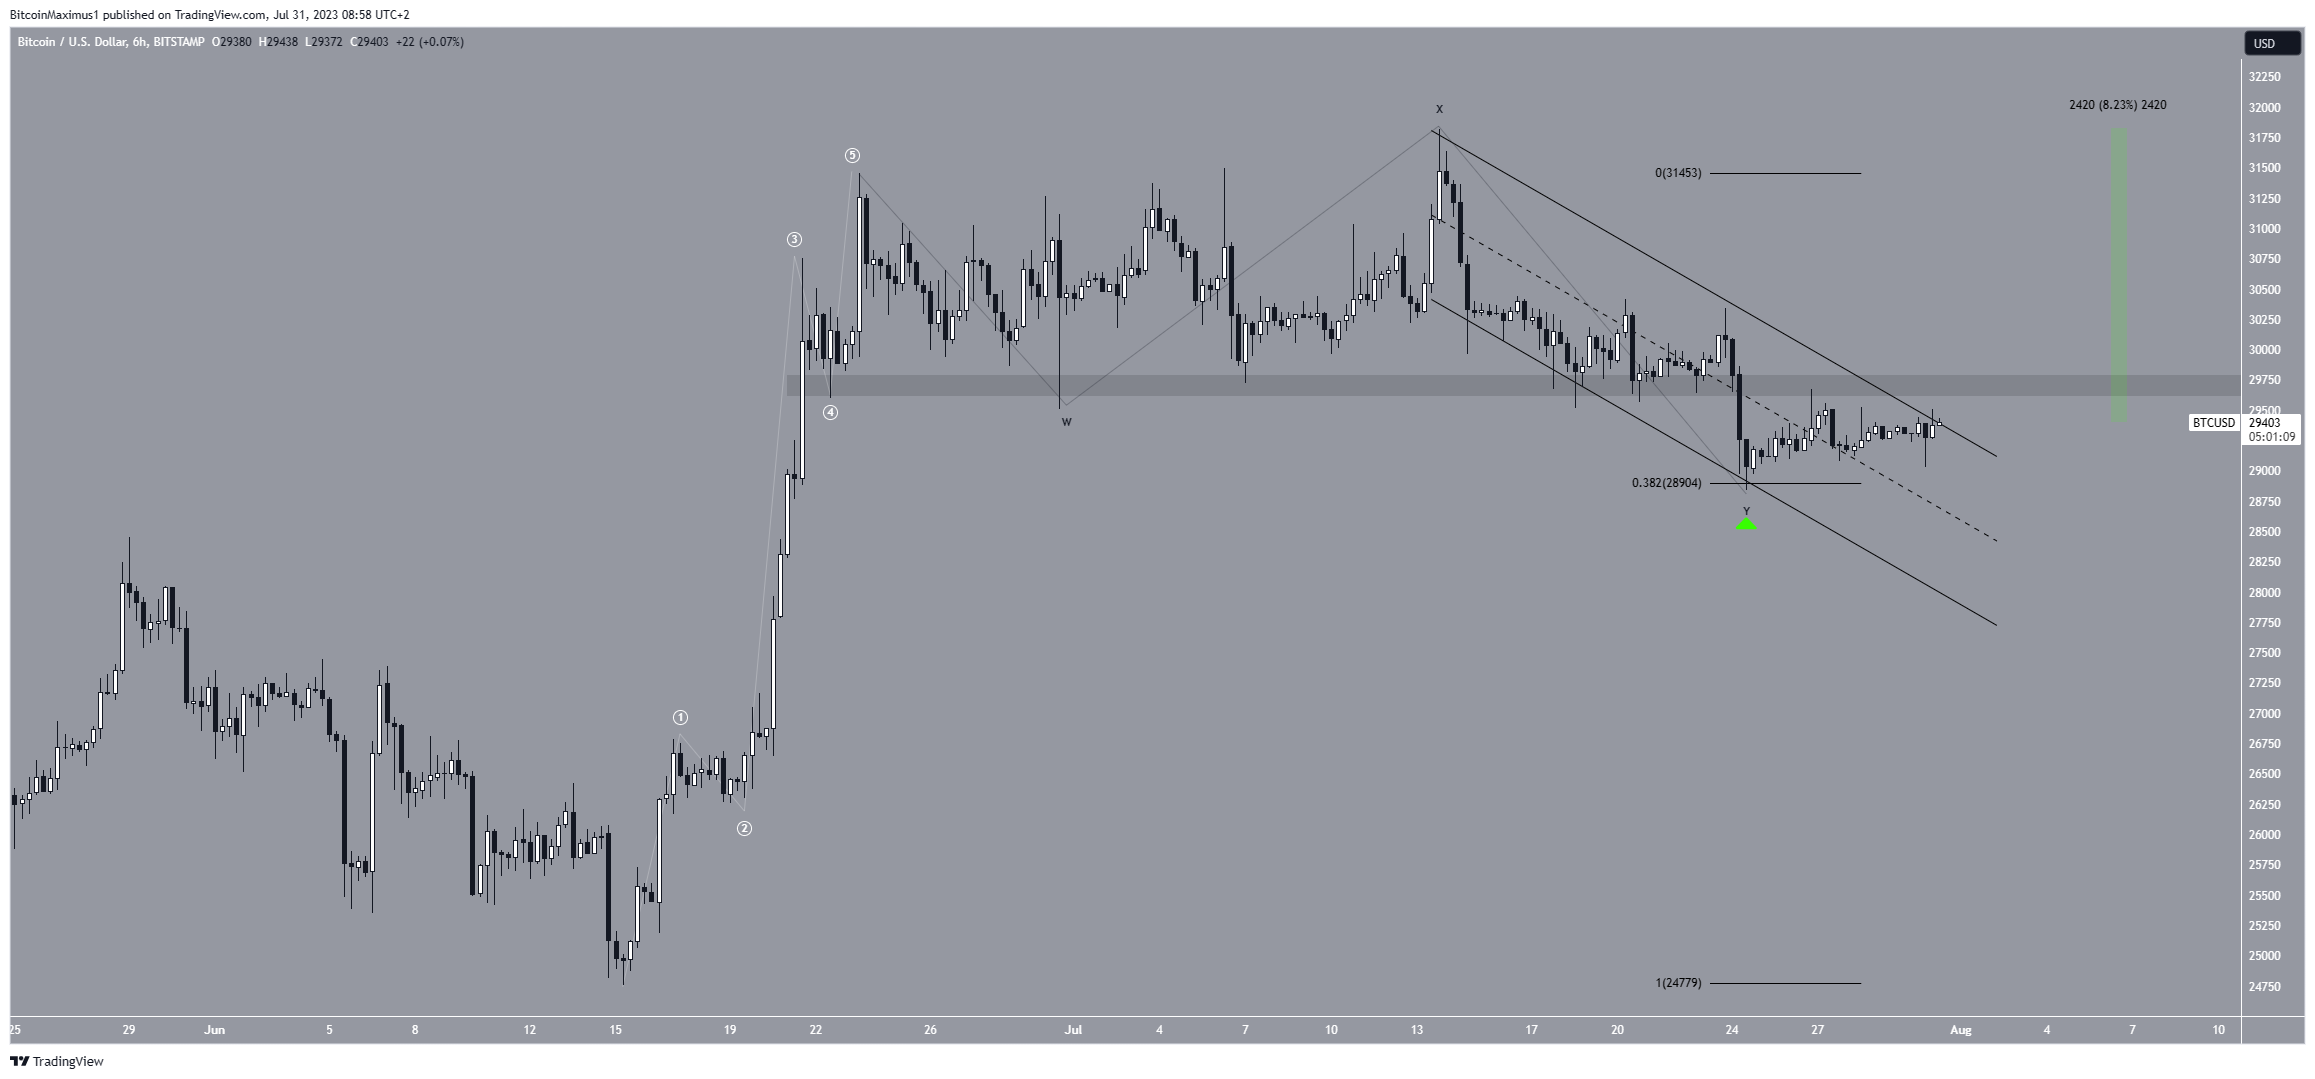
In a manner similar to the daily time frame, the six-hour chart suggests the price of BTC is correcting. However, it indicates that the correction is approaching its end.
Based on the wave count analysis, there has been a five-wave increase in BTC price since June 14. If this wave count is accurate, it implies that the price has experienced a correction afterwards, likely following a W-X-Y pattern.
On July 24, the BTC price bounced at the 0.382 Fibonacci retracement support level (green icon). According to Fibonacci retracement theory, after a significant price change in one direction, the price is expected to partially retrace back to a previous price level before continuing in the same direction.
Moreover, the bounce coincided with the channel’s support line. This makes it even more likely that the movement inside the channel was corrective. However, a breakout from the channel is required to confirm that the correction is complete.
In that case, the BTC price will likely break out from the channel’s resistance line and increase to its yearly high of $31,800, an increase of 8% from the current price.

Despite the optimistic BTC price prediction, a movement below the July 24 low of $28,842 will mean that the correction is not yet complete. In that case, another decrease to the channel’s support line will be likely.
Currently, the support line is at $28,000. clear and decisive close below the 0.618 Fibonacci retracement support at $27,300 will suggest that the price has reached a local top instead. In such a scenario, the BTC price could decline to $25,000.
Read More: How To Make Money in a Bear Market
For BeInCrypto’s latest crypto market analysis, click here.
Disclaimer
In line with the Trust Project guidelines, this price analysis article is for informational purposes only and should not be considered financial or investment advice. BeInCrypto is committed to accurate, unbiased reporting, but market conditions are subject to change without notice. Always conduct your own research and consult with a professional before making any financial decisions. Please note that our Terms and Conditions, Privacy Policy, and Disclaimers have been updated.


