
As April approaches, traders are closely watching whether Bitcoin can maintain its current momentum or face another round of volatility. The leading crypto trades at $87,208, noting a 10% uptick in the past two weeks.
With broader market recovery underway, BTC demand could strengthen in April, and its price could steadily recover and potentially retest the $90,000–$95,000 range.
Bitcoin’s Market Bottom? Analyst Says Current Levels Signal a Bounce
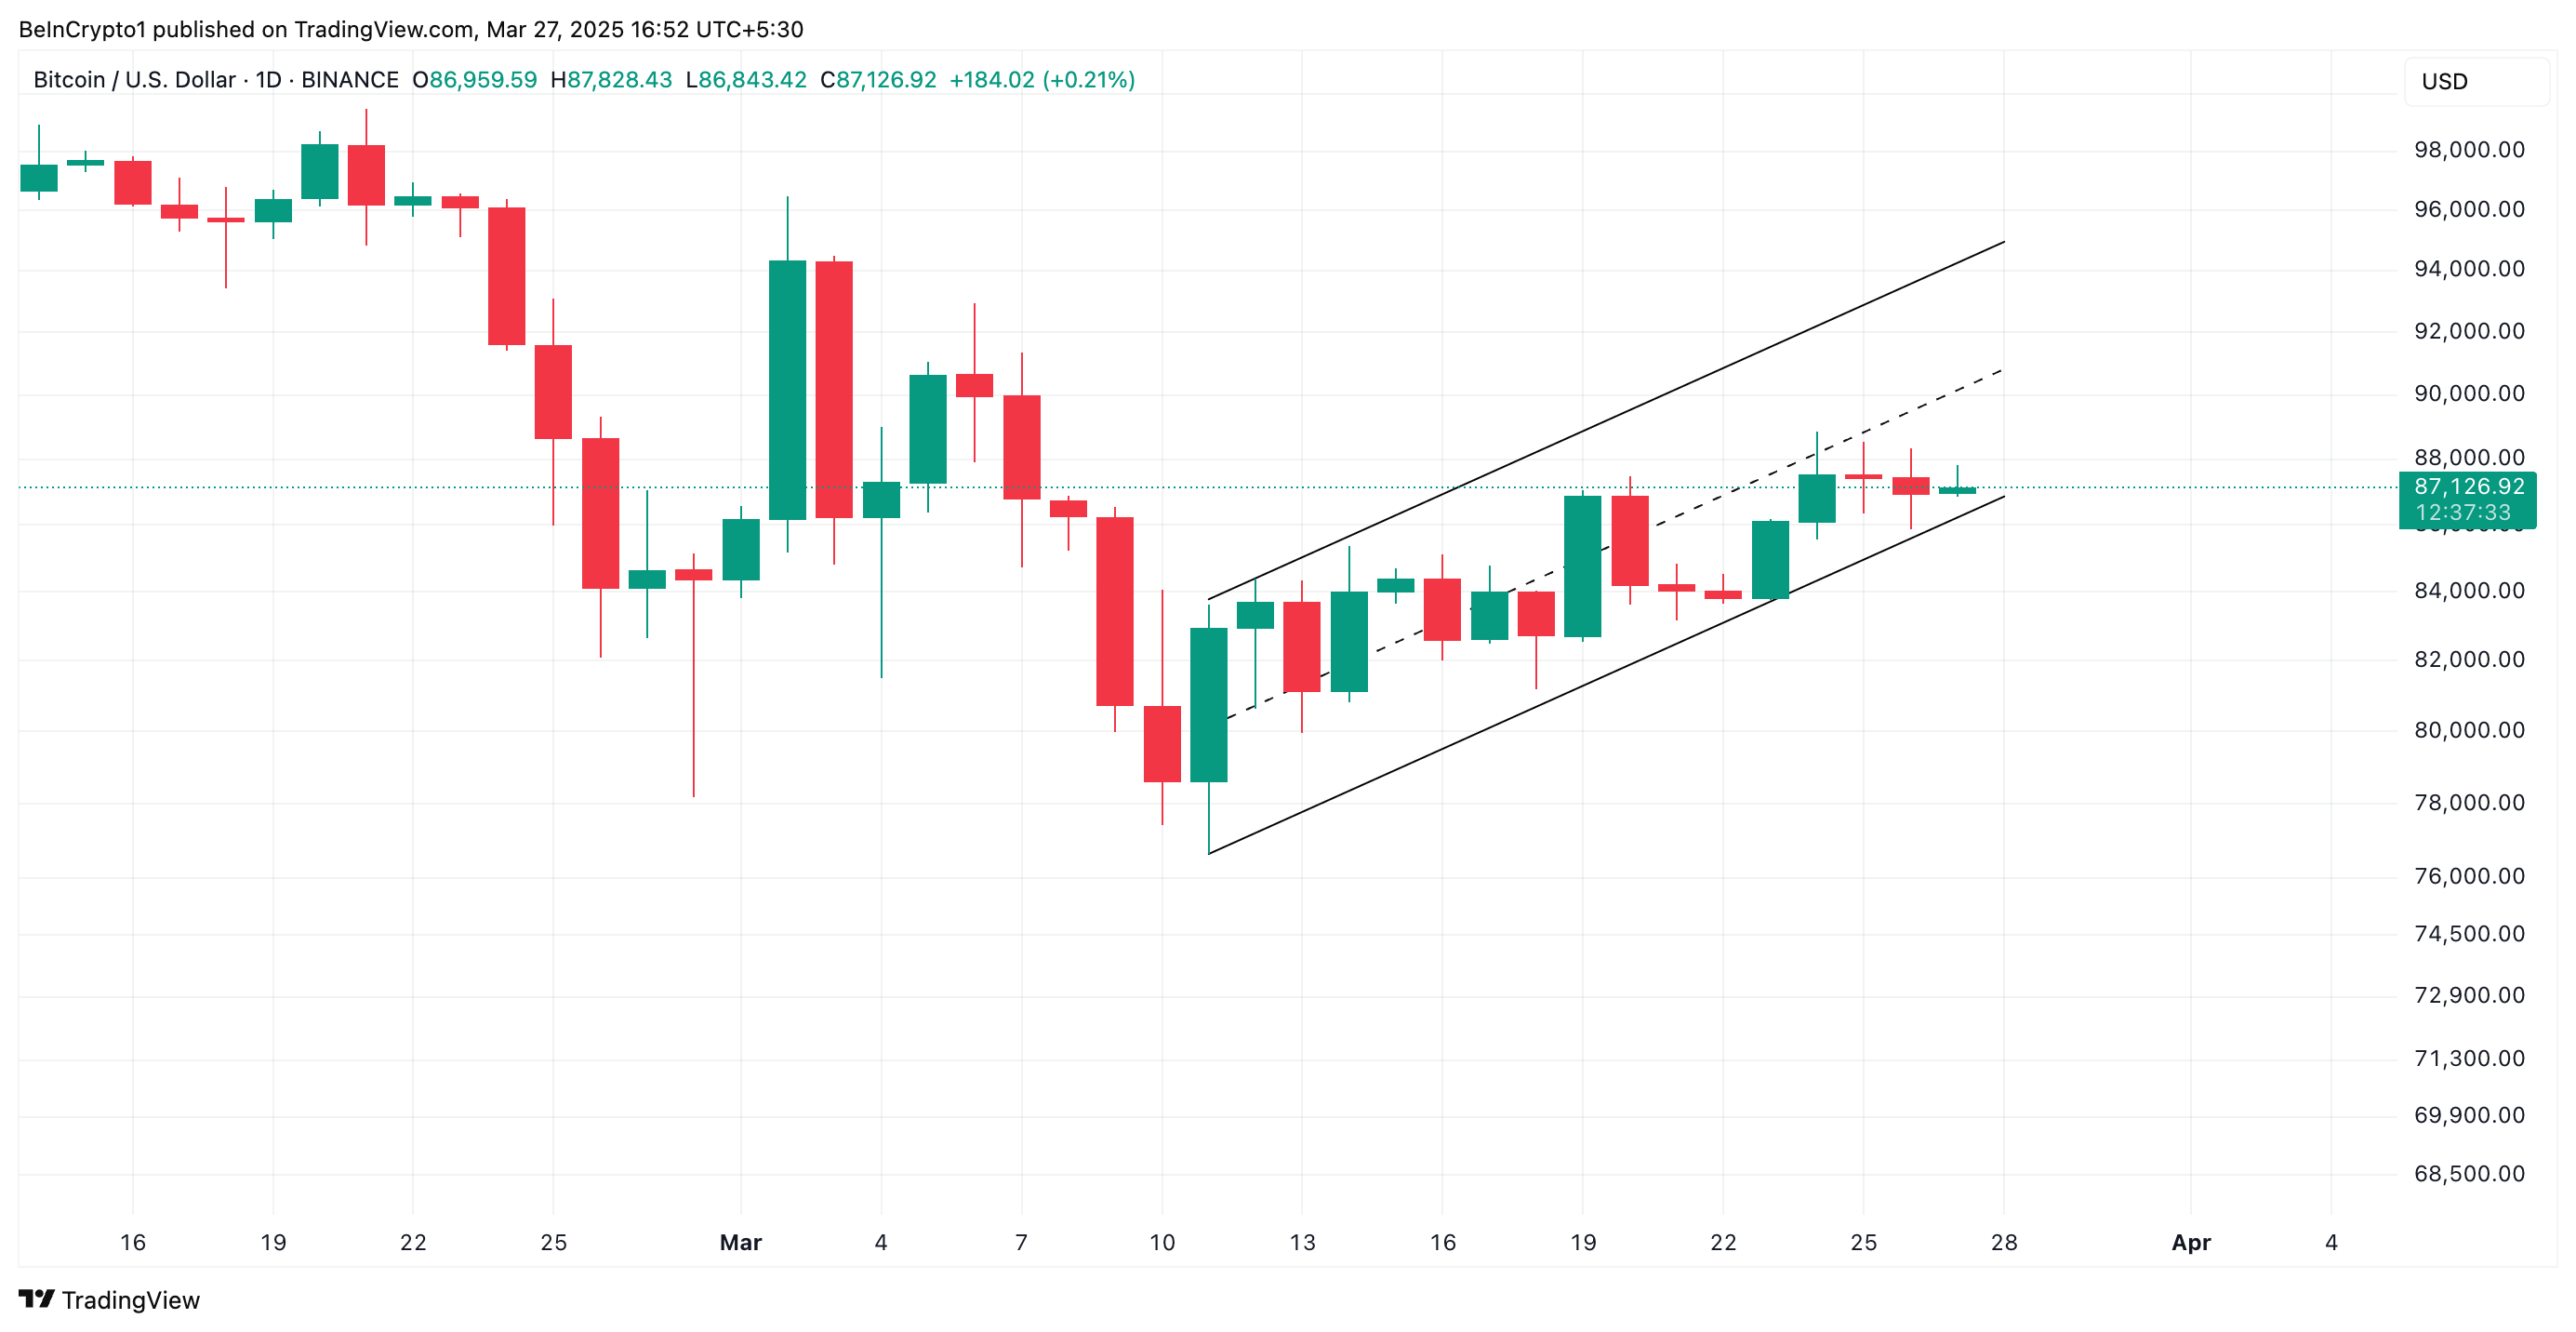
Bitcoin (BTC) kicked off March with strong bullish momentum, surging to a high of $96,484 by March 2. However, as market sentiment took a bearish turn, profit-taking intensified, dragging the leading coin down to a four-month low of $76,642 on March 11.
Since then, Bitcoin has staged a recovery fueled by a broader market rebound and renewed demand. The coin now trades within an ascending parallel channel, a pattern that signals a gradual surge in BTC’s price as buying momentum intensifies.
In an exclusive interview with BeInCrypto, Julio Moreno, Head of Research at CryptoQuant, confirmed this bullish outlook.
“There could be a bounce for the price of Bitcoin in April, as selling pressure from traders ease,” Moreno said.
Moreno assessed BTC’s Realized Profit/Loss Margin and found that it has declined steadily since the beginning of the year. When this metric falls, the overall profitability of BTC coins being spent on-chain is declining.
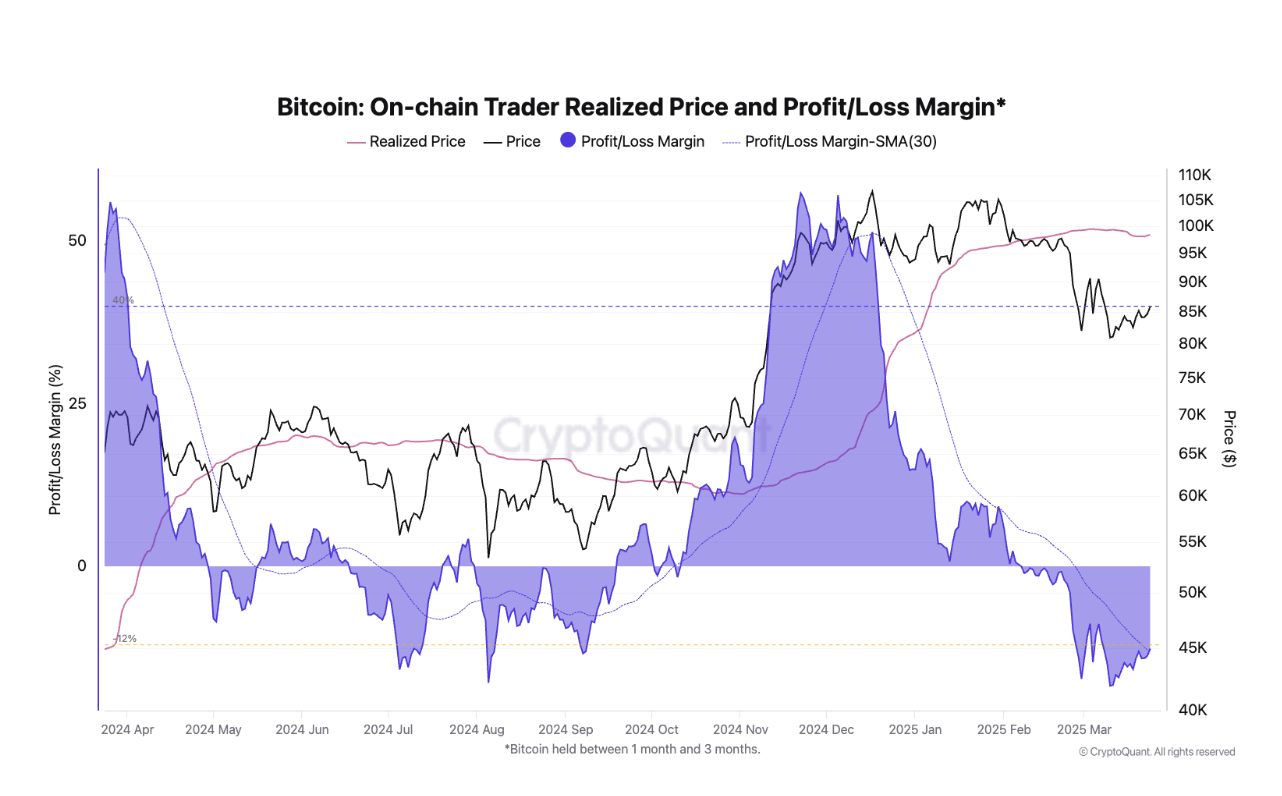
This means investors are realizing fewer profits or even taking losses, reducing their incentive to sell. Over time, this trend would gradually ease selling pressure in the BTC market, and drive up its price in coming weeks.
“As the price of Bitcoin has experienced a 23% drawdown since its previous all-time high, traders will now only experience losses if they sell. This situation typically indicates less selling pressure for Bitcoin. Indeed, the trader’s on-chain unrealized profit margin stands today at -13%, a level typically associated with local price bottoms. This could easily get prices towards the $90k zone,” Moreno added.
Selling Pressure Could Spike as Sentiment Worsens
Notably, as the market attempts to recover, bearish sentiment remains significant among traders.
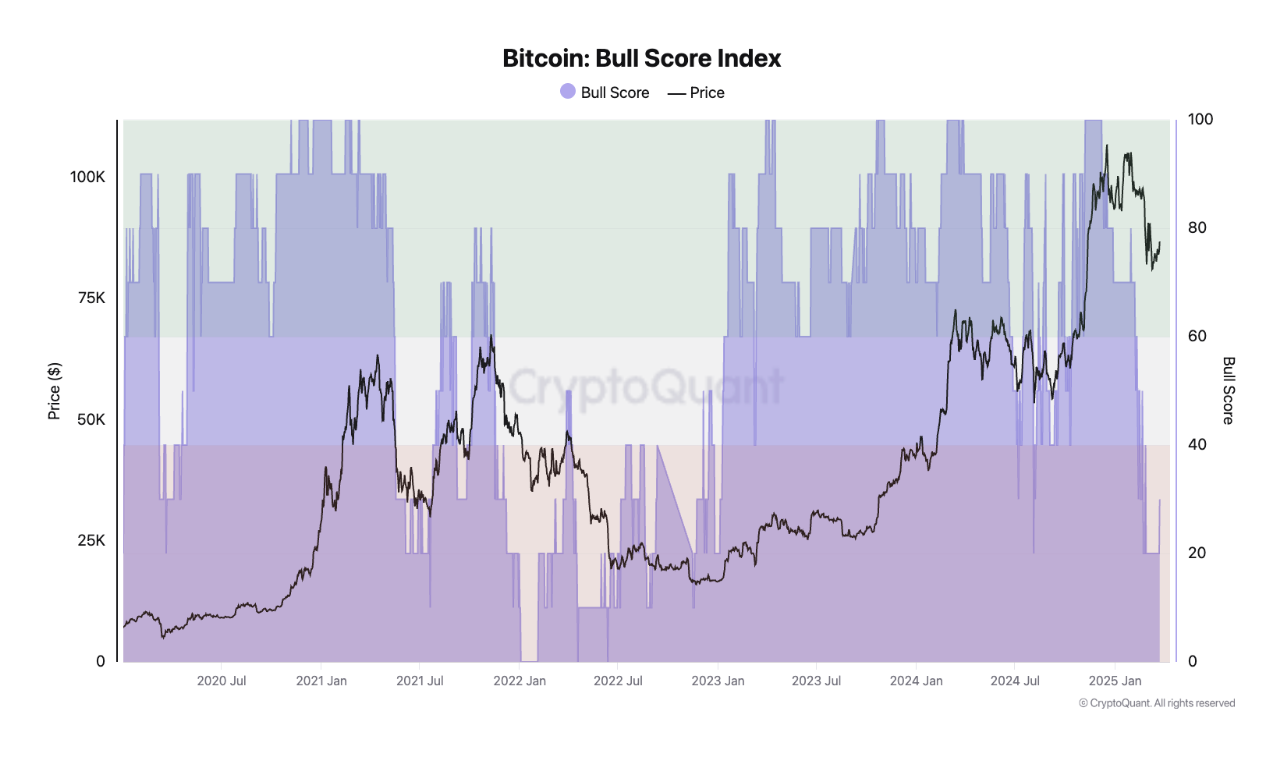
“Overall market sentiment remains bearish, as seen in CryptoQuant’s Bull Score Index. The index touched 20 a few days ago—the lowest since January 2023—indicating weak market conditions. This raises concerns that the recent price drawdown could be part of a broader bearish trend rather than a short-term correction,” Moreno explained.
He also added that historically, Bitcoin has only experienced sustained price rallies when the Bull Score is above 60, while readings consistently below 40 have been associated with bear markets.
Readings from the Crypto Fear and Greed Index reflect this outlook. At press time, the index is at 40, suggesting that the market is currently in fear.
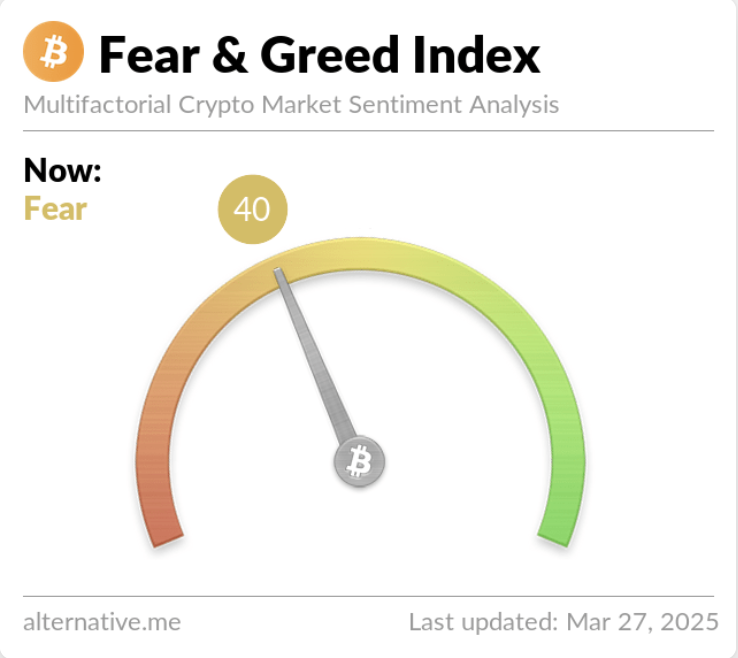
When traders are fearful like this, it leads to increased selling pressure, lower BTC trading volumes, and trigger price declines.
Will Bitcoin Hold Above $87,000 or Drop to $77,000?
BTC trades at $87,208 at press time, climbing 2% in the past week. On the BTC/USD one-day chart, the coin’s Relative Strength Index (RSI) rests slightly atop the neutral line at 51.48, indicating the gradual resurgence in new demand for king coin.
The RSI indicator measures an asset’s overbought and oversold market conditions. It ranges between 0 and 100. Values above 70 suggest that the asset is overbought and due for a price decline, while values under 30 indicate that the asset is oversold and may witness a rebound.
At 51.48 and in a slight uptrend, BTC’s RSI suggests growing bullish momentum in the market. If demand strengthens, it could propel the coin’s price to $89,434. A successful breach of this resistance could trigger a rally toward $93,478.
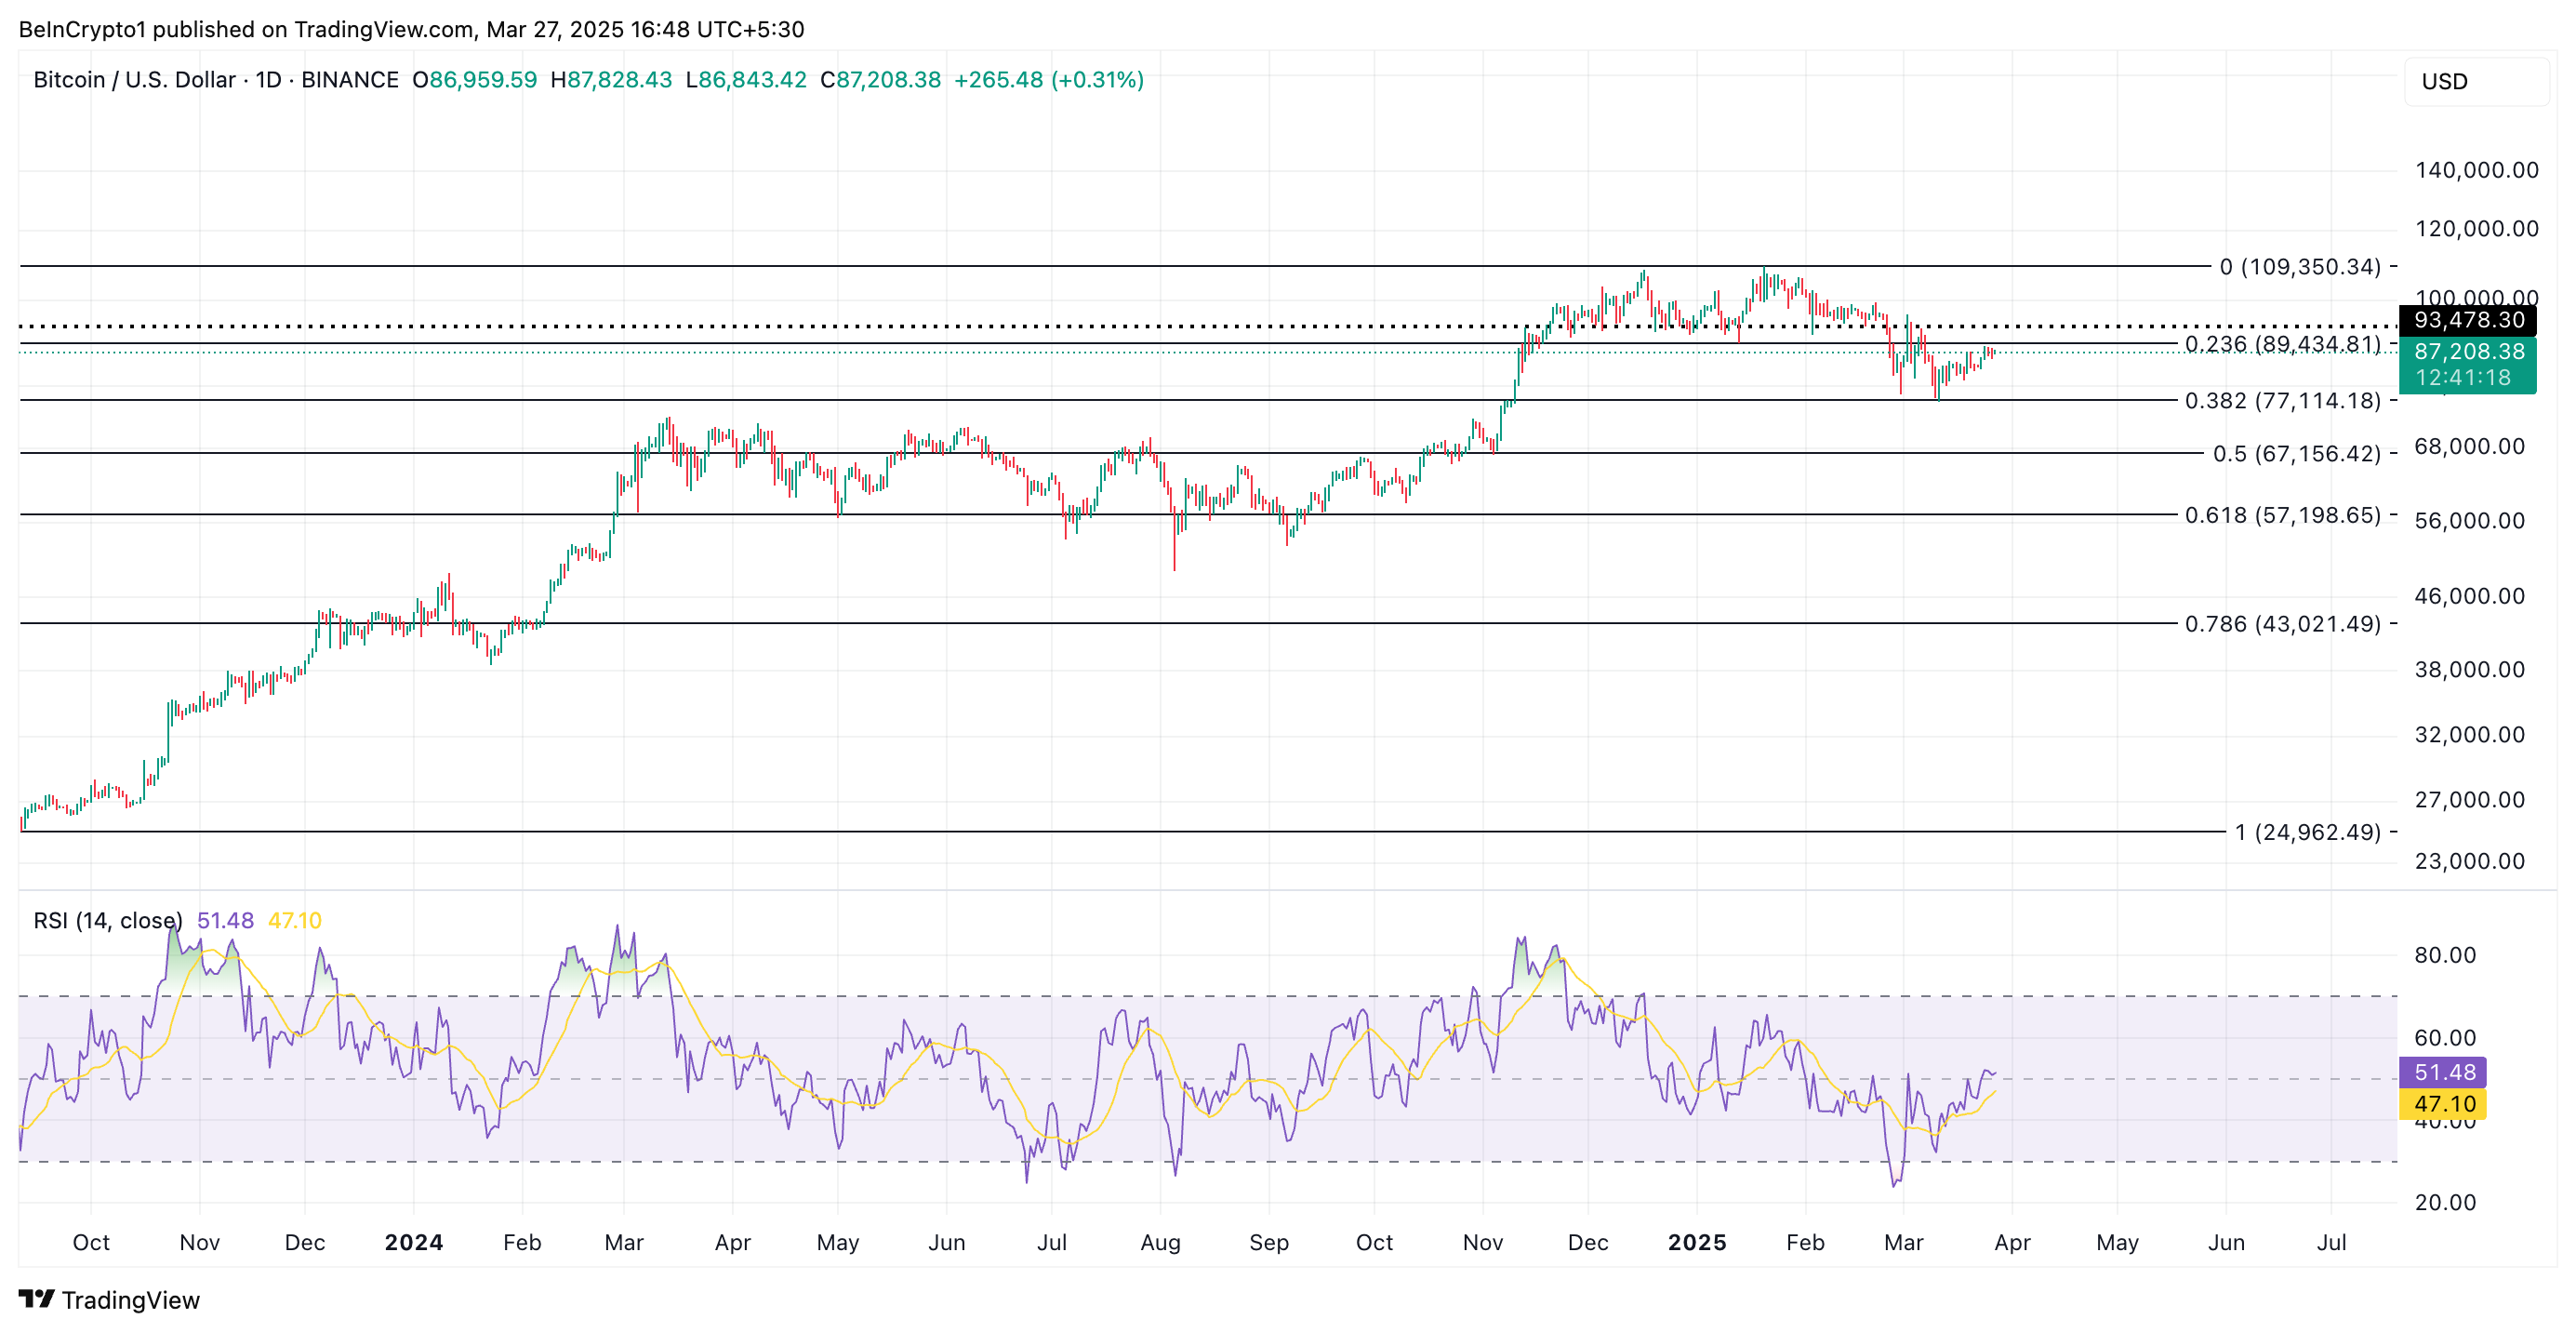
However, if selloffs resume, BTC’s price could drop to $77,114.
