
A look at on-chain indicators for Bitcoin (BTC), more specifically Average Spent Output Lifespan (ASOL) and Dormancy in order to determine the age of coins that are currently being moved in the market.
Both indicators show signs that older coins have begun to change hands. This has previously occurred during relief rallies and bounces.
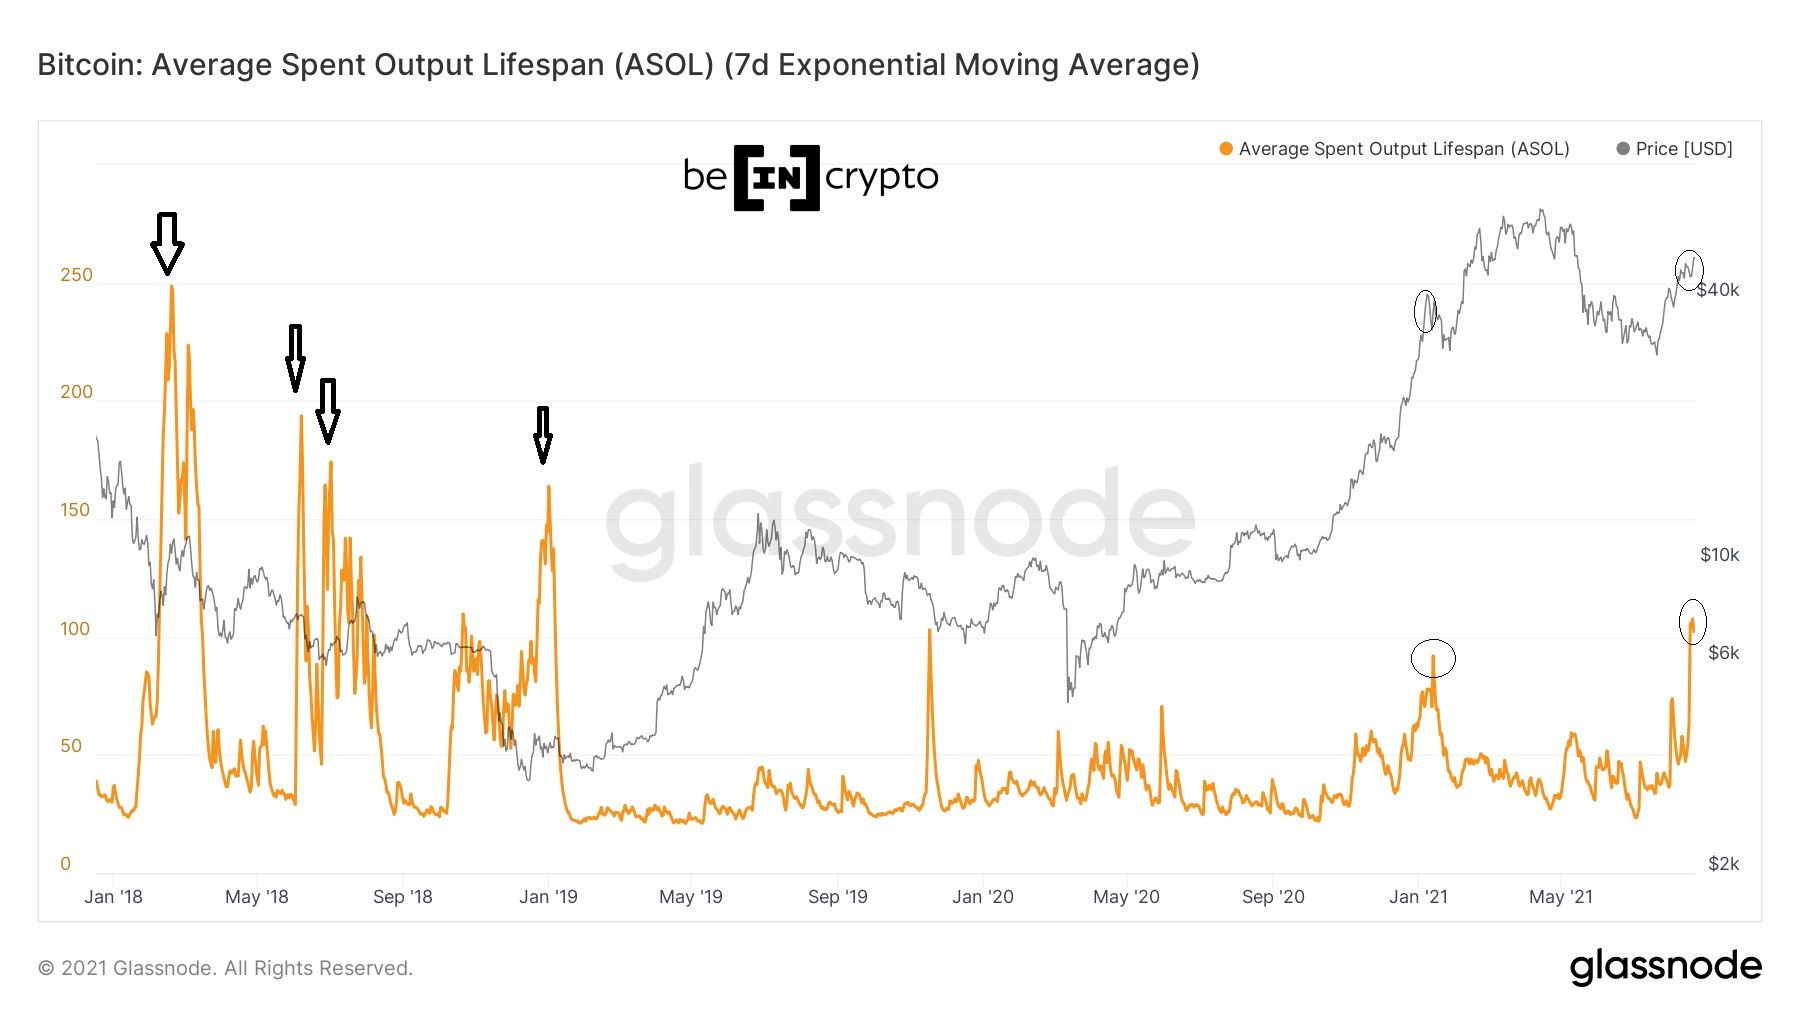
ASOL
ASOL measures the average age of each spent transaction output while disregarding volume. This means that a 1 BTC and a 100 BTC transaction that were previously dormant for the same number of days would have the same ASOL reading. This differentiates it with CDD, which includes volume.
Nevertheless, a high ASOL reading usually means that a higher percentage of transactions in the network are old coins.
The indicator often spikes during bounces. This was especially visible in 2018, when it spiked numerous times while BTC was dropping towards the Dec. 2018 bottom.
In the ongoing bull-run, it reached a then yearly high of 92 on Jan. 13, 2021. At the time, BTC was trading close to $37,000, having bounced after the initial drop that succeeded the then all-time high of $40,771.
Interestingly, ASOL has spiked once more during the current bounce, which has been ongoing since $30,000. On Aug. 19, it reached a new yearly high of 107.
Judging by previous history, it is possible that the bounce is a relief rally prior to another drop.
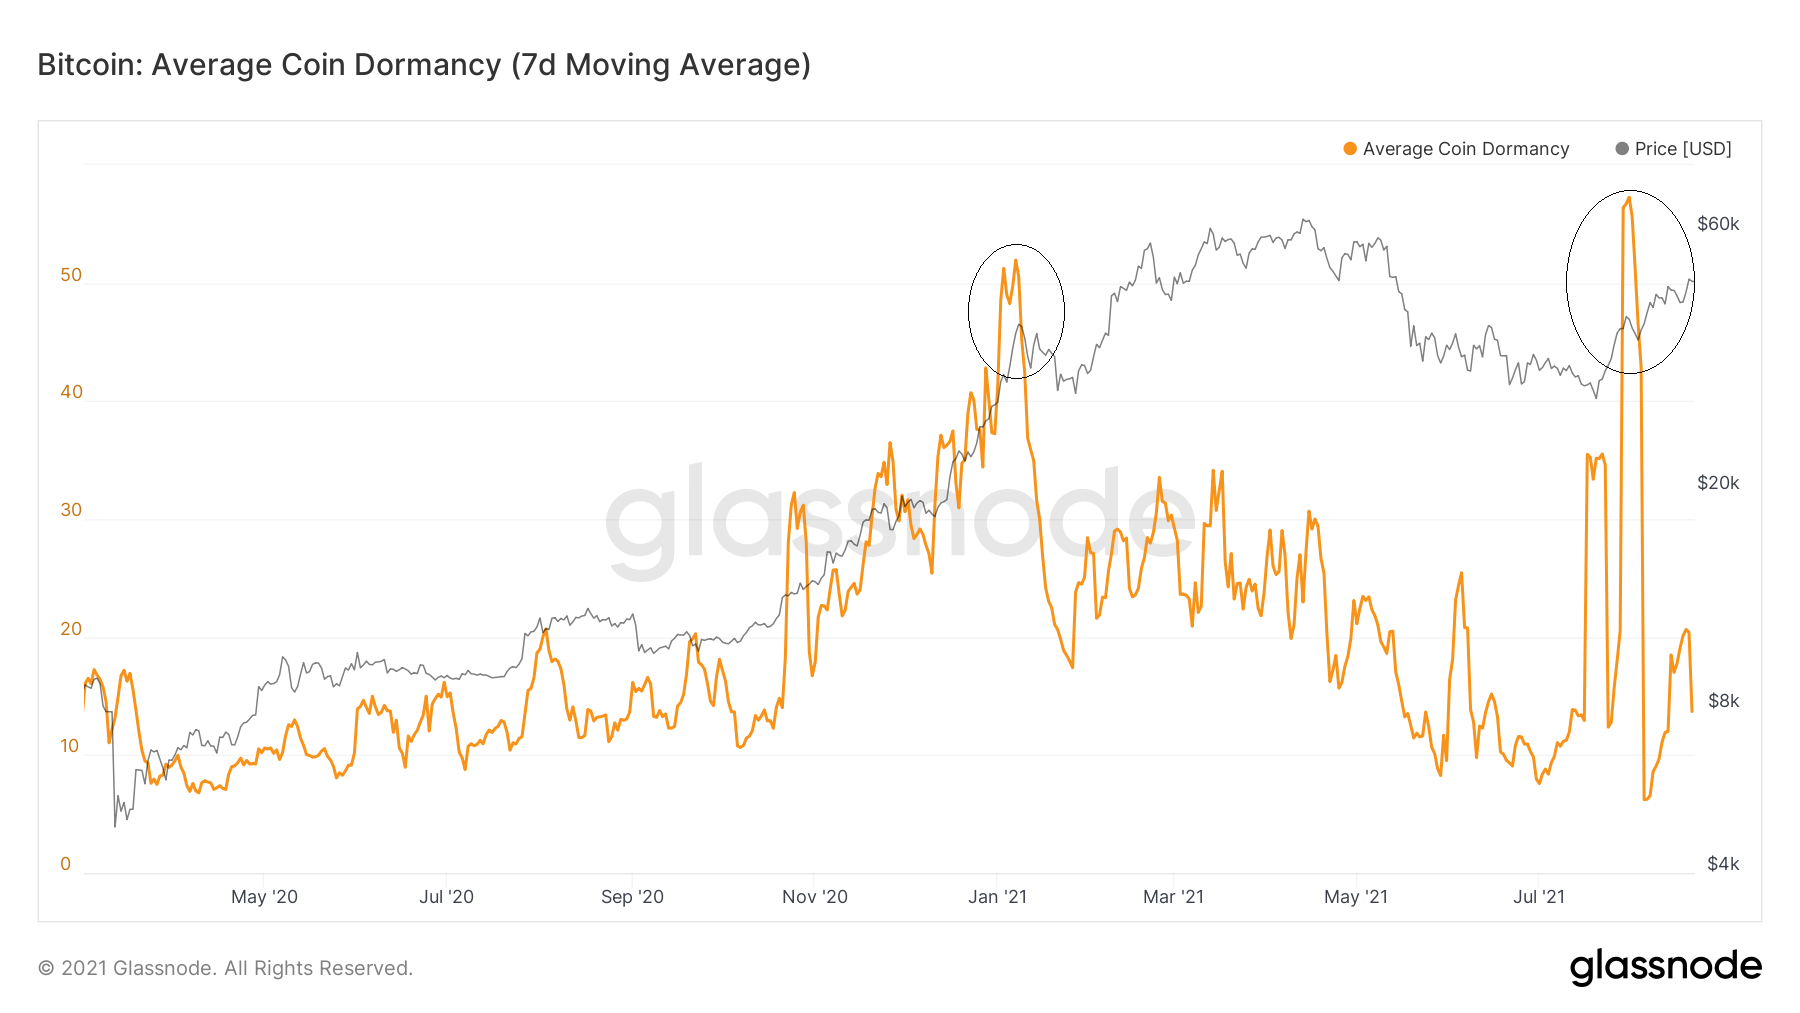
Dormancy
In summary, dormancy is the average number of days destroyed per coin transacted in any given day, as per the following formula: Dormancy = Coin Days Destroyed/ Coins Transacted
Similarly to ASOL, Dormancy reached a yearly high of 51.94 on Jan. 7, when BTC was trading at $39,200.
After the ensuing price and indicator drop, Dormancy spiked once more on July 31, reaching a new yearly high of 57.84. In comparison to ASOL, both spikes occurred slightly prior. Therefore, ASOL seems to be lagging Dormancy, while both are giving similar readings.
For BeInCrypto’s latest Bitcoin (BTC) analysis, click here.
