
A look at on-chain indicators, more specifically Market Value to Realized Value Ratio (MVRV) in order to attempt and determine the direction of the next move.
The current indicator value has historically acted as a floor and has been the catalyst for upward movements in the price of Bitcoin (BTC).
Historical MVRV tops
The MVRV value is the ratio between the market and realized capitalization levels. Simply put, a MVRV value of 2 means that the market cap is twice as large as the realized cap.
The indicator has reached five tops so far, which are denoted by the black arrows.
- June 2011 – 6.92
- April 2013 – 5.25
- November 2013 – 5.71
- December 2017 – 4.33
- February 2021 – 3.95
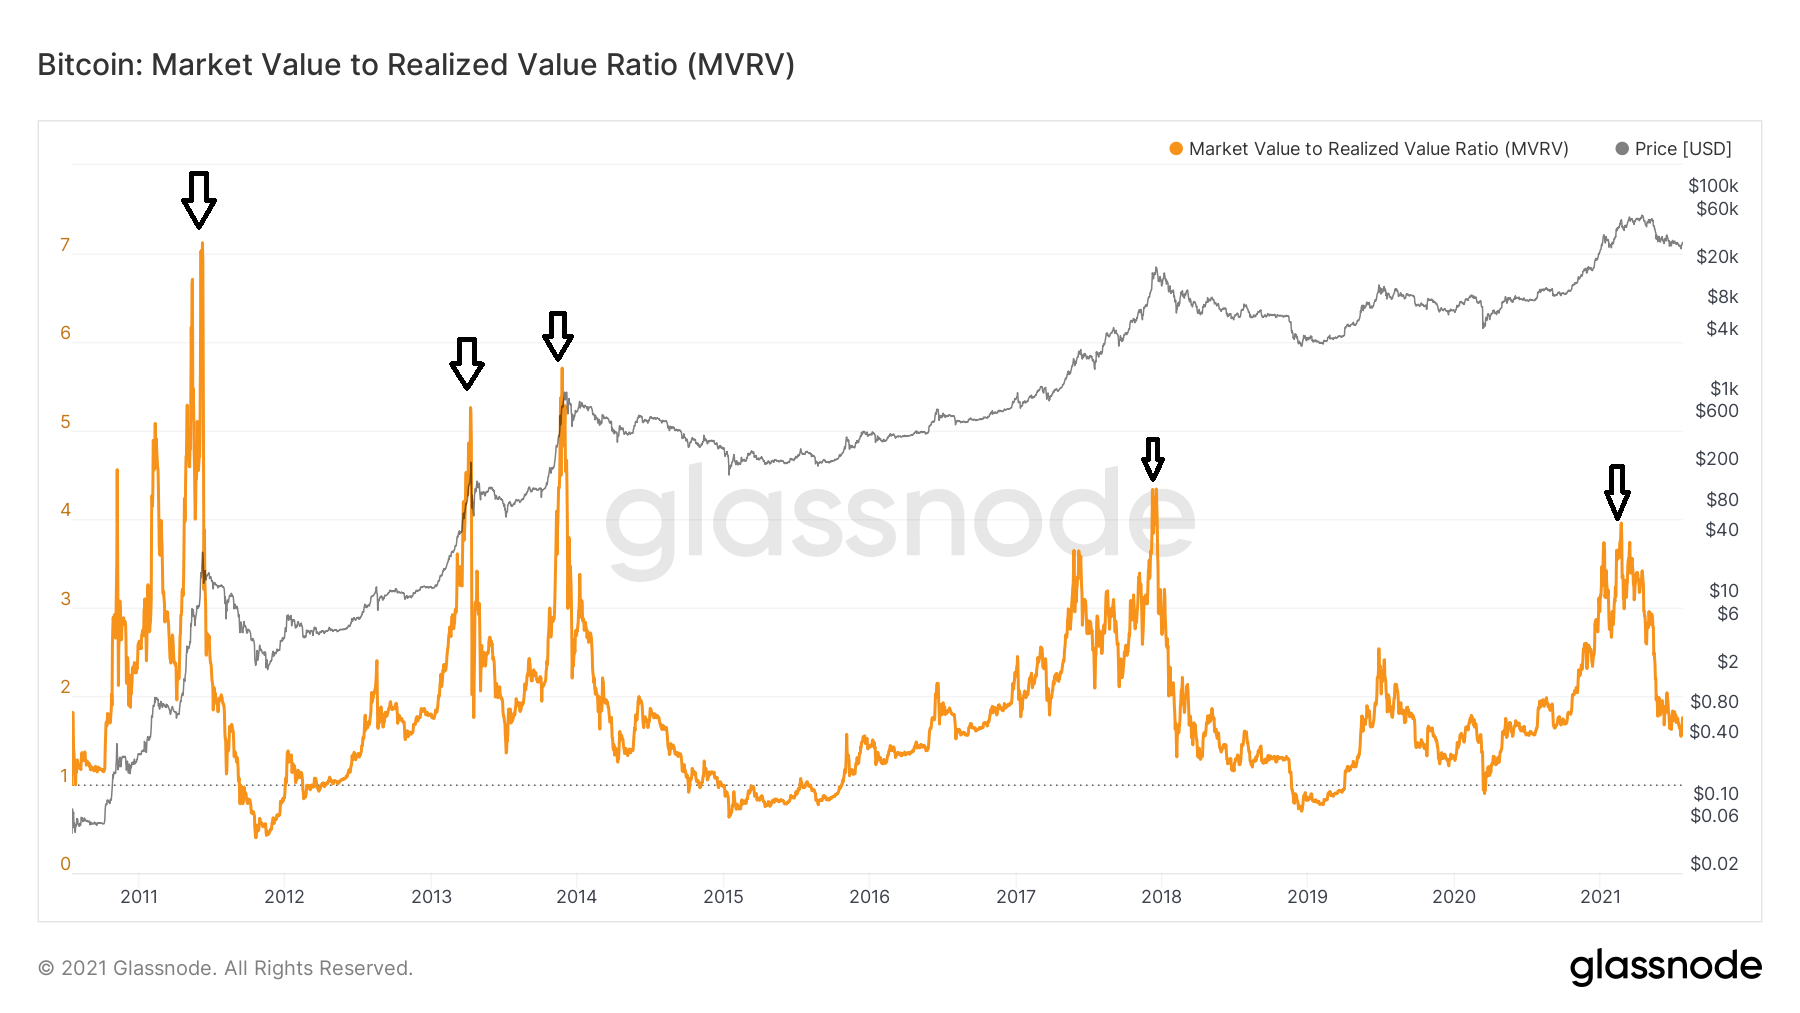
Therefore, the 2021 top has had the lowest value of the five. It is possible that both the price and indicator will eventually create higher highs, similarly to what they did in 2013.
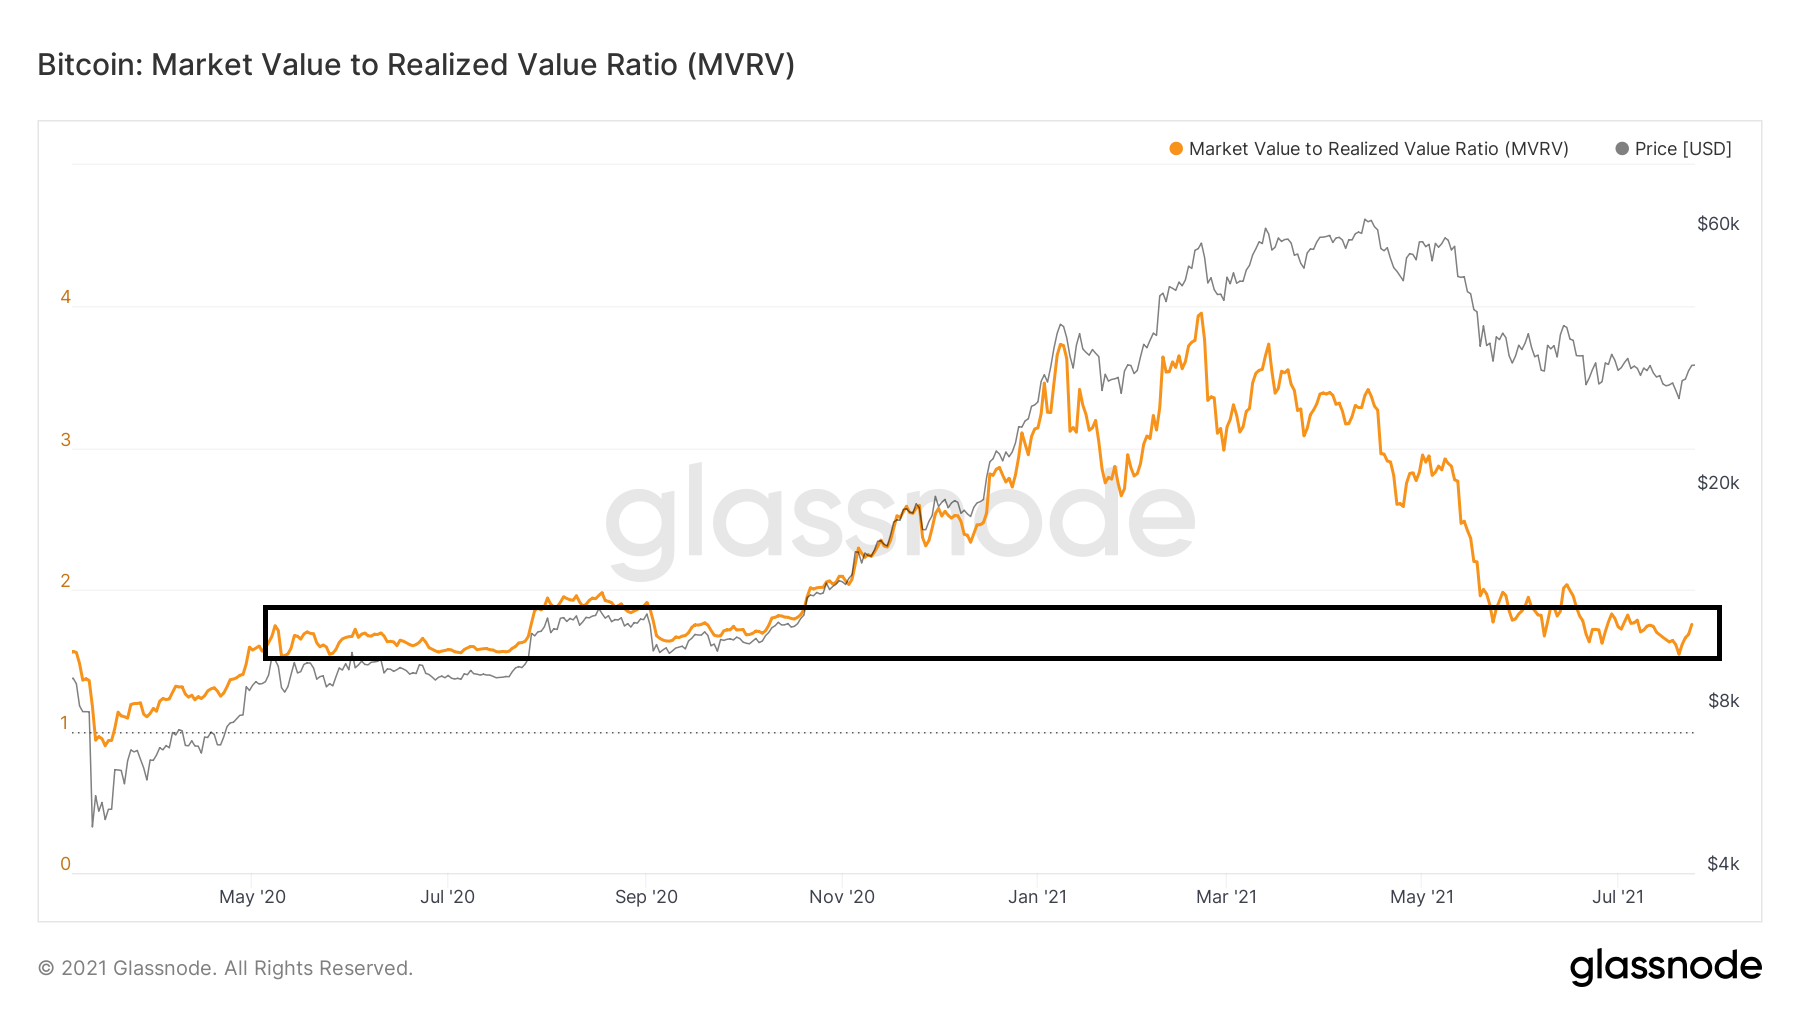
Current reading
The current MVRV value is 1.75. The level has not been reached since before the bull run began, more specifically in Sept. 2020.
If we were to treat the MVRV chart as a regular price chart, the 1.5-1.6 area would be expected to act as support, since it was the catalyst for the entire upward movement that eventually led to the all-time high.
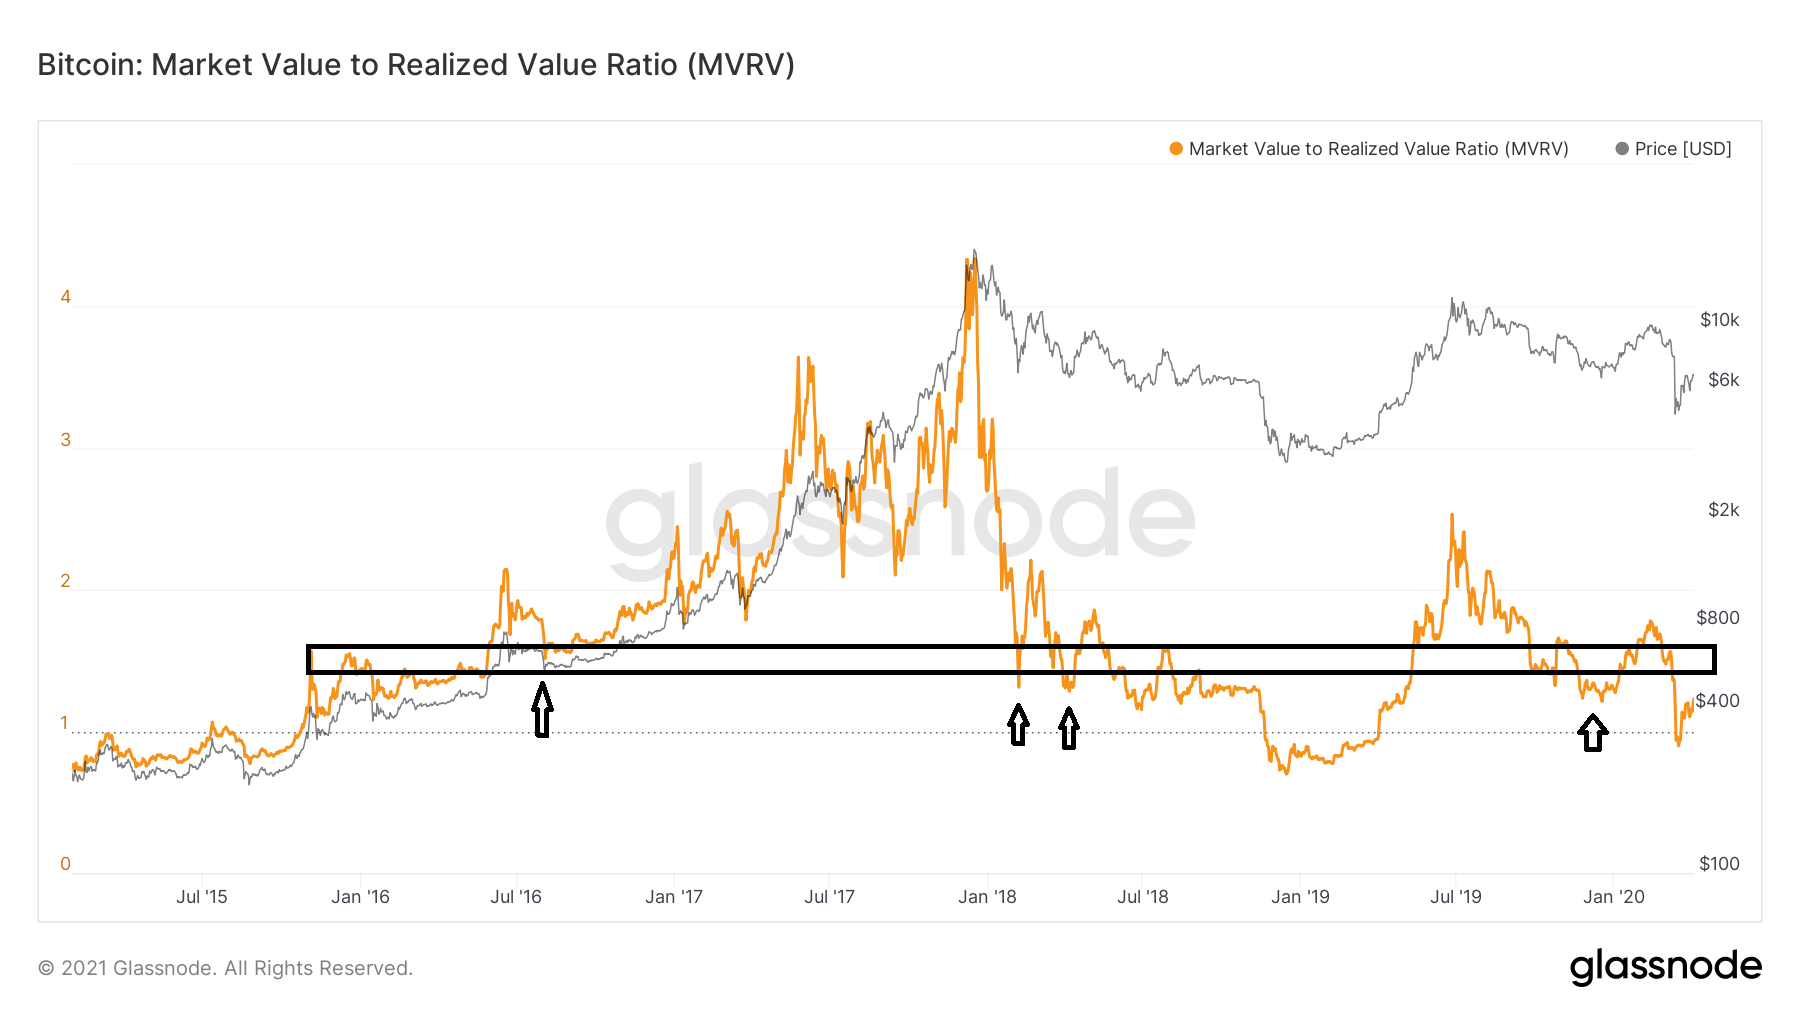
Historically, the 1.5- 1.6 area has been a satisfactory gauge for the direction of the trend. Values above it have shown a bullish trend, while those below it a bearish one.
In addition to this, the area has caused numerous bounces while acting as support.
MVRV first broke out above this area on Sept. 2016. Afterwards, it returned and validated it as support the next month (black arrow) and continued staying above until reaching the Dec. 2017 previous all-time high.
In 2018, a decrease below this area confirm that the trend is bearish, while MVRV bounced shortly after deviating below the area in 2020.
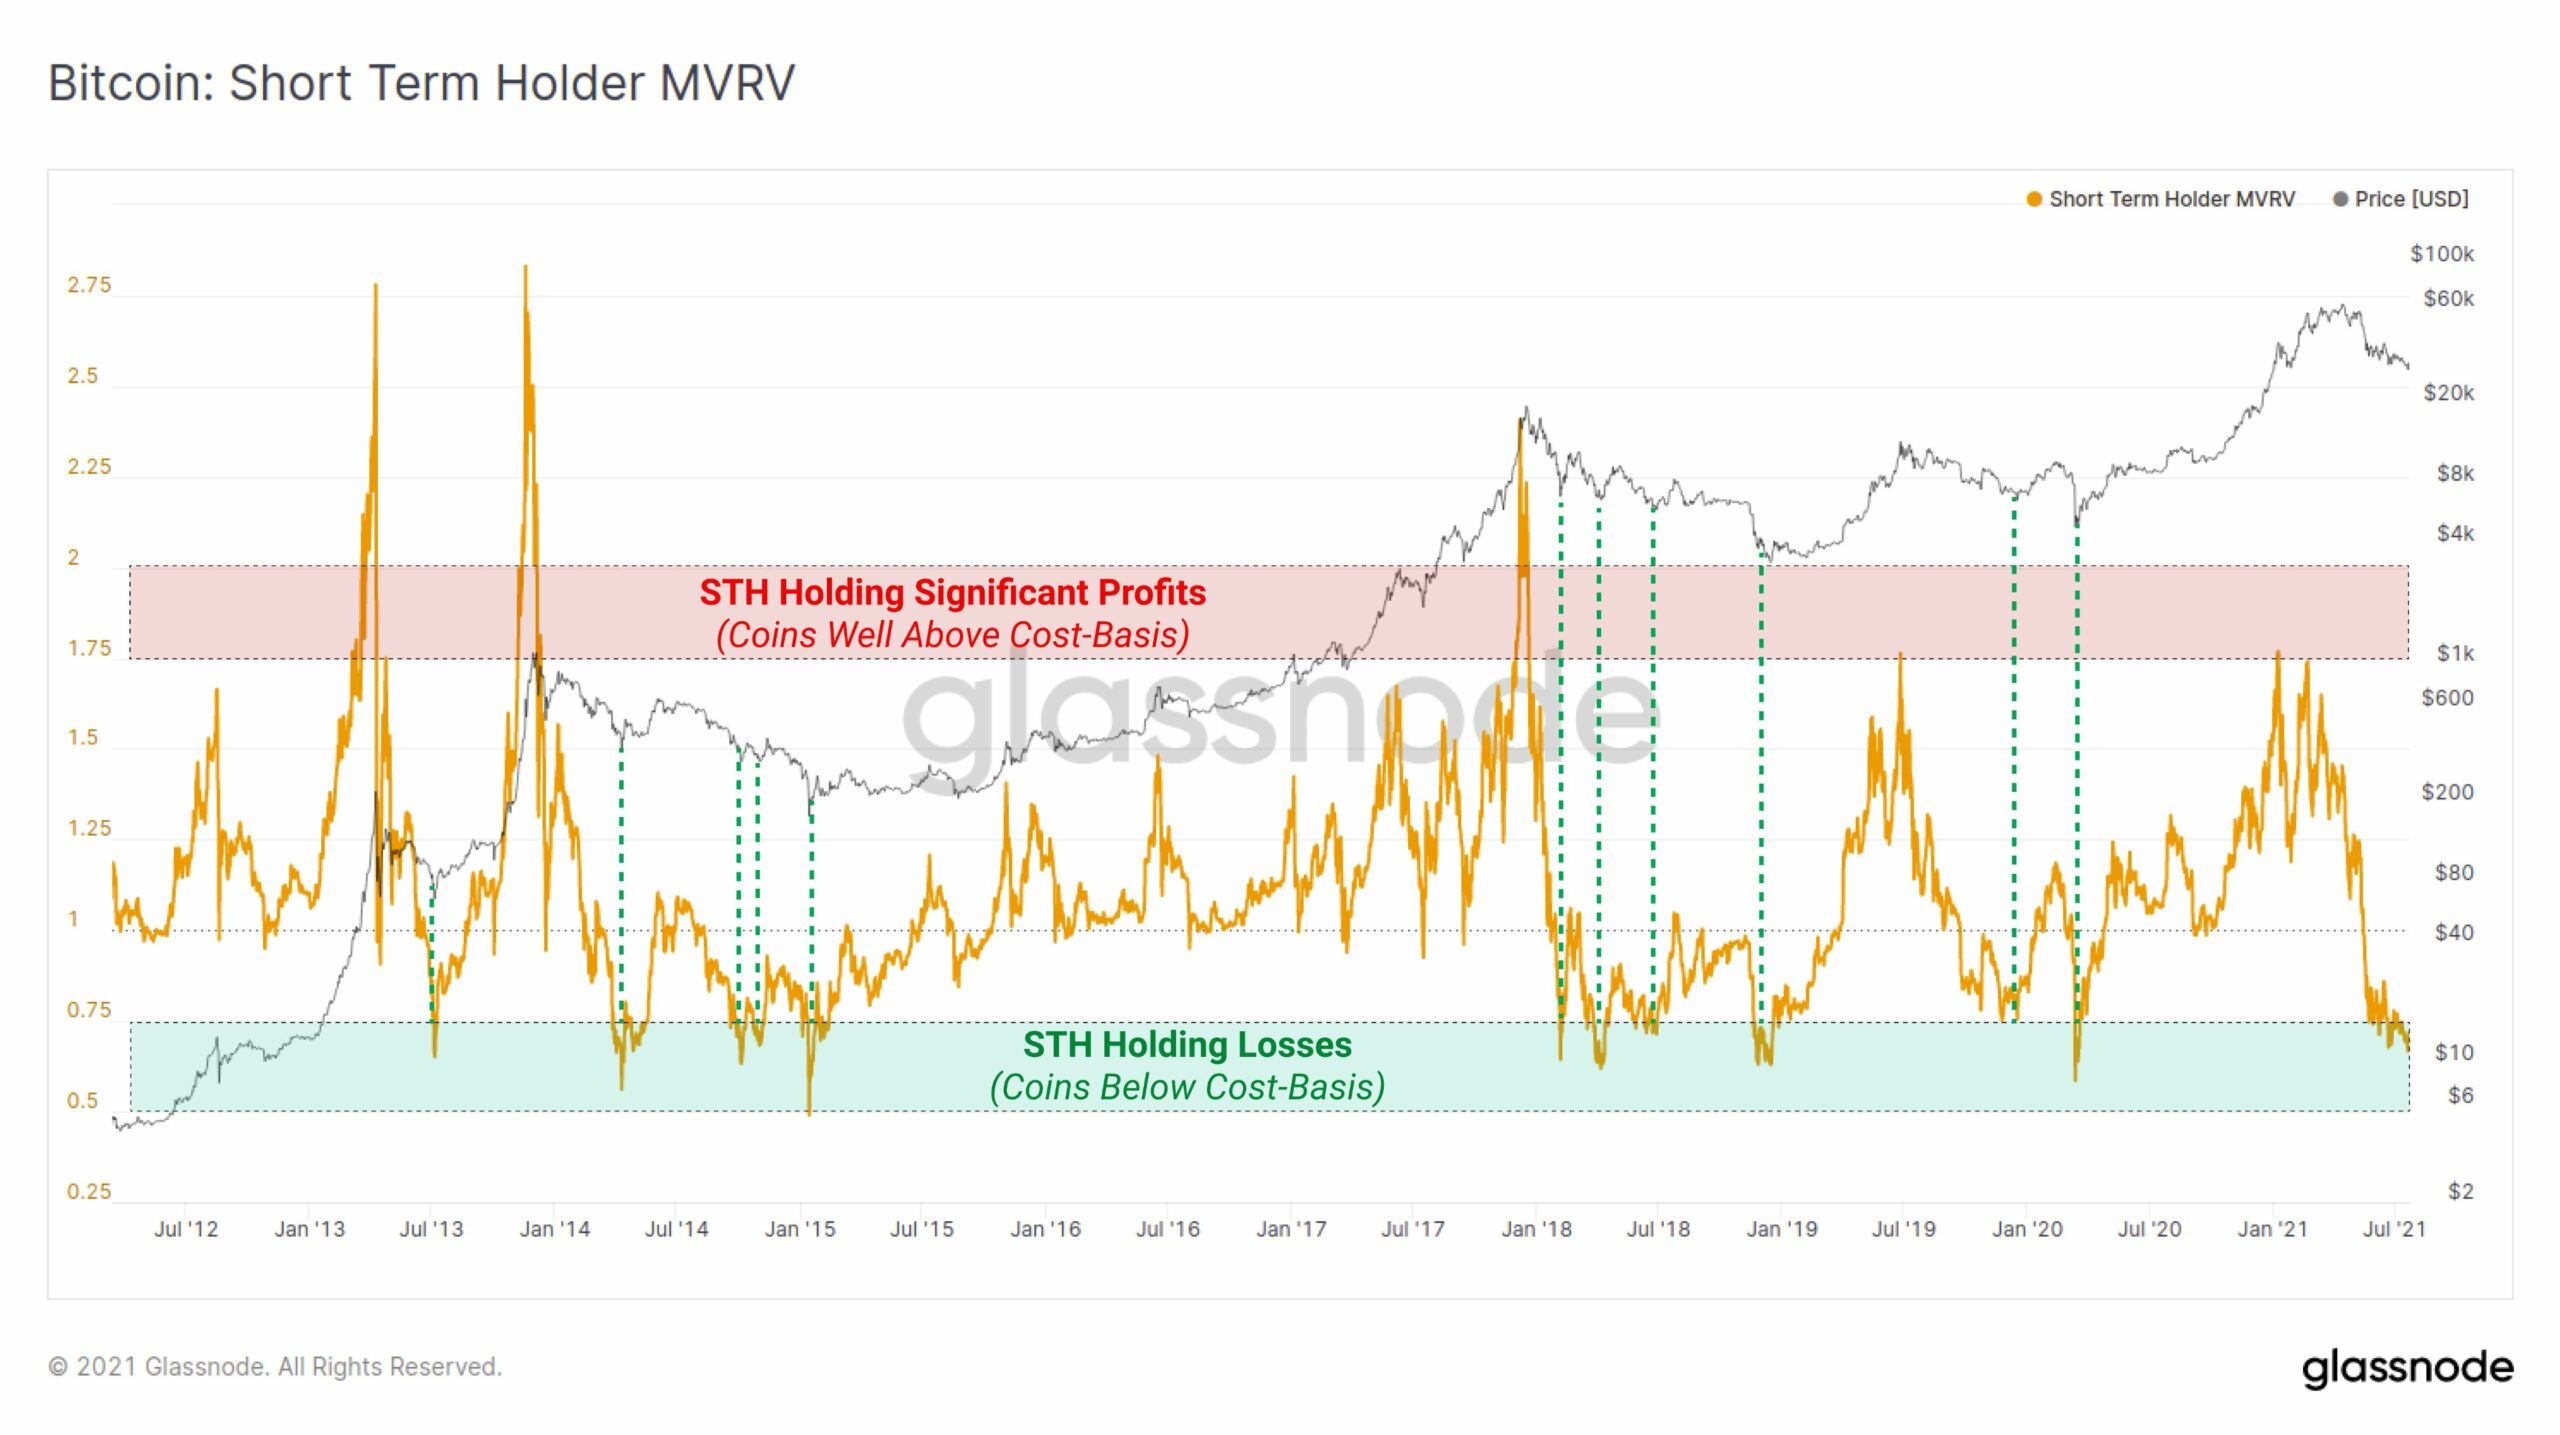
Short-term MVRV
The short-term holder MVRV has fallen below 0.75. This means that the market cap is lower than the realized cap, meaning that participants are already holding at a significant loss.
Such values have been historically associated with bottoms.
Considering that the regular MVRV is at a spot that has historically initiated bounces, the capitulation in short-term holders furthermore solidifies the possibility of a bounce.
For BeInCrypto’s latest bitcoin (BTC) analysis, click here.
