


A look at on-chain indicators, more specifically the Stablecoin Supply Ratio (SSR) in order to determine the health of the market for bitcoin (BTC).
Despite the ongoing increase in the price of BTC, SSR has fallen considerably. This indicates that stablecoins have significant buying power.
SSR definition
SSR is defined as the ratio between the supply of BTC and that of stablecoins. As a result, it can be used to measure the supply and/or demand of BTC and USD.
It moves by a change in one of these two facts:
- A change in the bitcoin price.
- A change in the stablecoin supply.
A low value means that stablecoins have a high buying power over BTC. For example, a value of 50 indicates that stablecoins can buy 2% (1/50) of the BTC supply. A value of 10 would mean that stablecoins can buy 10% of the supply (1/10).
On the other hand, a high value suggests that stablecoins have low buying power. This means that it would be difficult to cause a significant change in the price of the asset.
Bitcoin’s SSR
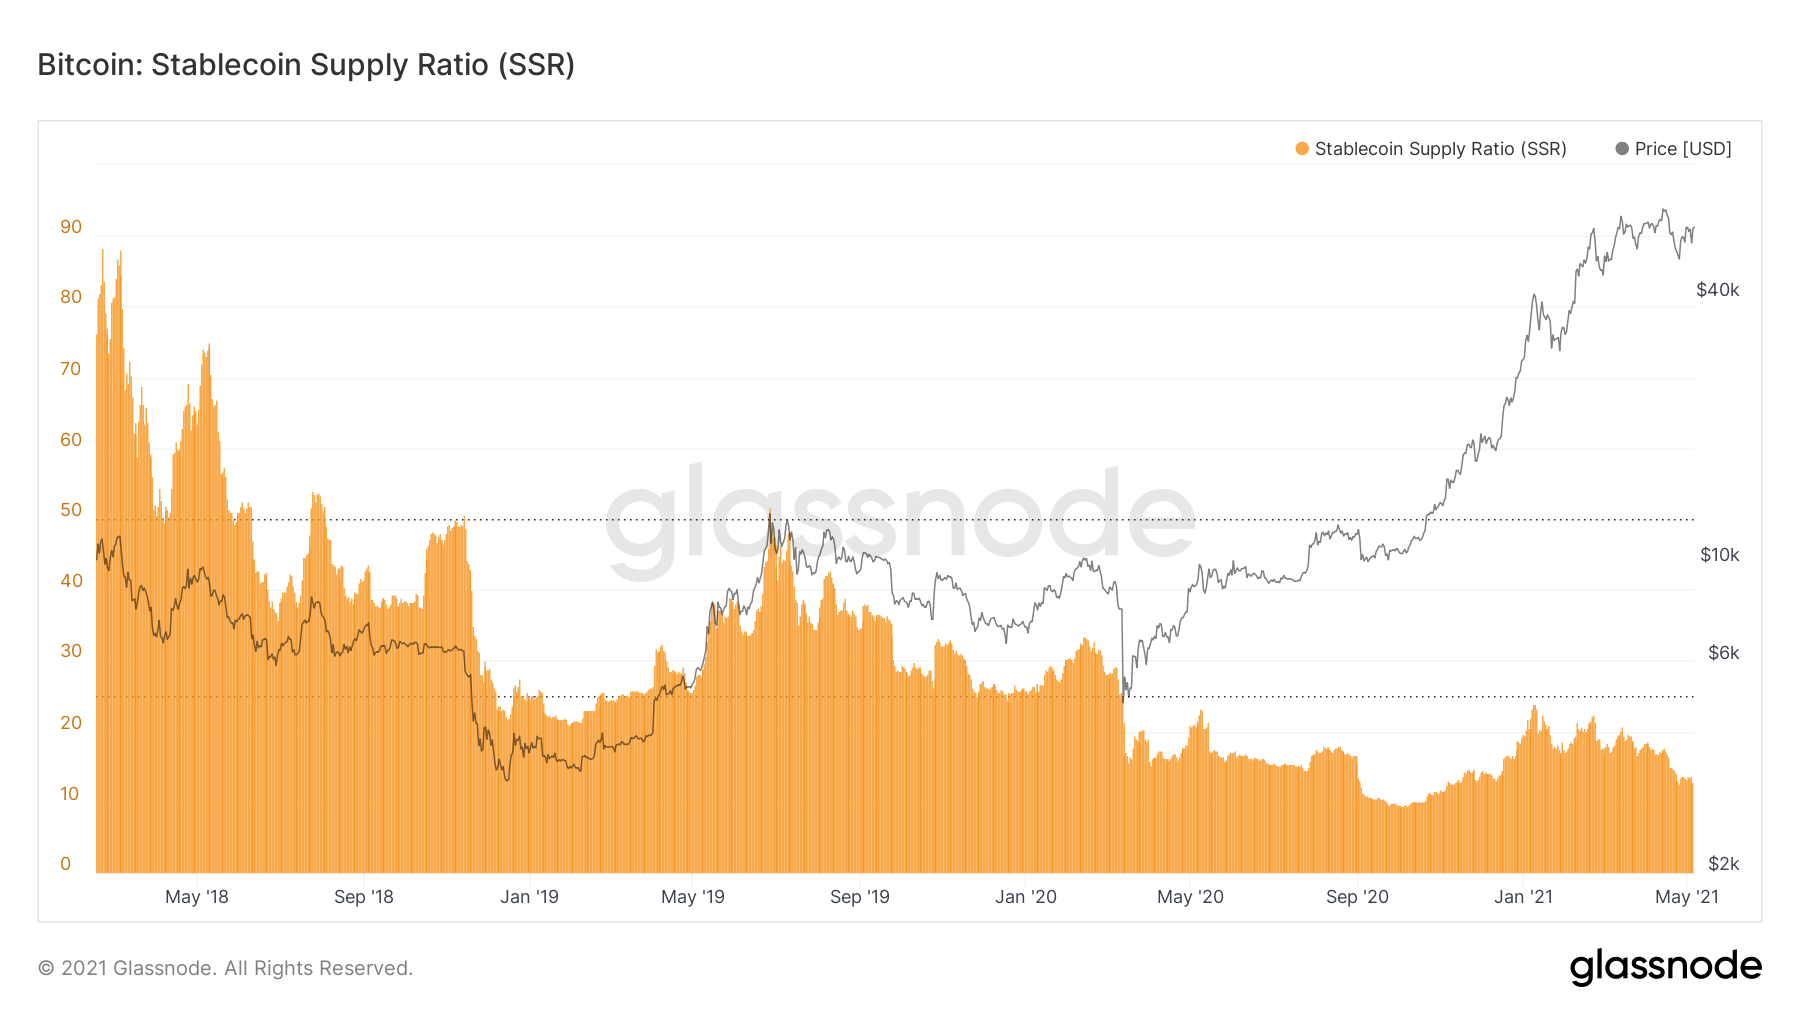
Data for SSR only goes back to March 2018. In the period from March to October 2018, SSR was hovering between 50 and 80. As stated above, this means that it would be hard to push the BTC price upwards.
However, SSR fell to 25 during the December 2018 bottom. This is to be expected, since even if the supply of stablecoins remained constant, the decrease in the price of BTC would cause it to increase.
After another SSR increase while the BTC price moved upwards, the indicator fell to 20 once more on March 20.
Since then, an interesting development is the fact that SSR has been decreasing constantly, despite the increase in the BTC price. In September 2020, it reached an all-time low of 9.55.
Normally, we would expect that an increase in the price of BTC would indicate that stablecoins have less purchasing power. However, in order to compensate for this, new fiat money has entered the market and the supply of stablecoins has increased.
Therefore, despite the considerable increase in the price of BTC, the low SSR value suggests that it is still relatively easy to push the price up. Conversely, it was much harder to do so in April 2018, despite the BTC price being at around $8,000.
The following stablecoins are used for calculating the SSR: USDT, USDC, TUSD, GUSD, PAX, SAI, DAI, and BUSD.
For BeInCrypto’s latest bitcoin (BTC) analysis, click here.


