


A look at on-chain indicators for Bitcoin (BTC), more specifically Coin Days Destroyed (CDD), in order to determine the age of coins that are currently being sold in the market.
CDD has fallen to a new yearly low, suggesting that mostly new coins are being sold in the market. Short-term holders are incurring very significant losses.
Coin days destroyed
CDD is an indicator that measures the amount of days a coin is unspent prior to a transaction. A “coin day” is accumulated on every day that the coin is unspent. After the transaction, these coins are destroyed.
The CDD value is the total coin days that are destroyed in a specified day. The supply-adjusted CDD divides the value by the circulating supply, in order to provide a more accurate reading.
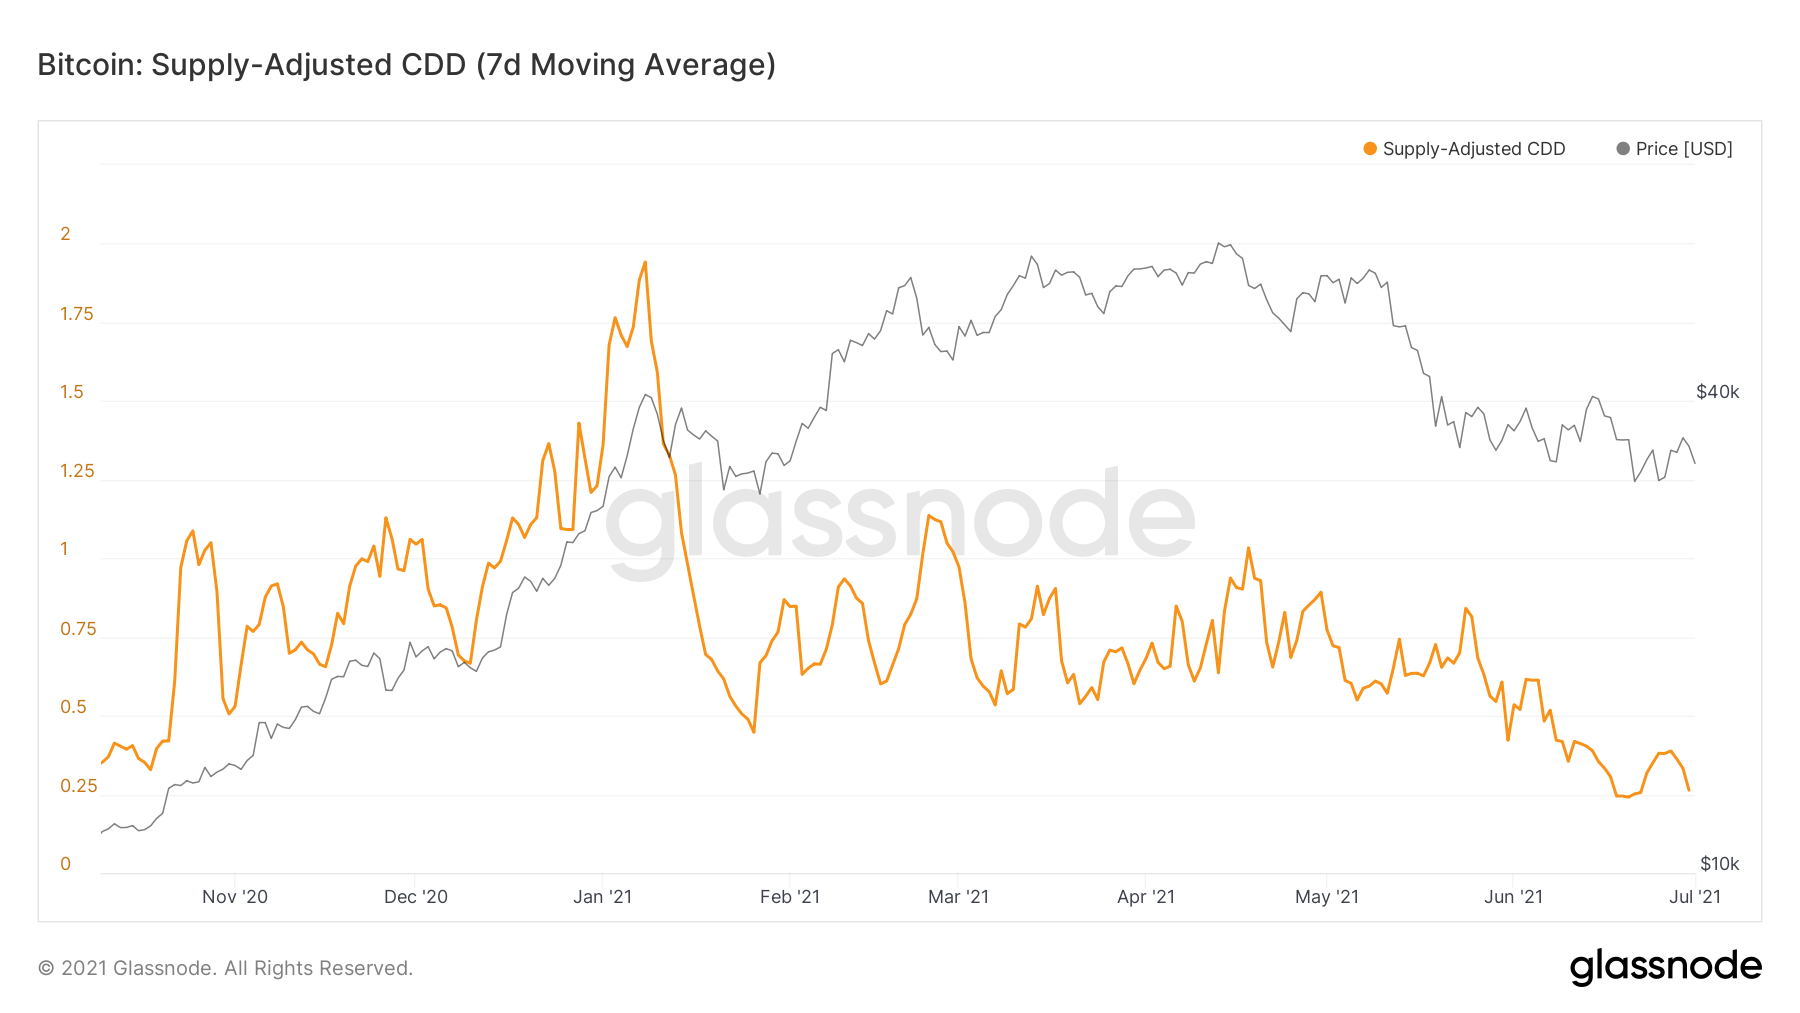
It has been consistently decreasing since Jan. 8, when it reached a high of 1.98. It hovered around 0.6-1 until the end of May, while it is currently at a yearly low of 0.25.
This suggests that the selling is not being driven by long-term holders.
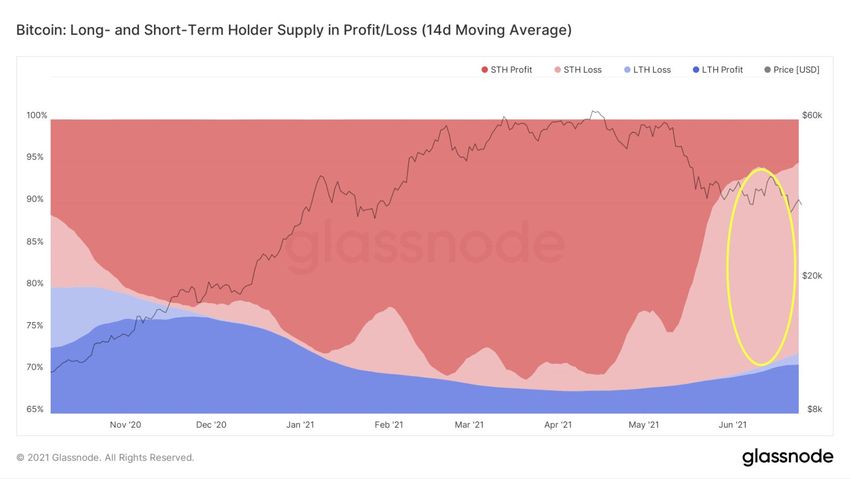
This is also visible when looking at losses incurred by short-term holders (light red), which is at a yearly high. Conversely, long-term holders are barely incurring any losses at all (light blue).
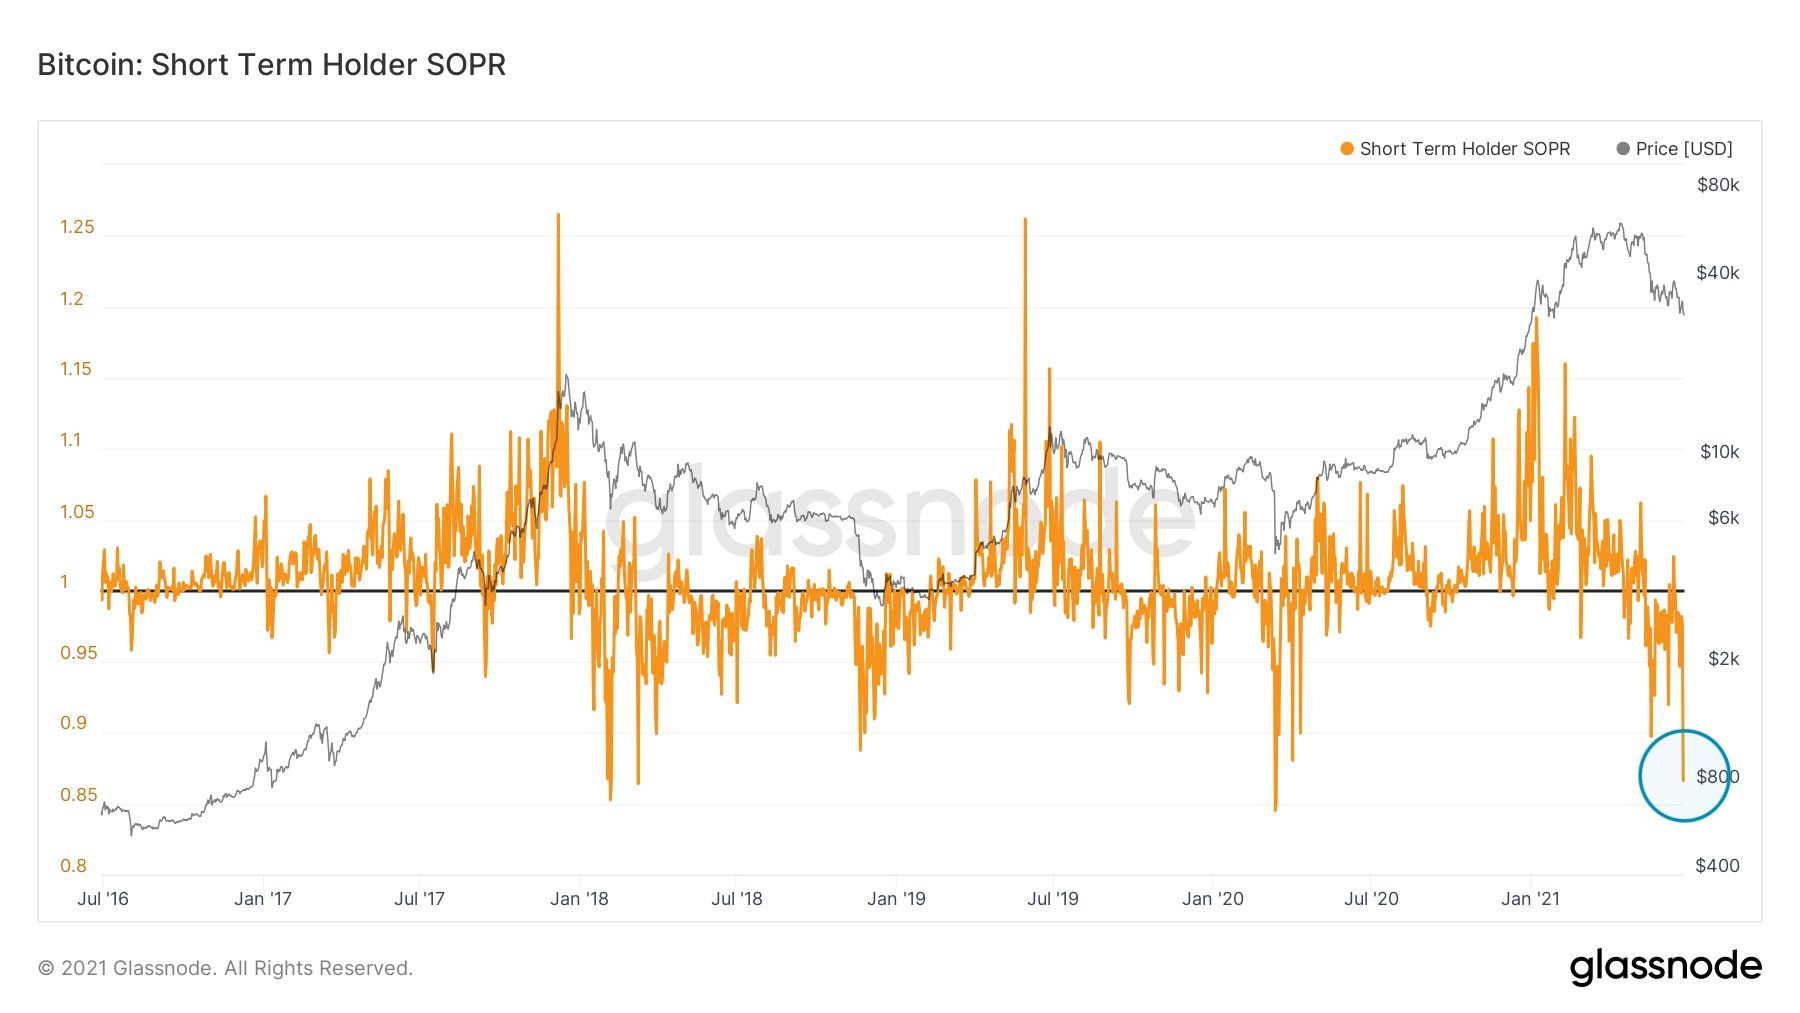
The short-term holder SOPR also shows one of the highest losses in the entire BTC price history.
Long-term readings
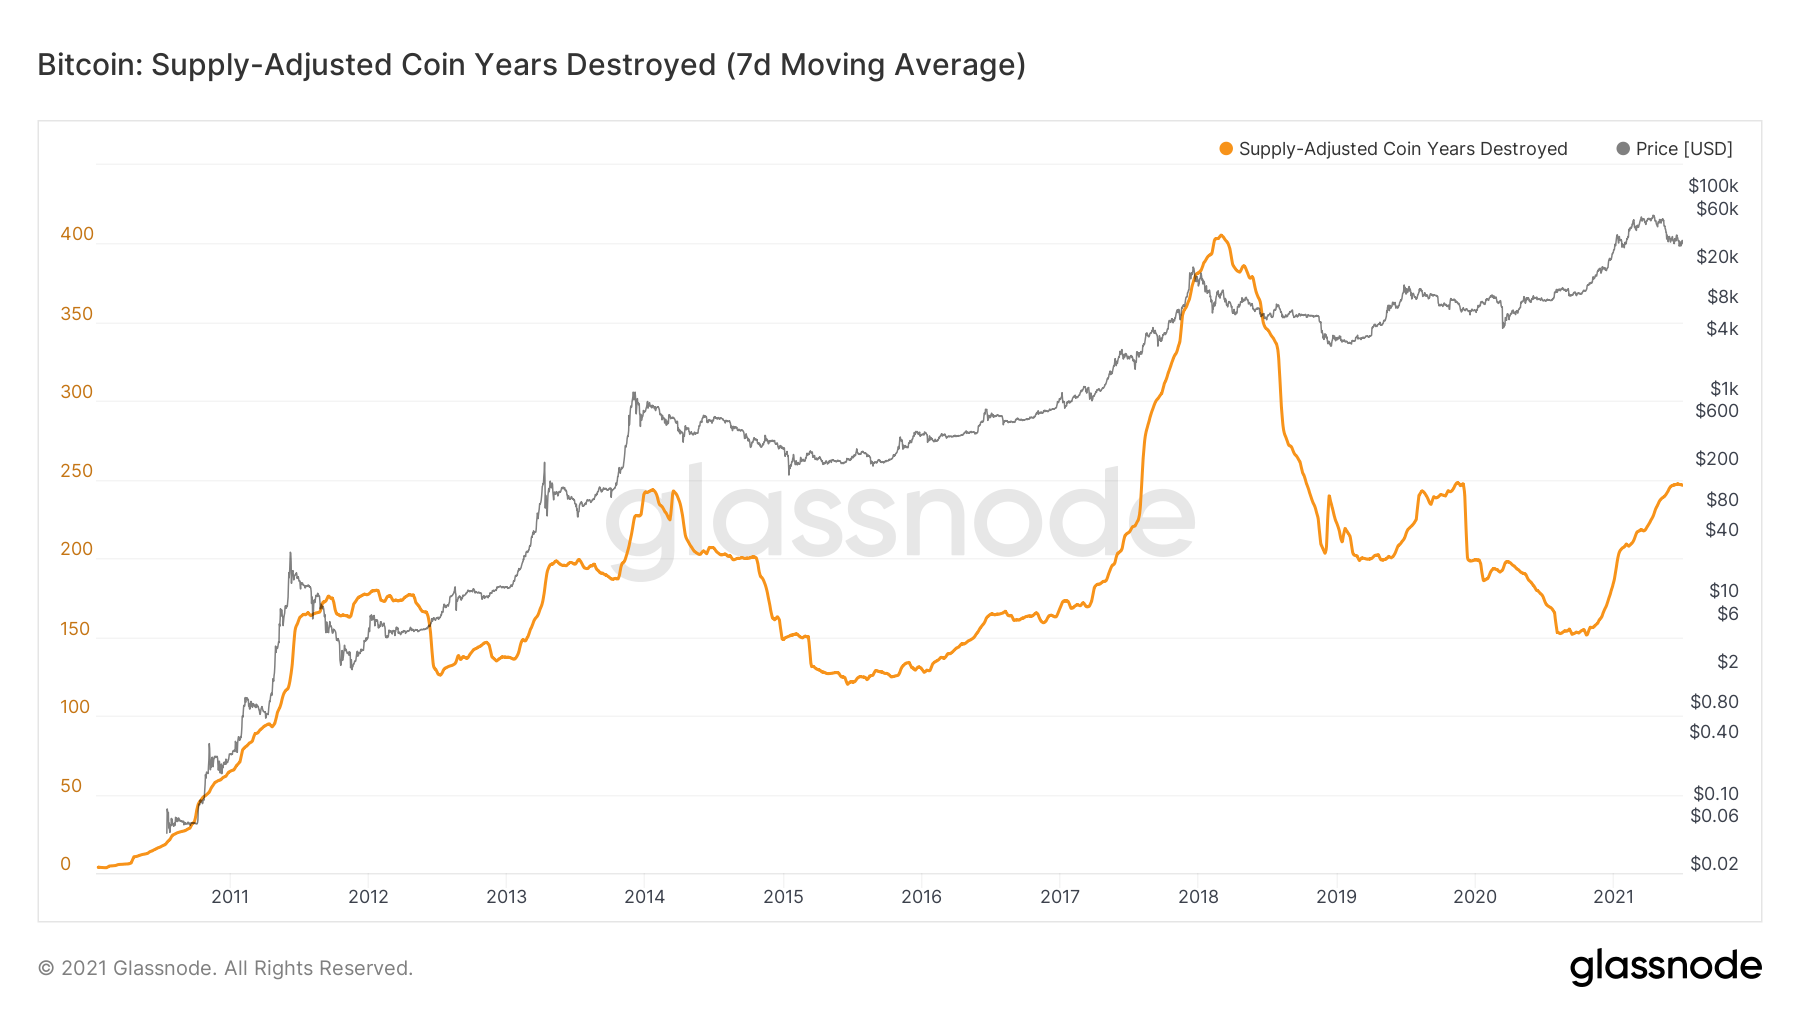
Coin Years Destroyed (CYD) is a 365-day rolling sun of CDD. It is also used to visualize the behavior of long-term holders.
It is currently at 247, values close to those in the end of 2019, and much lower than the 2018 top.
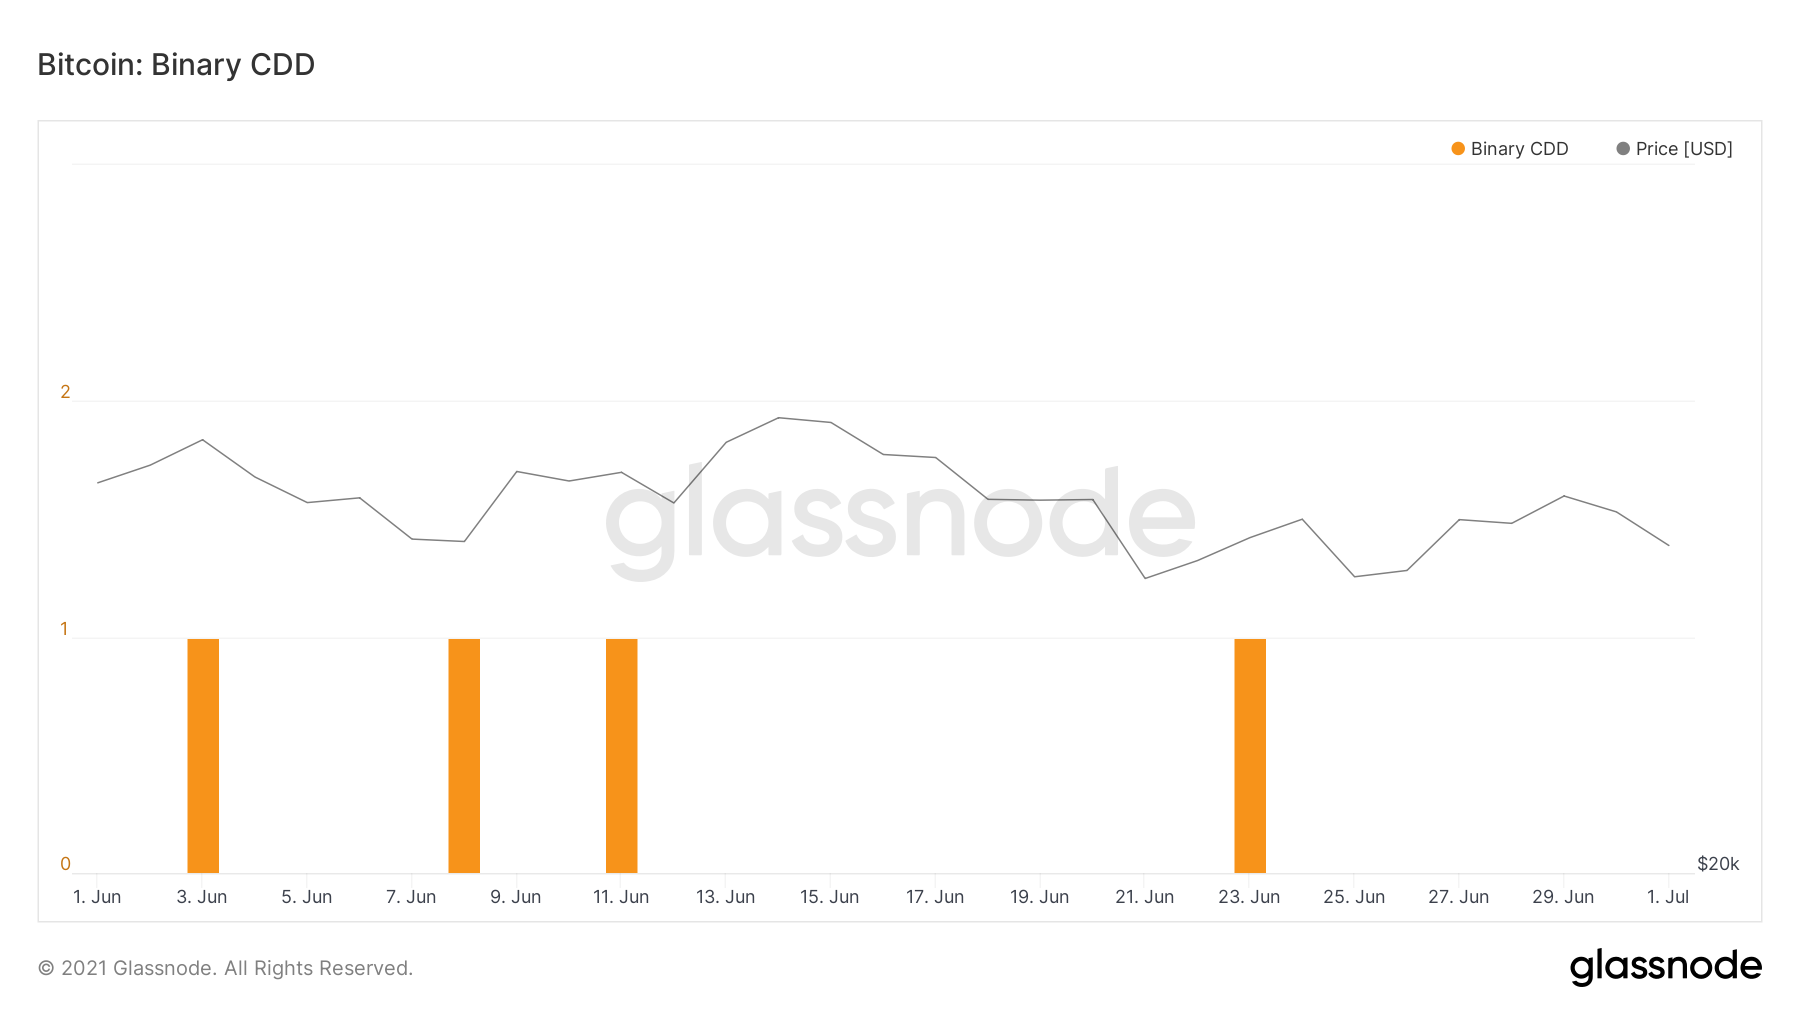
Binary Coin Days Destroyed (Binary CDD) is computed by taking the average CDD, and comparing it to the daily CDD. A value of 1 is given is the daily CDD is higher than the average, and a value of 0 is given if it is low.
Since June 1, only four days have had higher than average CDD. This means that less and less long-term holders are selling.
For BeInCrypto’s latest bitcoin (BTC) analysis, click here.



