
The bitcoin (BTC) price has been decreasing since it was rejected by the $55,850 resistance area.
Ethereum (ETH) reached a new all-time high on April 28.
XRP (XRP) has been increasing since it started to recover on April 23.
Swipe (SXP) has broken out from a descending resistance line while Fantom (FTM) has broken out from a descending wedge.
Verge (XVG) was rejected by a long-term resistance level.
ICON (ICX) has completed a running flat correction.
BTC
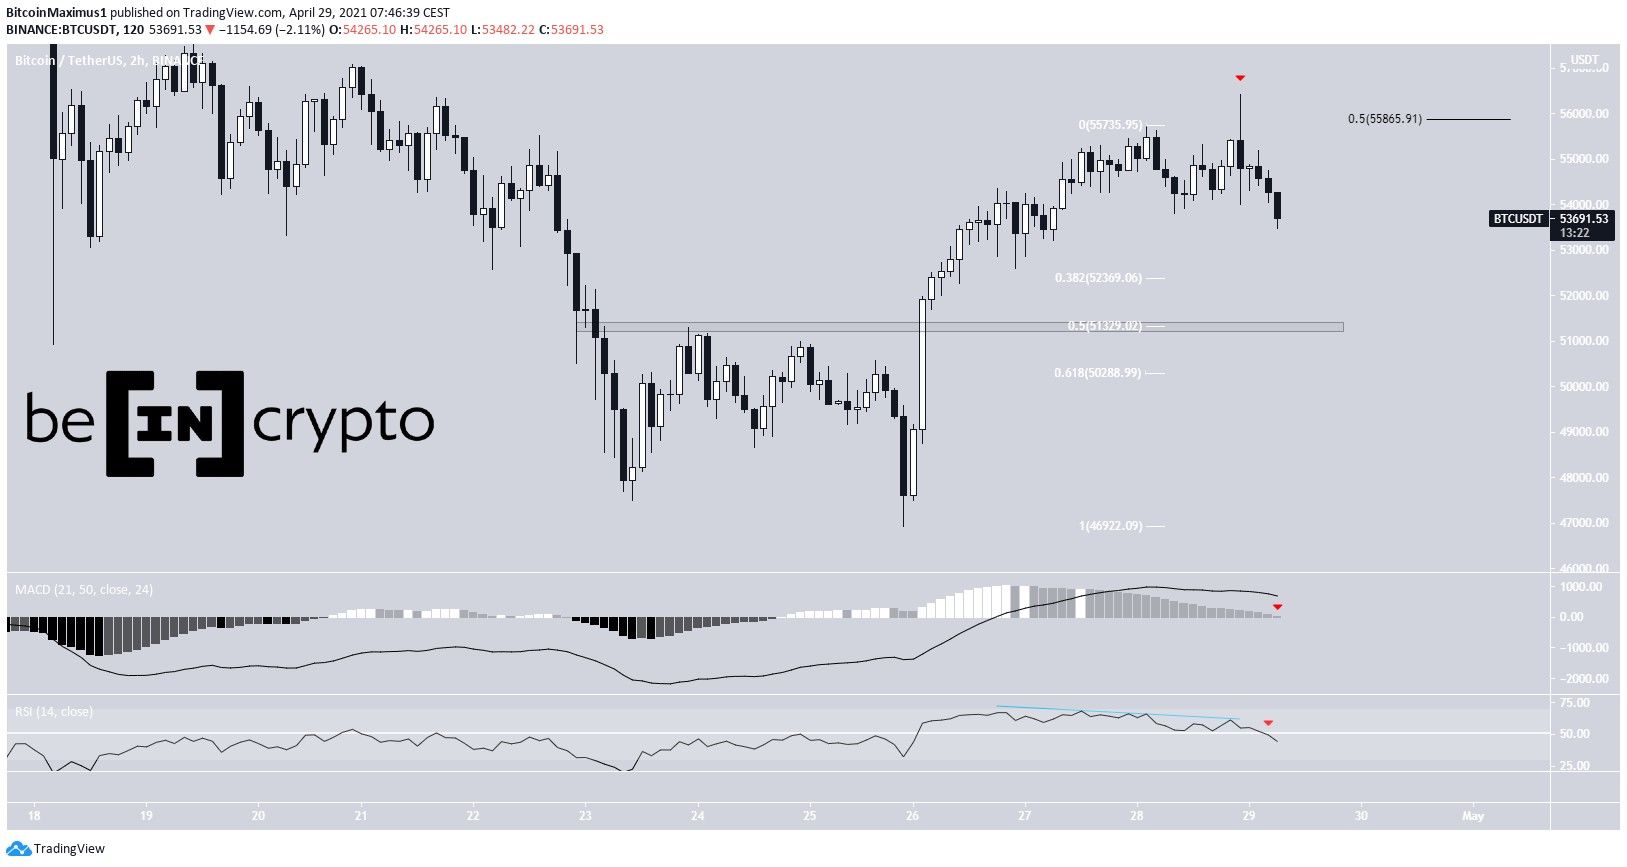
On April 28, BTC reached a high of $56,428 before decreasing. The high was made at the 0.5 Fib retracement resistance level (black) measuring the previous decrease.
The RSI has generated a bearish divergence and the MACD has almost crossed below 0. Both of these are signs that a correction is expected.
There are support levels at $52,370, $51,330 and $50,300. The $51,330 area is also a horizontal support level, increasing its significance.
ETH
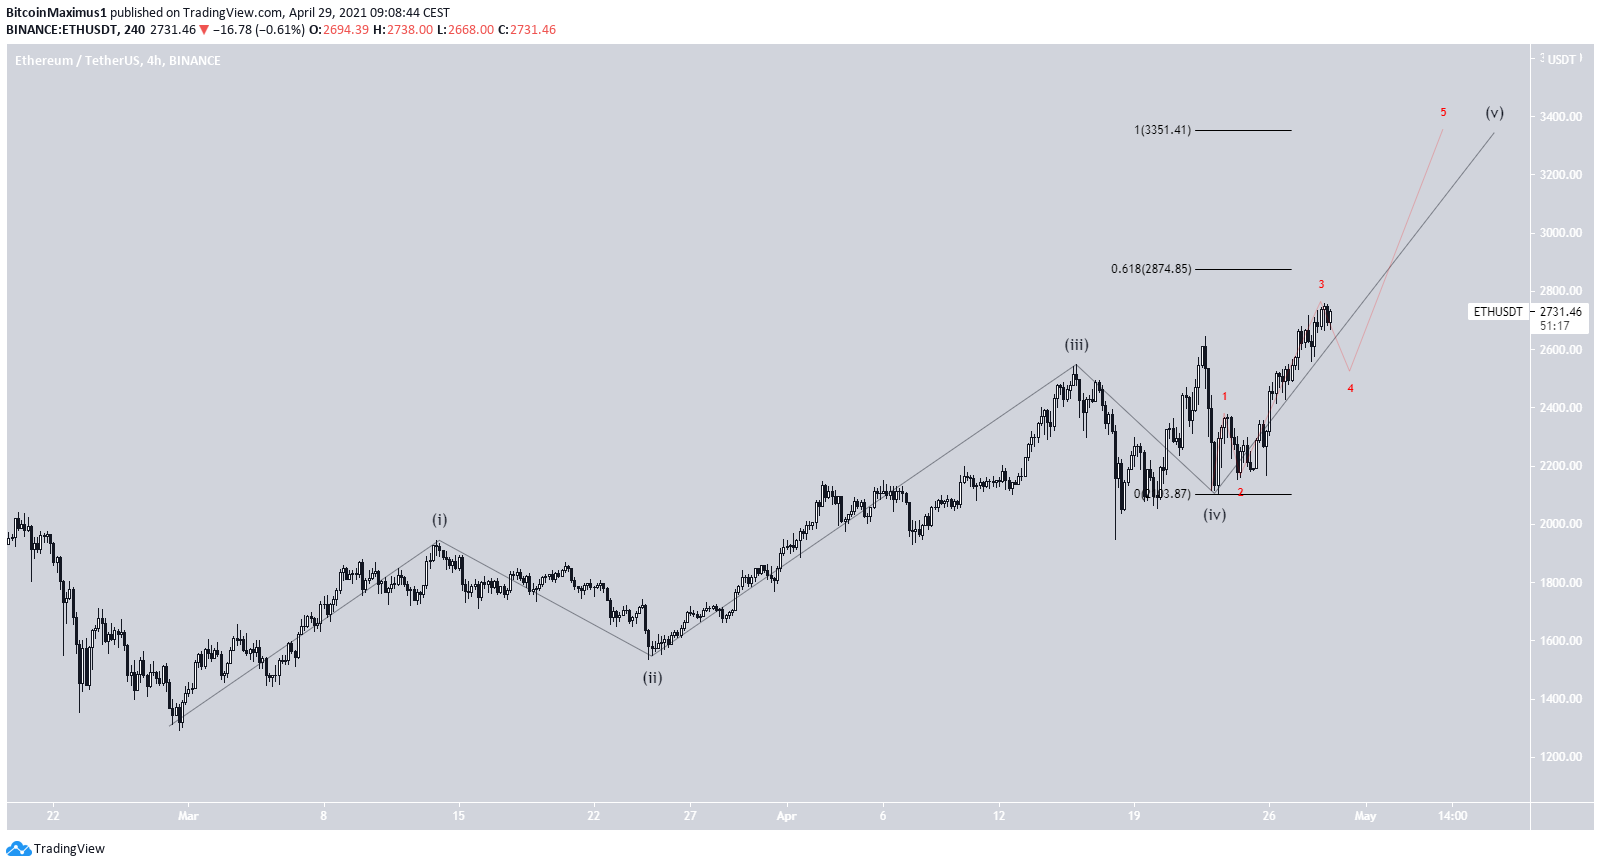
On April 28, ETH reached a new all-time high of $2760. It has decreased slightly since.
The wave count suggests that it’s in sub-wave three (red) of wave five (black). The most likely targets for the top of the upward movement are found at $2,874 and $3,351. Since the price is already close to the former at a time when there is another sub-wave left, it’s likely that ETH will reach the higher target.
These targets were found using a Fib projection on waves 1-3.
For a longer-term analysis, click here.
XRP
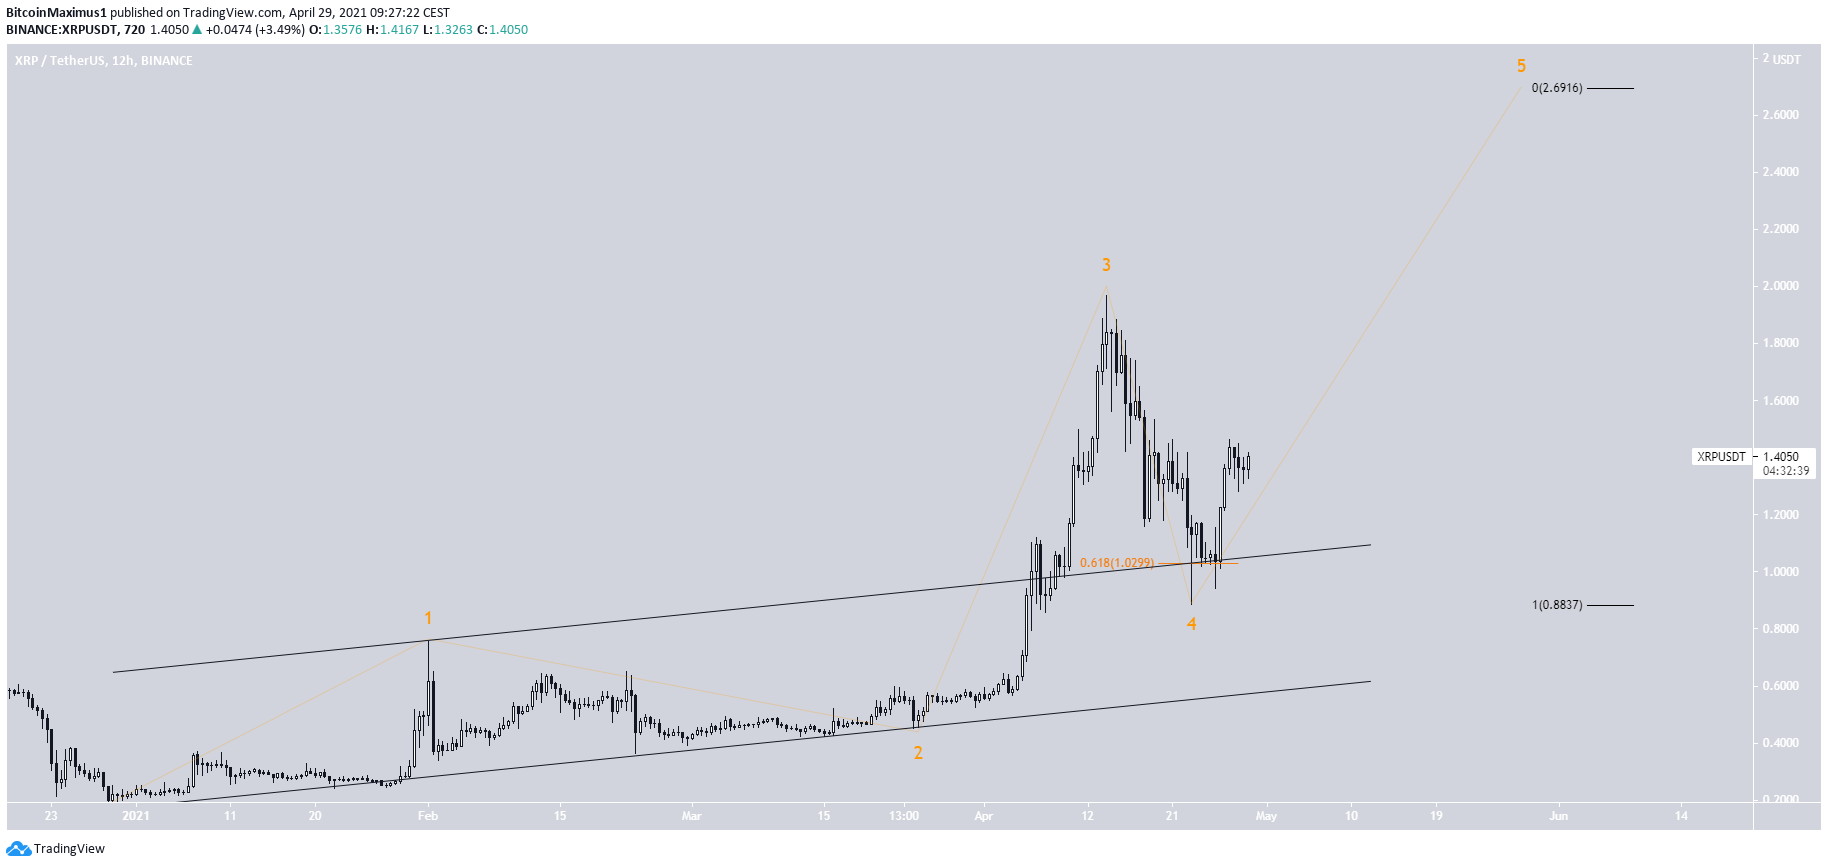
XRP has been moving downwards since April 14, when it completed wave three (orange), reaching a high of $1.94.
The decrease continued until April 23, when XRP reached a low of $0.88. This completed a fourth wave pullback. The token reclaimed the 0.618 Fib retracement support shortly afterward.
The most likely target for the top of the upward movement is located at $2.69. This increase would complete wave five. This target was also found using a Fib projection on waves 1-3.
SXP
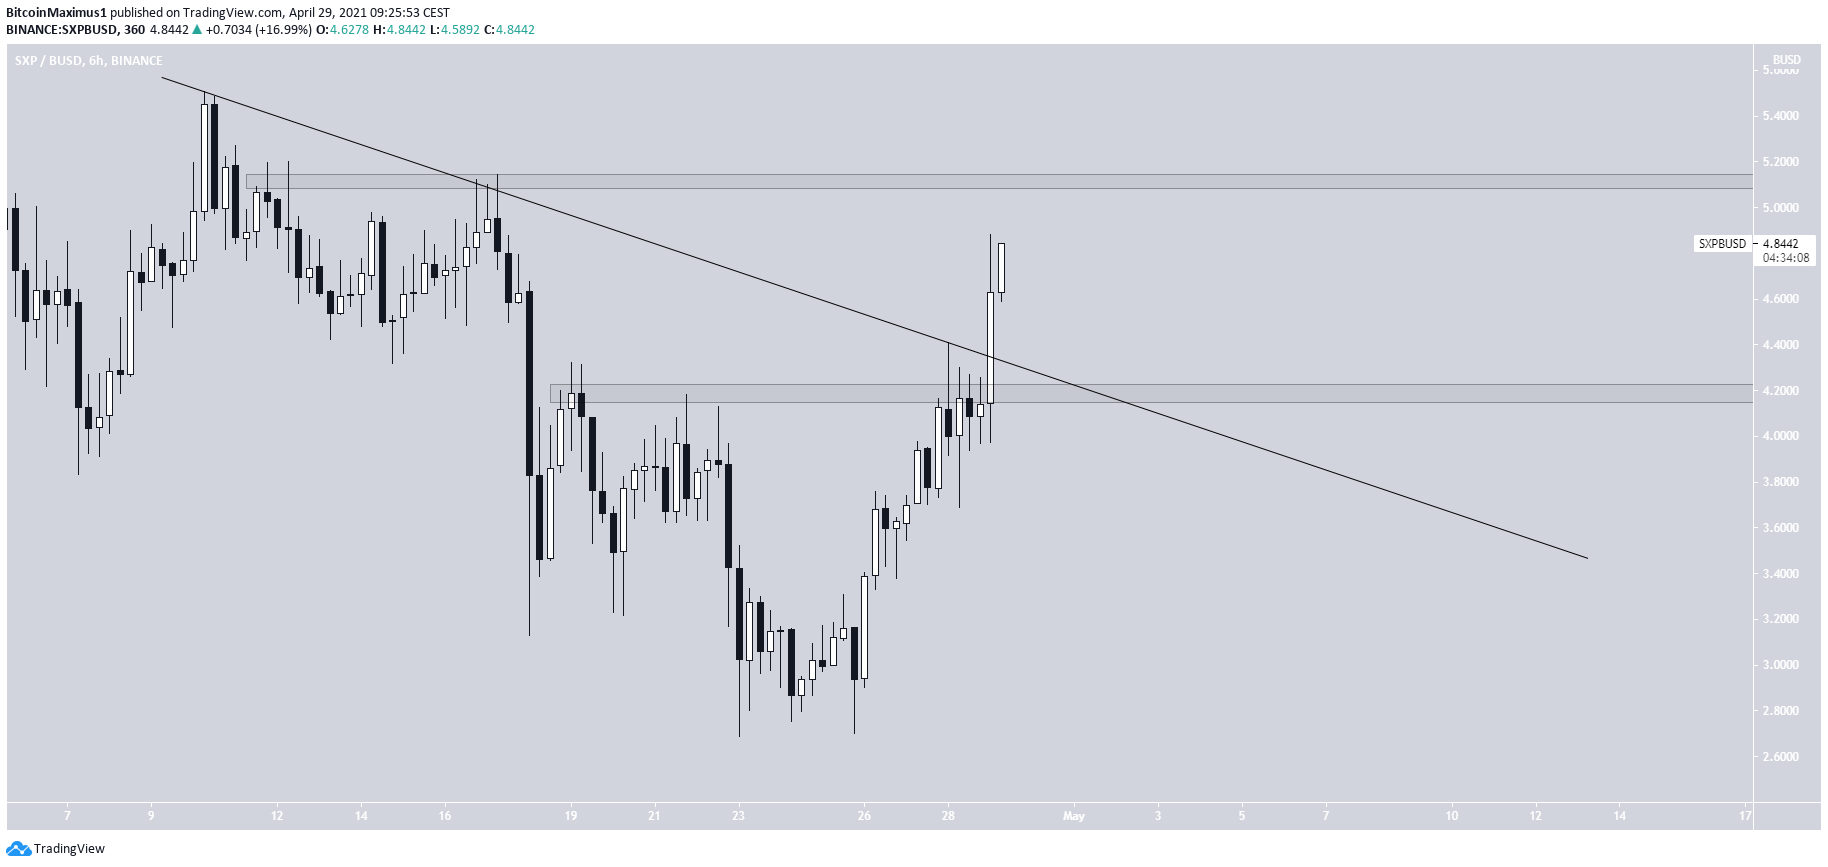
SXP has been decreasing alongside a descending resistance line since it reached a high of $5.50 on April 10.
After three unsuccessful attempts, it finally managed to break out above this line on April 29. So far, it has reached a local high of $4.88.
If the price returns to retest the breakout level, the $4.20 area is likely to act as support. Conversely, the $5.10 area is expected to provide resistance.
For a long-term analysis, click here.
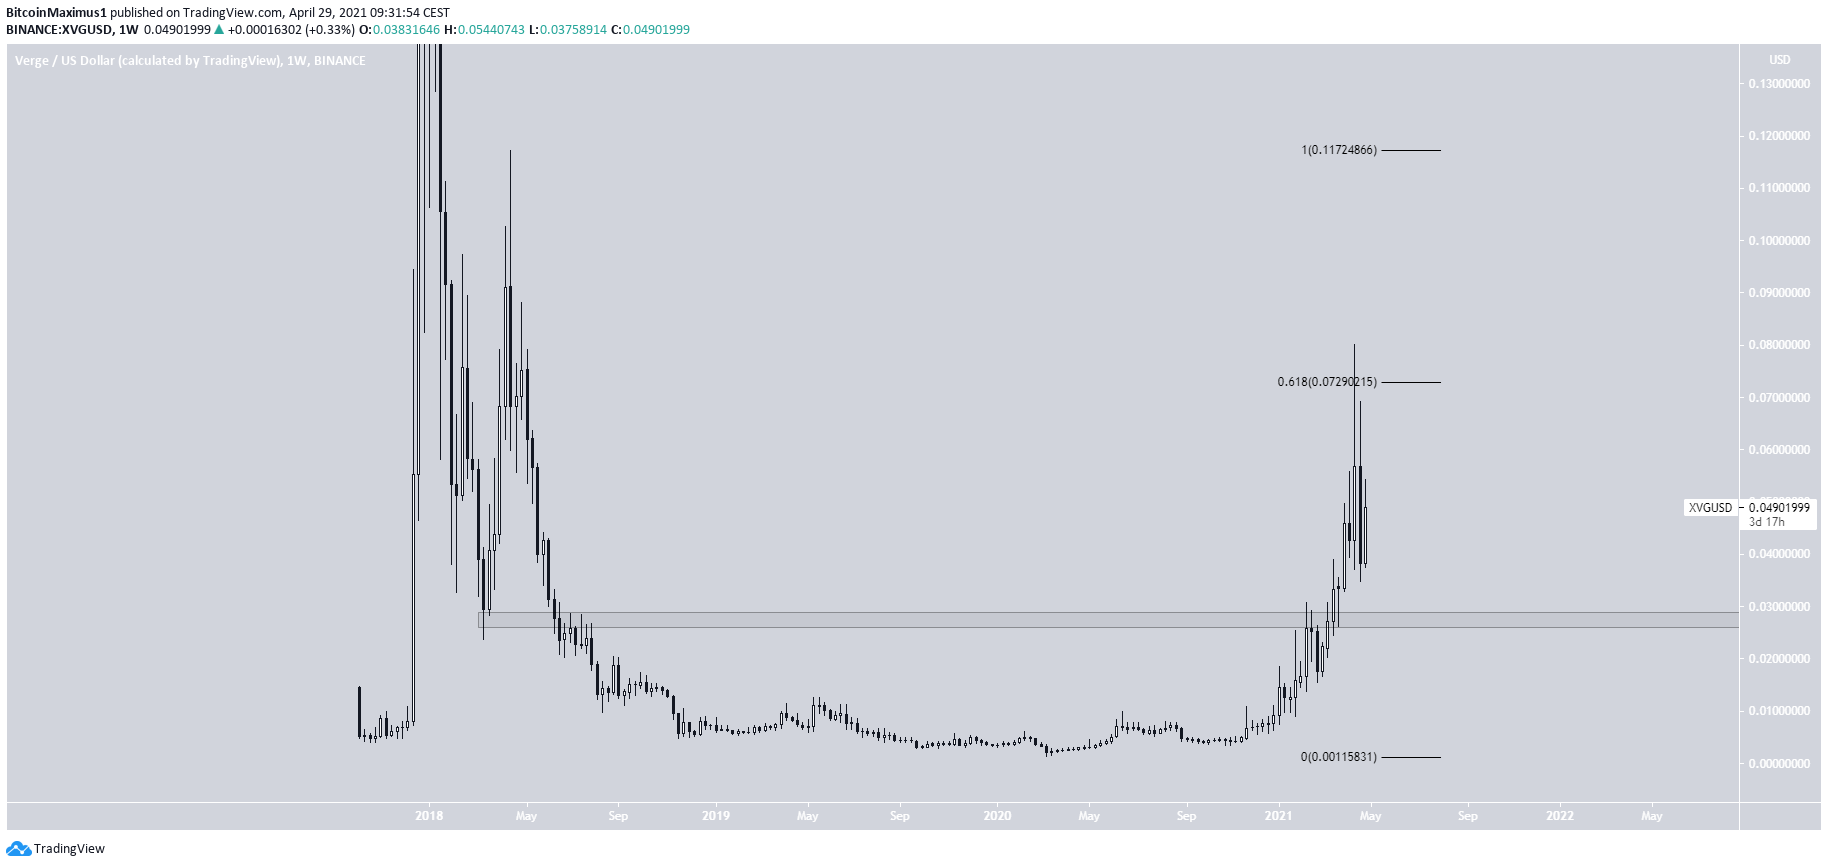
XVG
XVG increased considerably in the second week of April, reaching a high of $0.08 on April 17. However, it was rejected by the 0.618 Fib retracement level immediately afterward.
It created a bearish engulfing candlestick the next week. It has yet to retest the previous breakout level at $0.028 and validate it as support.
Consolidation between these two levels is expected before XVG can eventually break out and move towards $0.11.
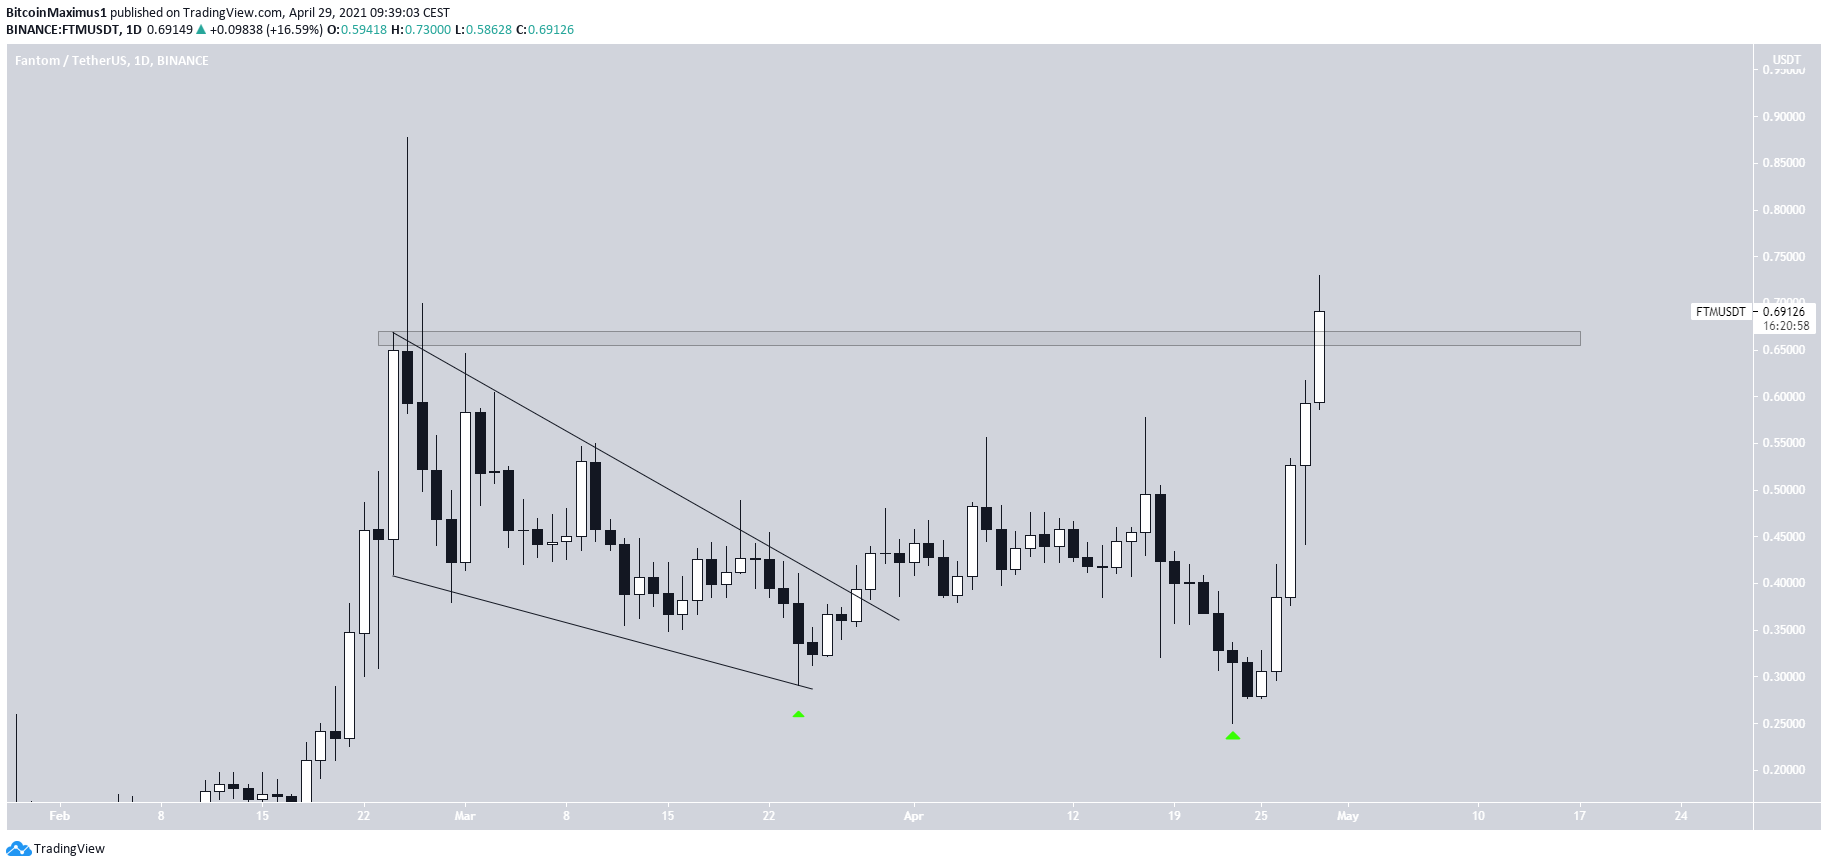
Fantom (FTM)
On March 28, FTM broke out from a descending wedge. Afterward, it dropped once more but completed a double bottom pattern on April 23. It has been moving upwards since.
Currently, it’s in the process of reclaiming the $0.66 resistance area. If successful in reaching a close above it, FTM is likely to increase towards $0.90 and potentially a new all-time high price.
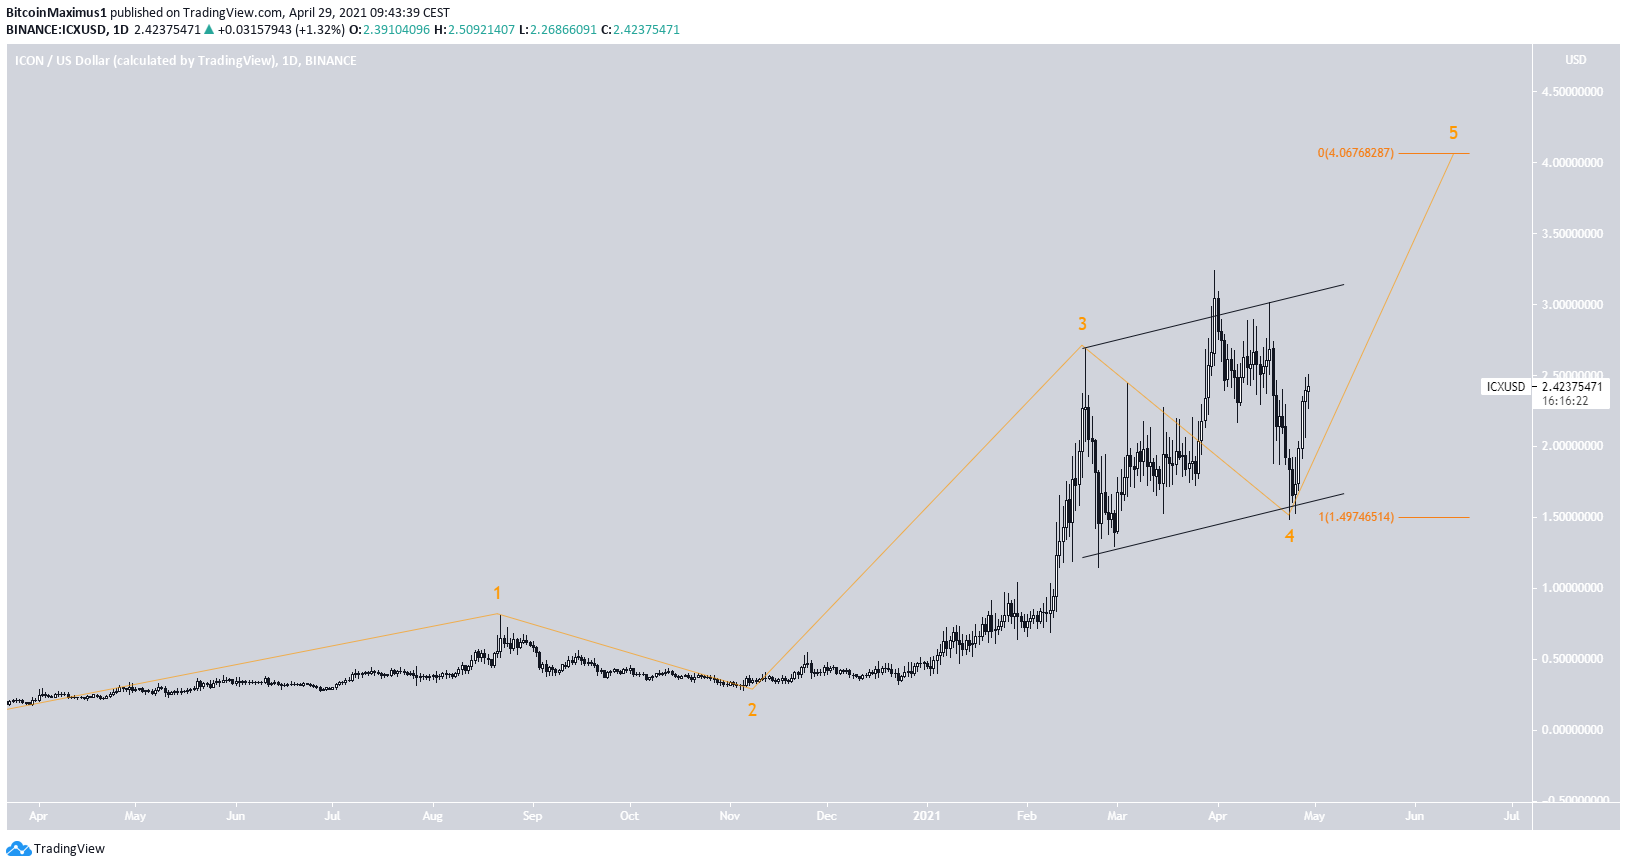
ICX
ICX has been moving upwards since bouncing on April 23. The low of $1.48 occurred right at the support line of an ascending parallel channel, potentially completing a running flat correction.
A likely target for the top of the upward movement is found at $4.06.
Similar to ETH, the target is found using a Fib projection on waves 1-3.
For BeInCrypto’s latest bitcoin (BTC) analysis, click here.
