
Bitcoin (BTC) has created a bearish engulfing candlestick and reached a low of $33,125.
Ethereum (ETH) has been increasing since June 22 and is approaching the $2,725 resistance area.
XRP (XRP) has broken out from a descending resistance line but has yet to initiate an upward movement.
Kava.io (KAVA) and Enjin Coin (ENJ) have broken out from long-term descending resistance lines.
Monero (XMR) has bounced at the $195 horizontal support area but failed to initiate further upward movement.
Curve DAO Token (CRV) is trading inside an ascending wedge.
BTC
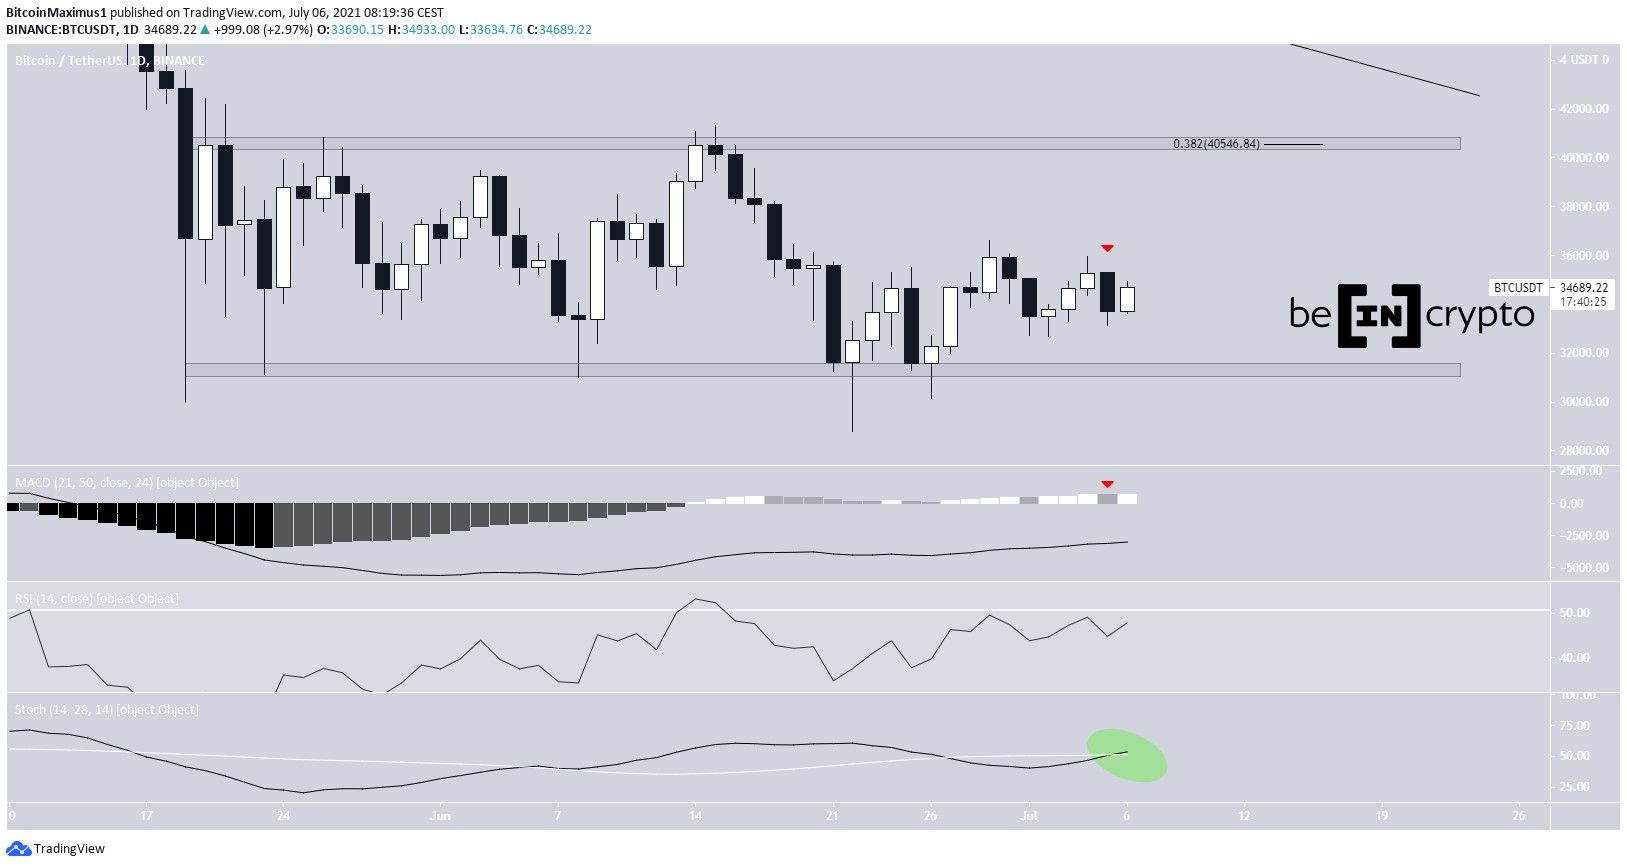
BTC created a bearish engulfing candlestick and fell sharply on July 5. While it reached a low of $33,125, it bounced immediately afterwards.
Despite the bounce, technical indicators are still bearish. The MACD has created a lower momentum bar and is close to giving a bearish reversal signal. The RSI is also below 50.
However, the Stochastic oscillator has made a bullish cross.
The closest resistance and support levels are found at $40,550 and $31,400.
ETH
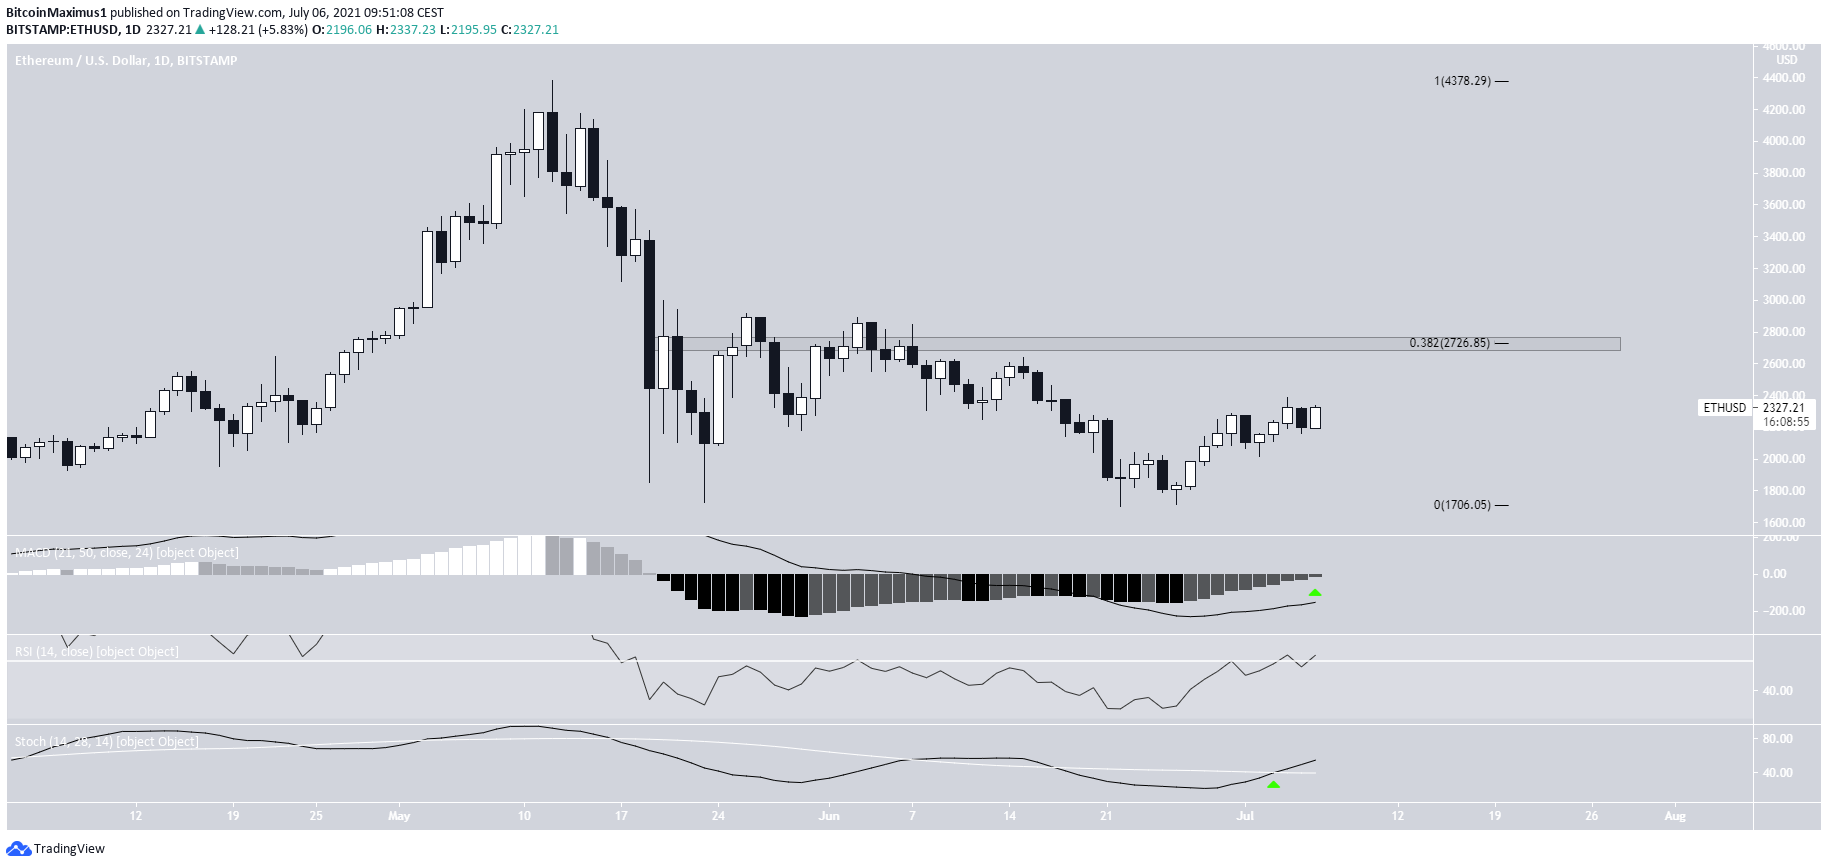
ETH has been moving upwards since June 22.
While it fell sharply, it has rebounded considerably and is in the process of creating a bullish engulfing candlestick.
Technical indicators are bullish.
The MACD is moving upwards and is nearly positive, the RSI has crossed above 50, and the Stochastic oscillator has made a bullish cross.
The closest resistance is found at $2,725 (0.382 Fib retracement resistance level).
XRP
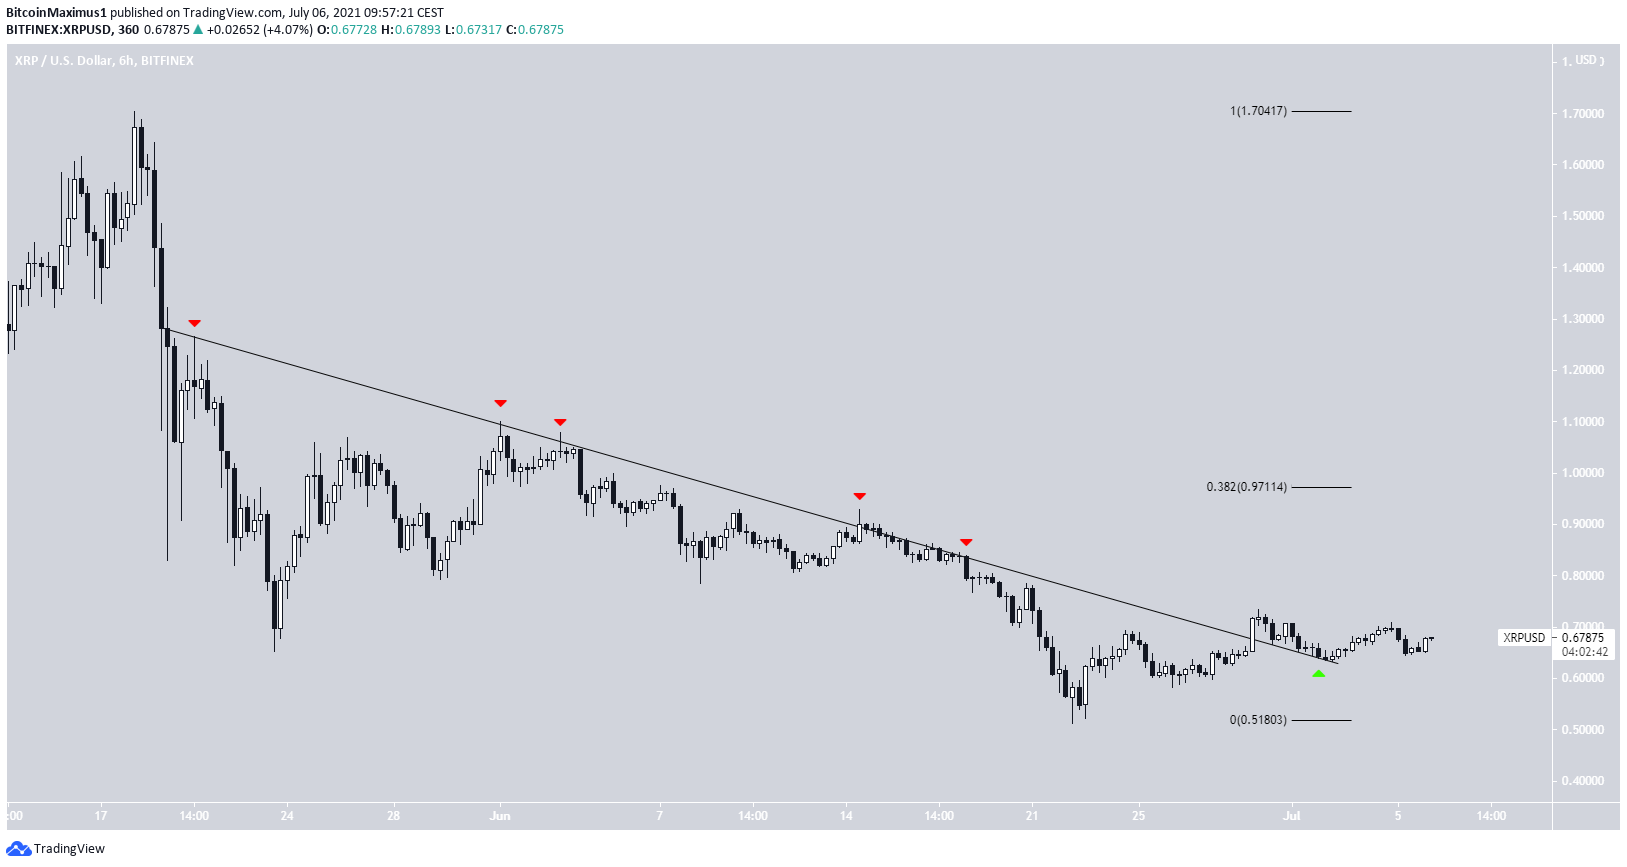
XRP had been following a descending resistance line since May 19. After five unsuccessful breakout attempts (red icon), it was finally successful in moving above the line on June 30.
On July 1, it returned and validated the line as support (green icon). However, it has yet to initiate a substantial upward movement.
The closest resistance area is found at $0.97 (0.382 Fib retracement resistance level).
KAVA
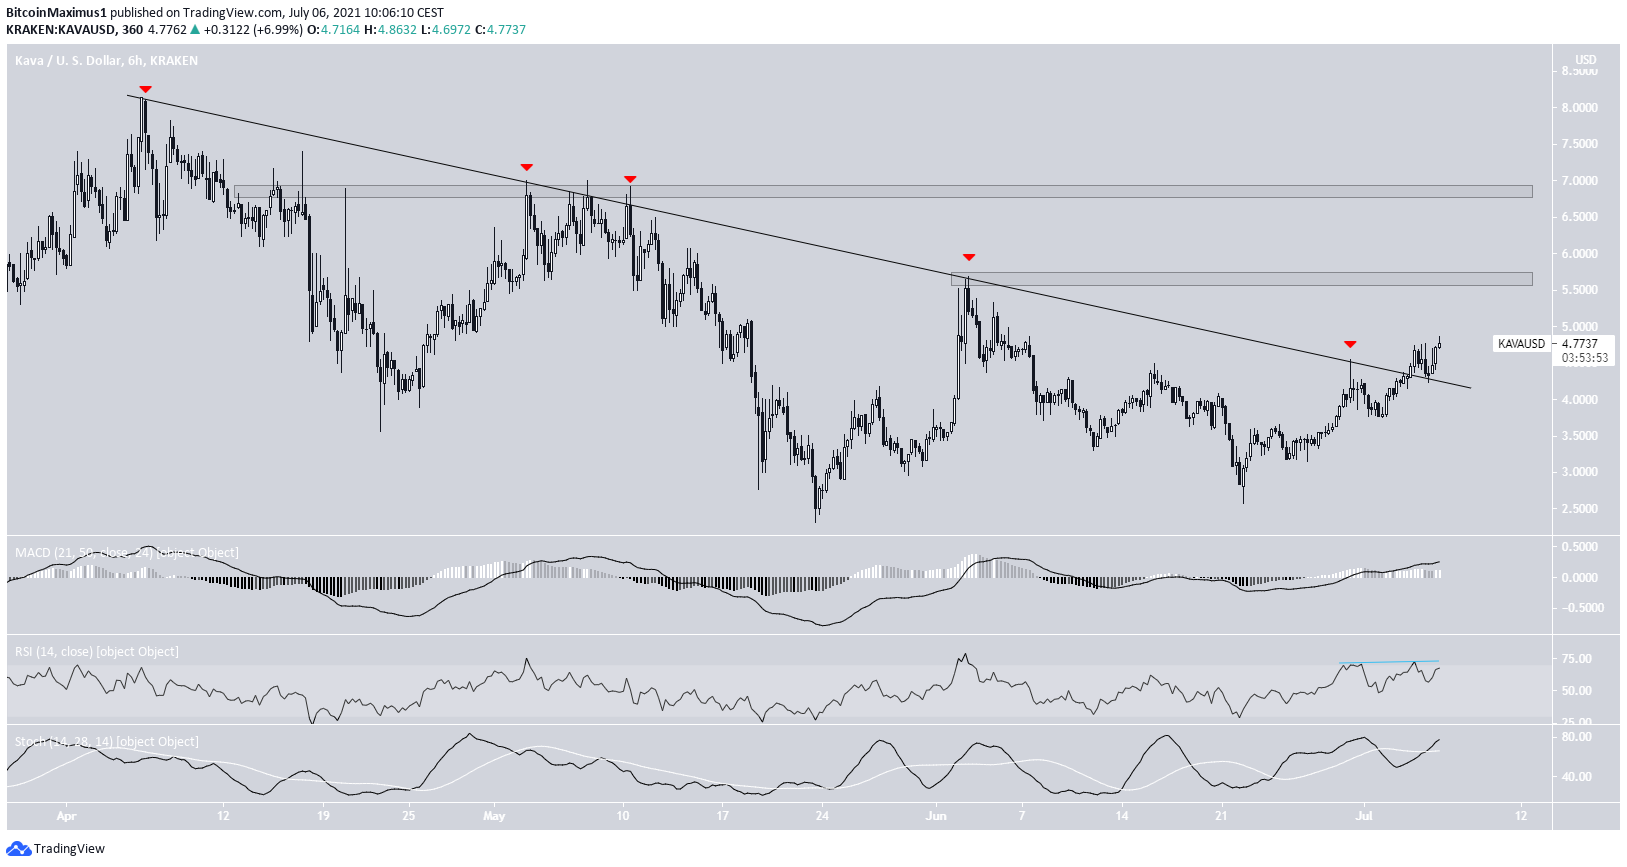
KAVA had been following a descending resistance line since April 6 after reaching an all-time high price of $8.16. Similar to XRP, it broke out after five unsuccessful attempts (red icons).
The closest resistance levels are found at $5.60 and $6.85, both being horizontal areas.
Technical indicators in the daily time-frame are still bullish, but there is a potential bearish divergence that is growing in the RSI.
XMR
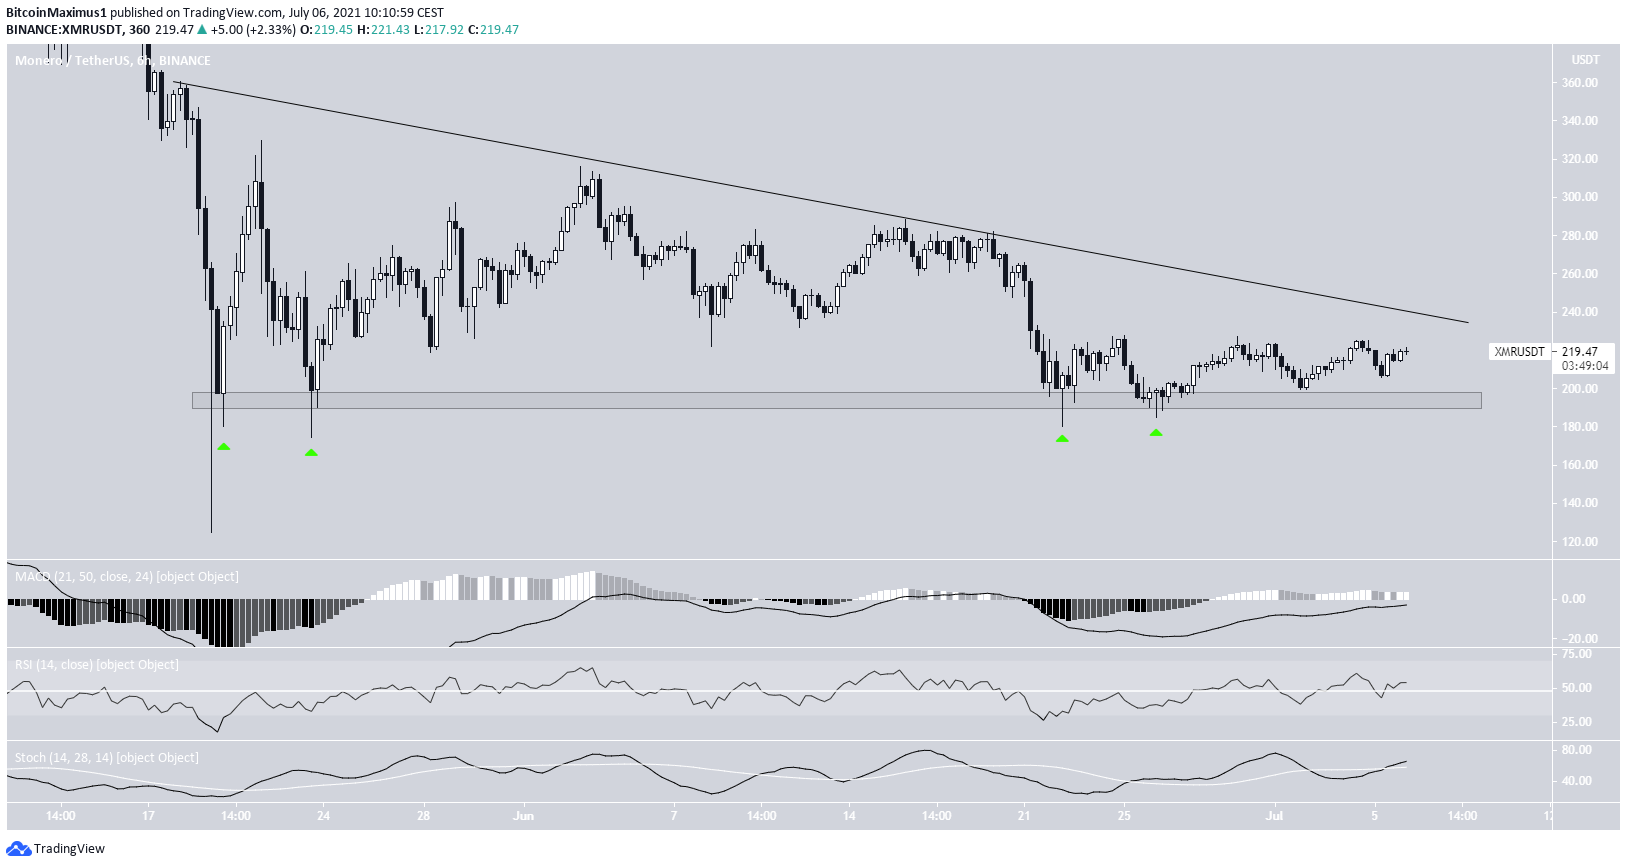
XMR has been following a descending resistance line since May 18.
Throughout this period, XMR has bounced at the $195 horizontal support area five times, most recently on June 26.
However, XMR still hasn’t been able to reach the descending resistance line. Until it breaks out from this line, the trend cannot be considered bullish.
Technical indicators also provide a relatively neutral outlook.
ENJ
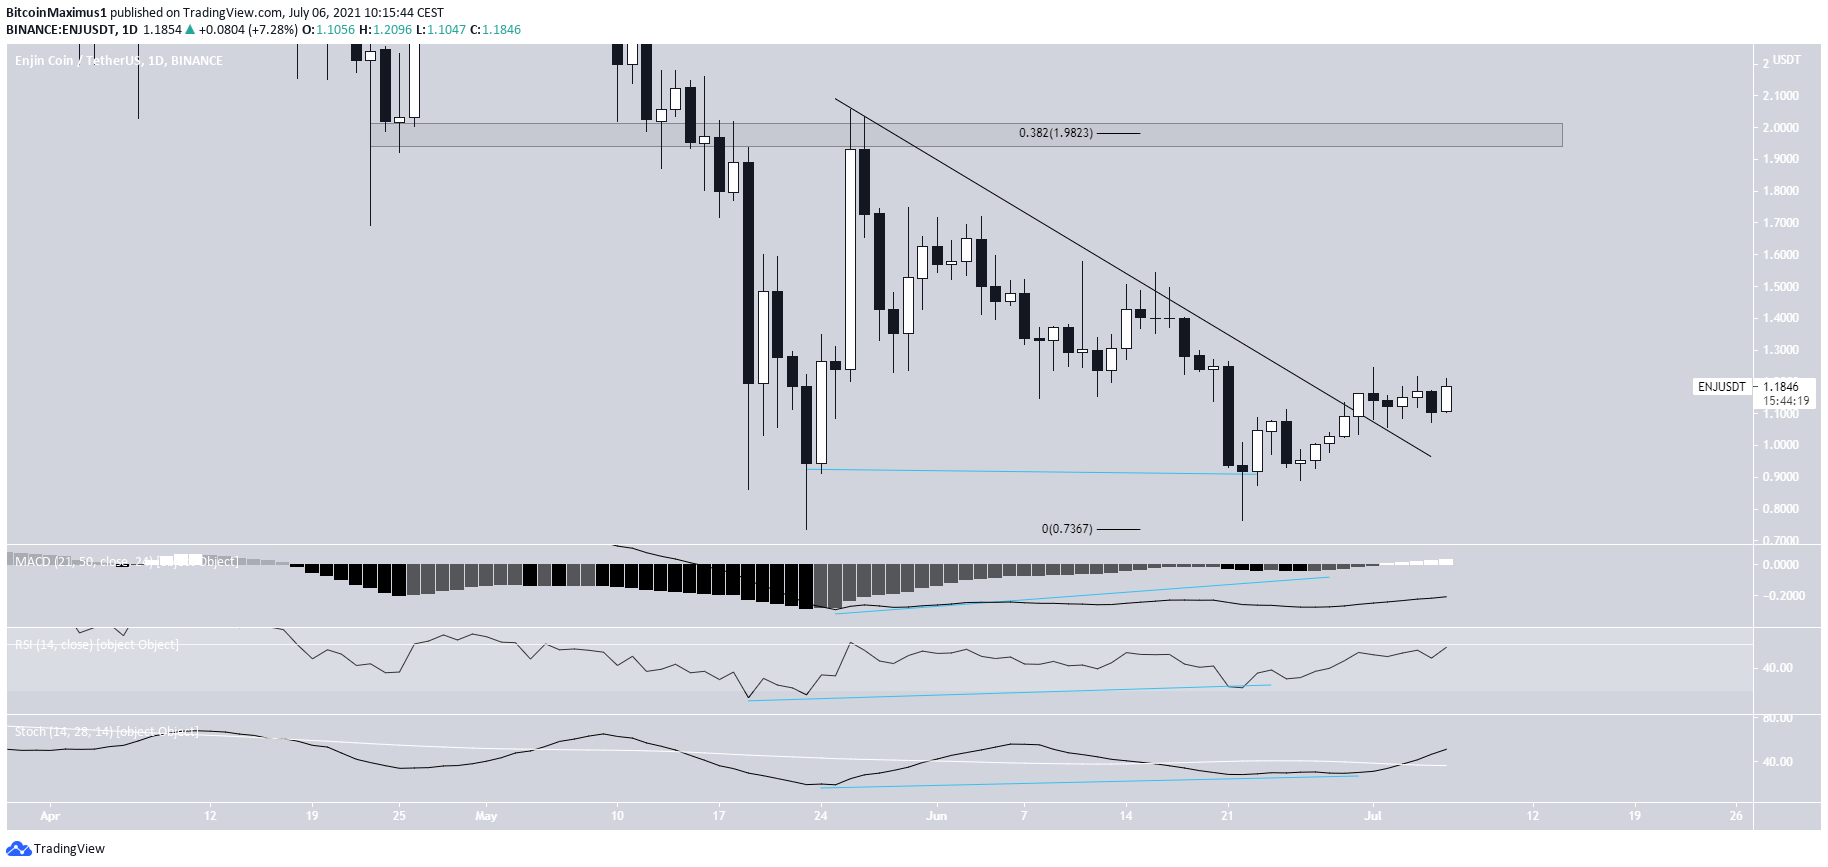
Similar to XRP, ENJ had been following a descending resistance line since May 26. It managed to break out on June 30 and validated the area as support shortly afterwards.
The breakout was preceded by a double bottom pattern between May 23-June 23. The pattern was also combined with bullish divergences in the MACD, RSI, and Stochastic oscillator.
The closest resistance area is found at $1.98 (0.382 Fib retracement resistance level).
CRV
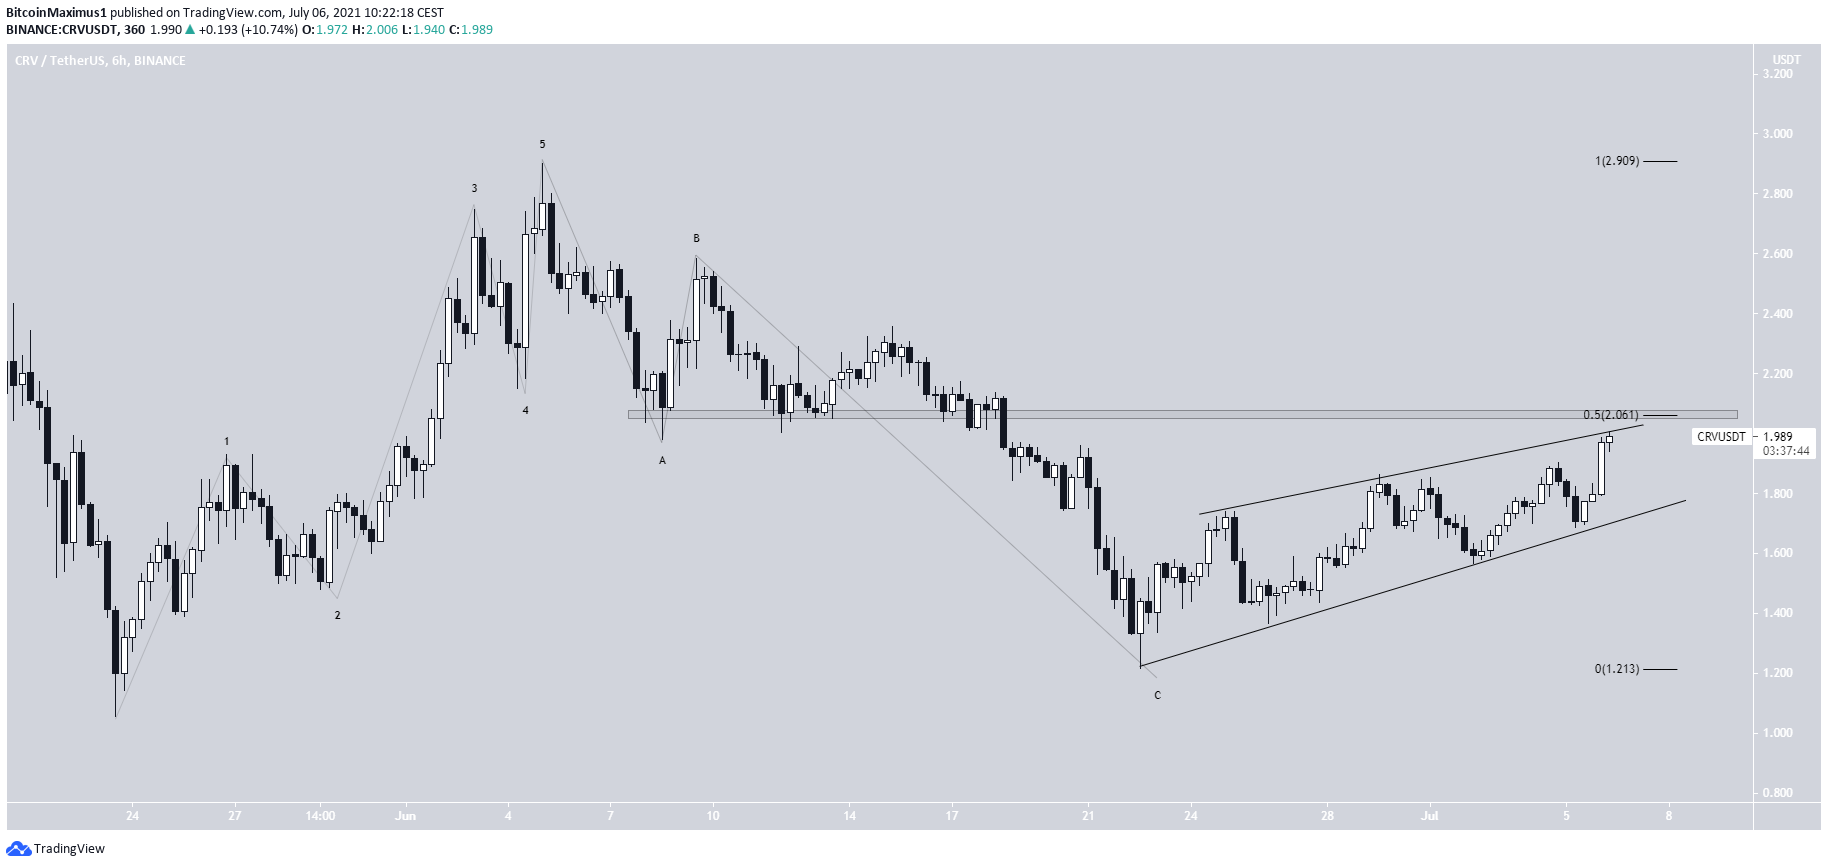
CRV has been moving upwards since May 23. The upward movement looks like a completed bullish impulse, while the decrease looks like an A-B-C corrective structure.
On June 22, CRV created another higher low and began to move upward once again.
However, it has been increasing inside an ascending wedge, which is normally considered a bearish reversal pattern.
In addition, it’s trading at a confluence of resistance levels, formed by the resistance line of the wedge, 0.5 Fib retracement resistance level, and a horizontal resistance area.
For BeInCrypto’s latest bitcoin (BTC) analysis, click here.
