Bitcoin (BTC) reached a new all-time high price on April 15. Despite this, Ethereum (ETH) is moving upwards at an even faster rate.
XRP (XRP) might have reached a short-term top. Holo (HOT) has broken out from a descending resistance line.
Dash (DASH), EOS (EOS), and Curve DAO Token (CRV) are in the process of breaking out from horizontal resistance levels.
Bitcoin (BTC)
Bitcoin broke out above the $61,500 area on April 13. It reached an all-time high price of $64,854 the next day.
Technical indicators are bullish. This is especially evident by the fact that the MACD has nearly crossed into positive territory.
The closest resistance area is found at $68,725. This is an intermediate resistance level found by using an external Fib retracement.
While this could potentially reject the price, the upward move is likely to continue towards the range of $83,000-$90,000.

Ethereum (ETH)
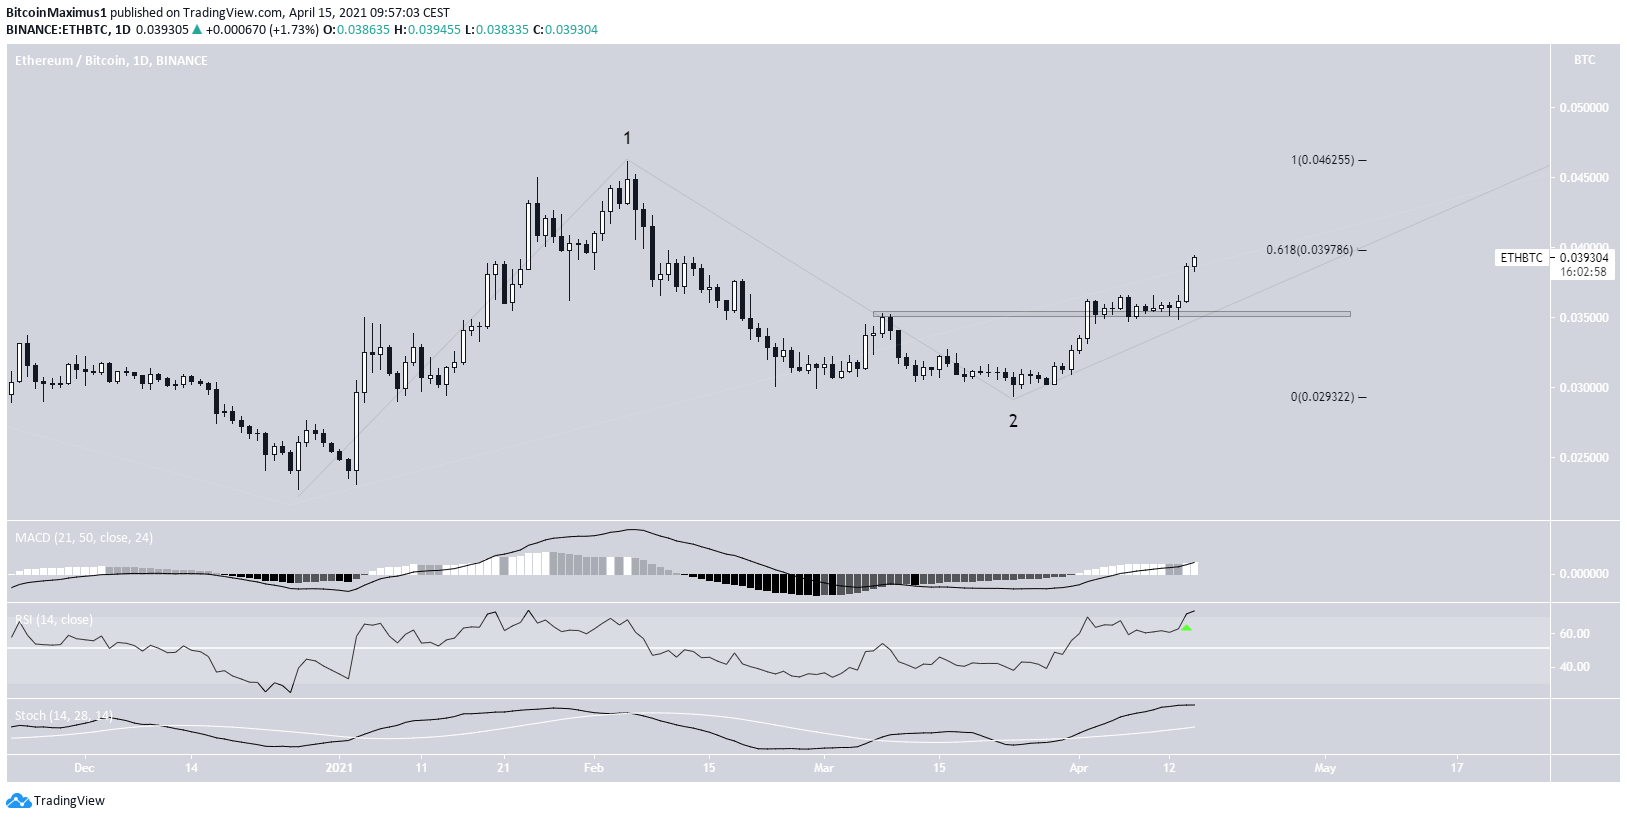
The ETH/BTC pair has been moving upwards since March 24.
On April 2, it reclaimed the ₿0.0352 resistance area and validated it as support after ten days.
It began a significant upward movement on April 13.
There is resistance at ₿0.0397, the 0.618 Fib resistance level. Nevertheless, the main resistance is created by the February highs at ₿0.046.
Technical indicators are bullish and support the continuation of the upward move. The RSI has just crossed above 70.
It’s possible that this is the beginning of a new bullish impulse that could take ETH/BTC up to its 2018 highs.
For BeInCrypto’s ETH/USD analysis, click here.
XRP (XRP)
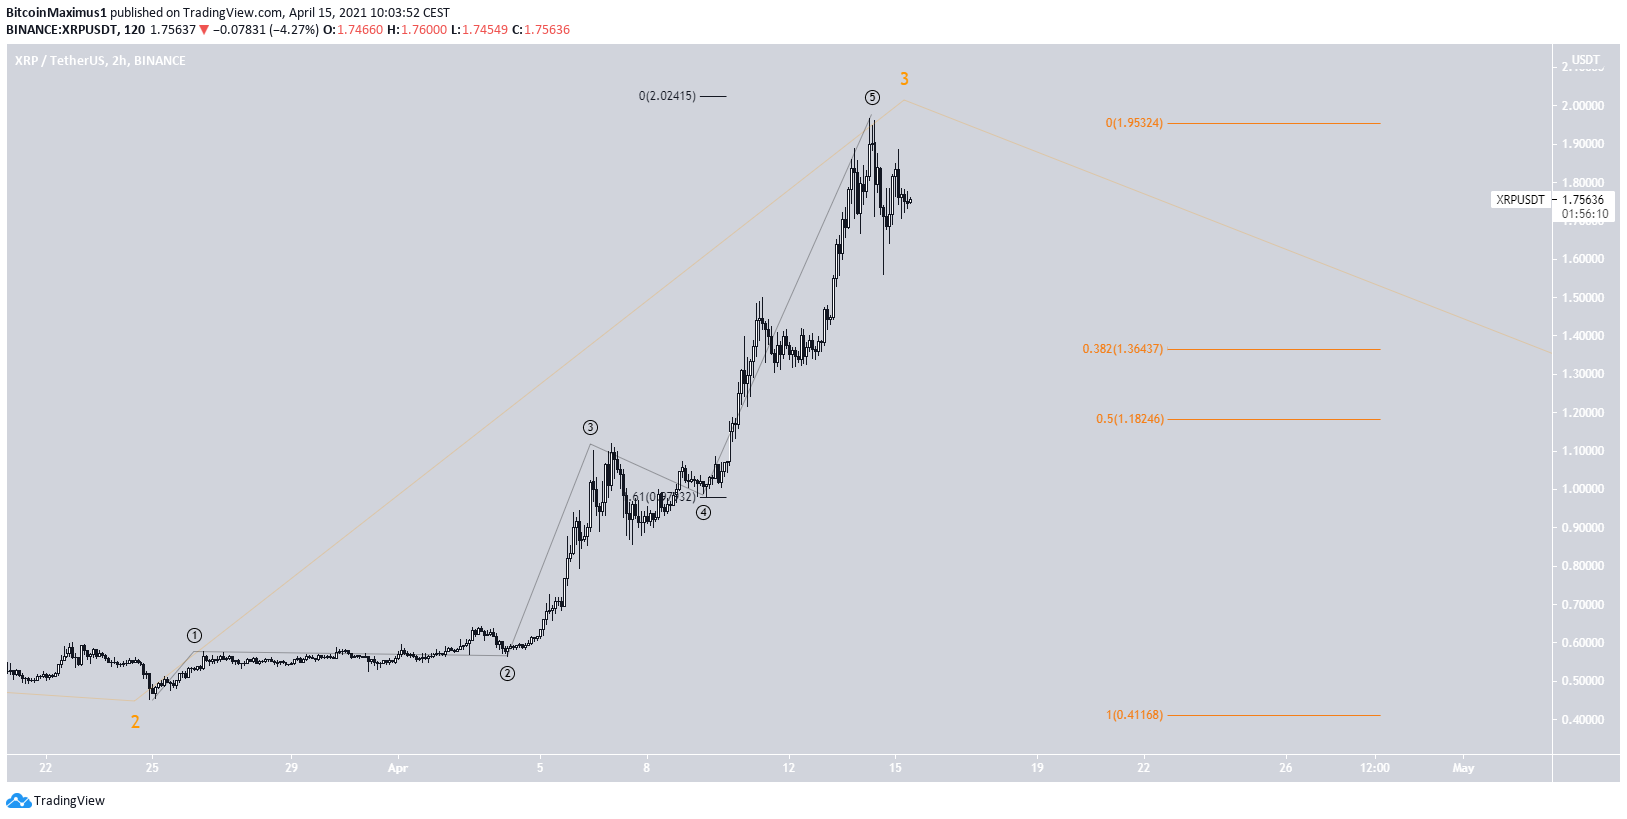
XRP has been moving upwards since March 25.
However, it might have reached the top, at least in the short term, as shown in orange in the chart below. The $1.96 high is very close to the 1:1.61 Fib projection of sub-waves 1-3.
If this is true, XRP could fall back to the 0.382-0.5 Fib retracement support at $1.18-$1.36 before moving upwards again.
Holo (HOT)
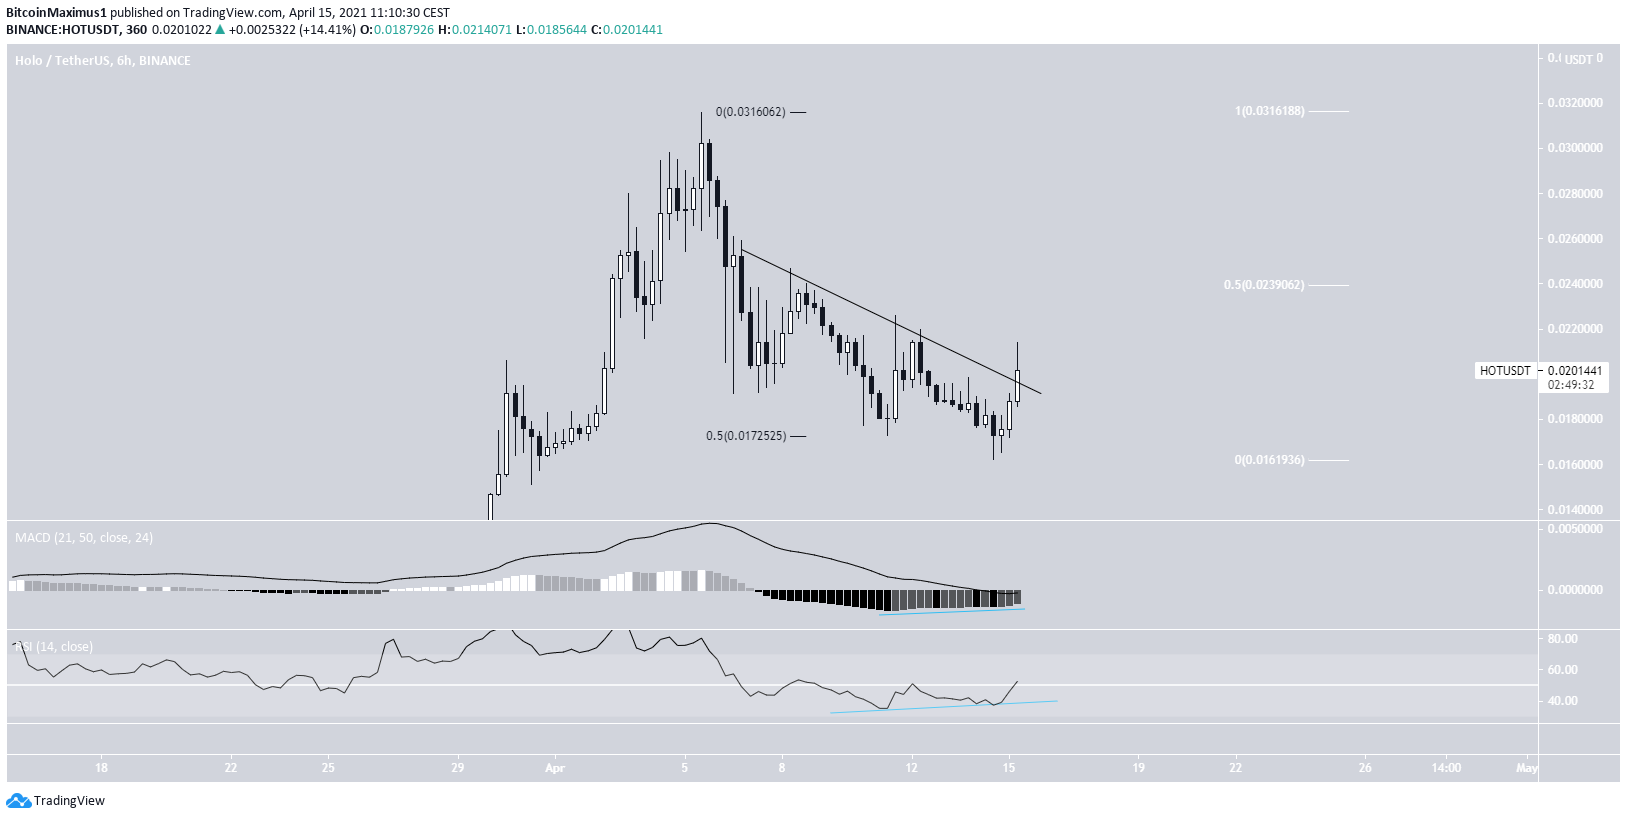
HOT has been moving downwards since reaching a high of $0.031 on April 5.
The ongoing decrease took it all the way back to the 0.5 Fib retracement support level at $0.017. This occurred on April 14 and HOT has been moving upwards since. The upward movement was preceded by a bullish divergence in the RSI.
Today (April 15), HOT broke out from a descending resistance line. The next closest resistance area is found at $0.024.
Dash (DASH)
DASH has been moving upwards since March 25. On April 4, it broke out above the $250 resistance area and dropped to validate it as support two days later.
It’s been increasing ever since. Currently, it’s very close to the $330 resistance area, which is found using the closing price from its February high.
Technical indicators are bullish and support the probability of a breakout.
If so, the next resistance would likely be found at $500.

EOS (EOS)
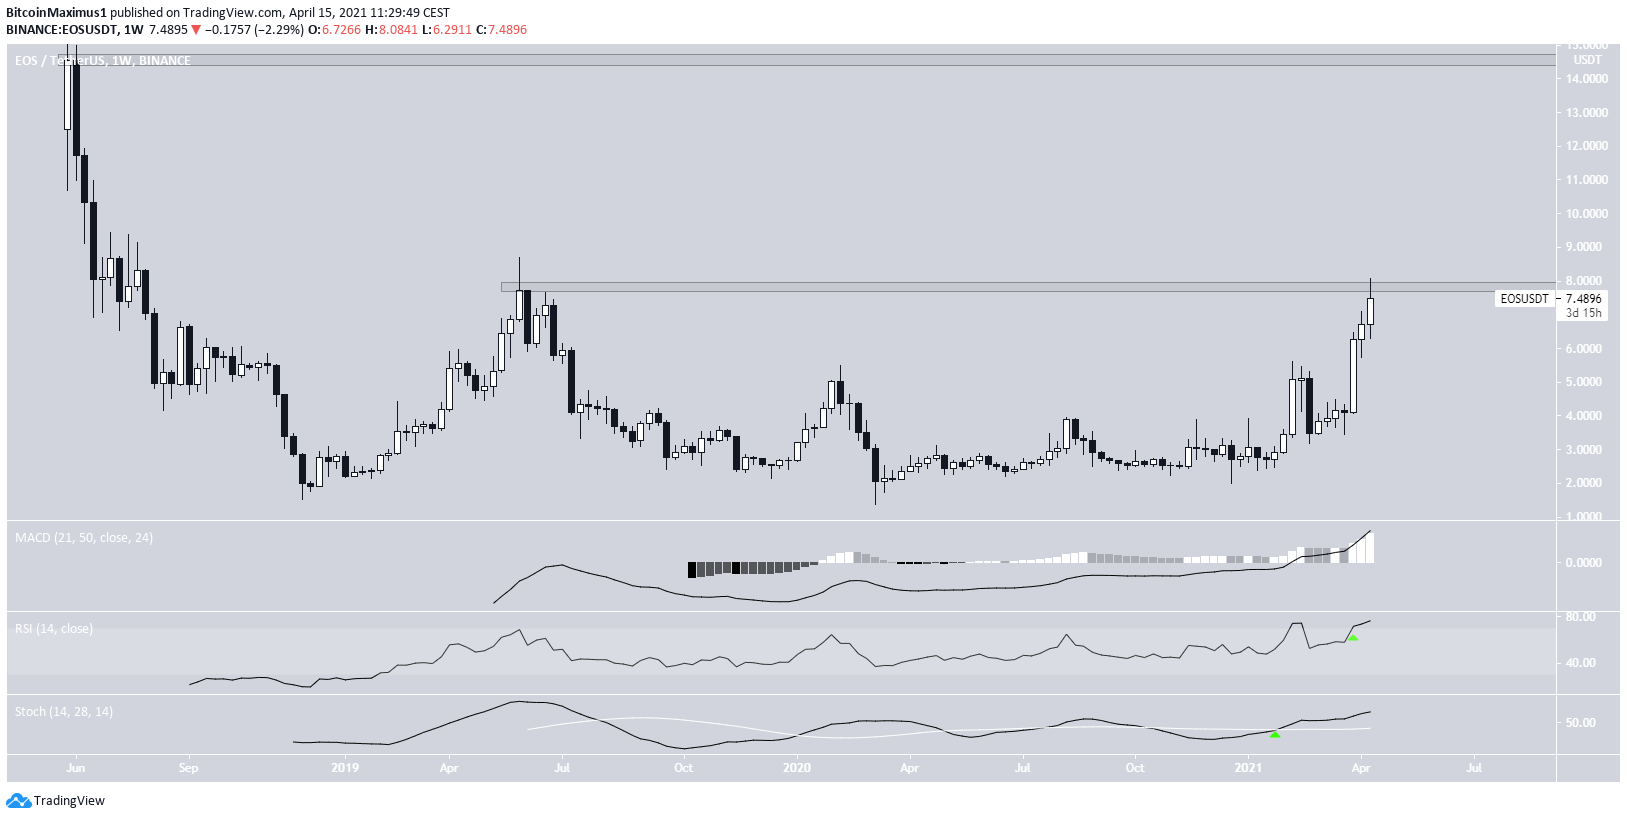
EOS has been increasing over the past three weeks. So far, it has reached the long-term $7.80 resistance area but was rejected. This is a strong horizontal resistance level that has been in place since April 2019.
Technical indicators are bullish, suggesting that EOS is likely to break out. This is especially evident by the RSI cross above 70.
If successful, the next resistance area would be found at $14.50.
Curve DAO Token (CRV)
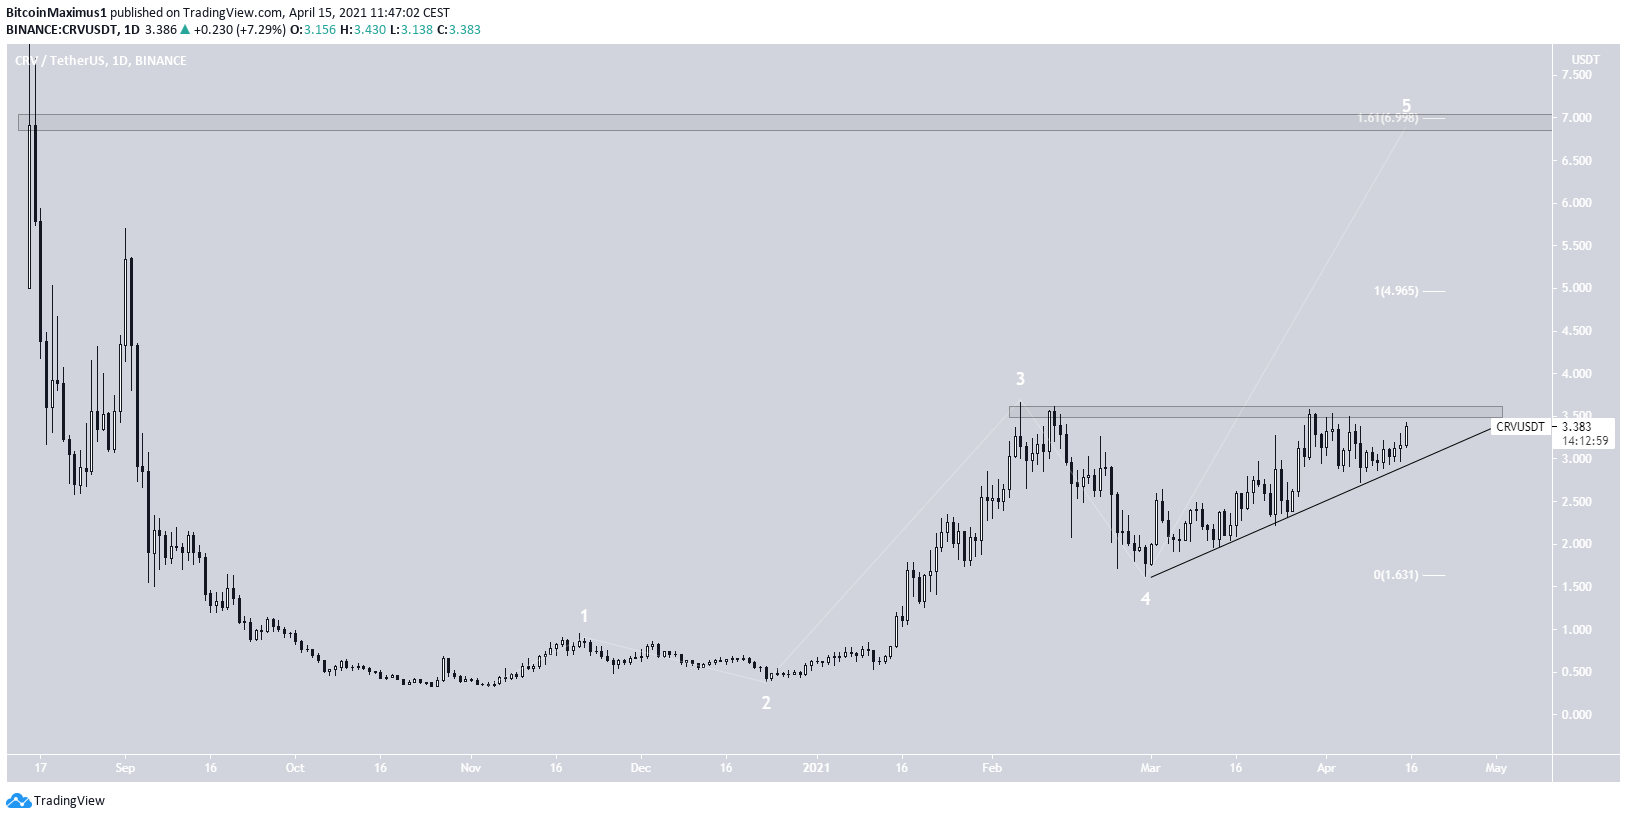
CRV has been moving upwards since Feb. 28, when it reached a low of $1.62. This looks to have been the bottom of a corrective wave four.
Since then, it’s been trading inside an ascending triangle, with a primary resistance at $3.50.
The two most likely targets for the top of wave five are found at $4.96 and $7.
For BeInCrypto’s latest bitcoin (BTC) analysis, click here.
Disclaimer
In line with the Trust Project guidelines, this price analysis article is for informational purposes only and should not be considered financial or investment advice. BeInCrypto is committed to accurate, unbiased reporting, but market conditions are subject to change without notice. Always conduct your own research and consult with a professional before making any financial decisions. Please note that our Terms and Conditions, Privacy Policy, and Disclaimers have been updated.


