


Bitcoin (BTC) is trading inside a descending parallel channel.
Ethereum (ETH) has broken down from an ascending wedge.
XRP (XRP) and Flow (FLOW) have broken out from descending resistance lines.
Axie Infinity (AXS) reached a new all-time high on July 15.
Zcash (ZEC) is following a descending resistance line.
BakeryToken (BAKE) is trading inside a symmetrical triangle.
BTC
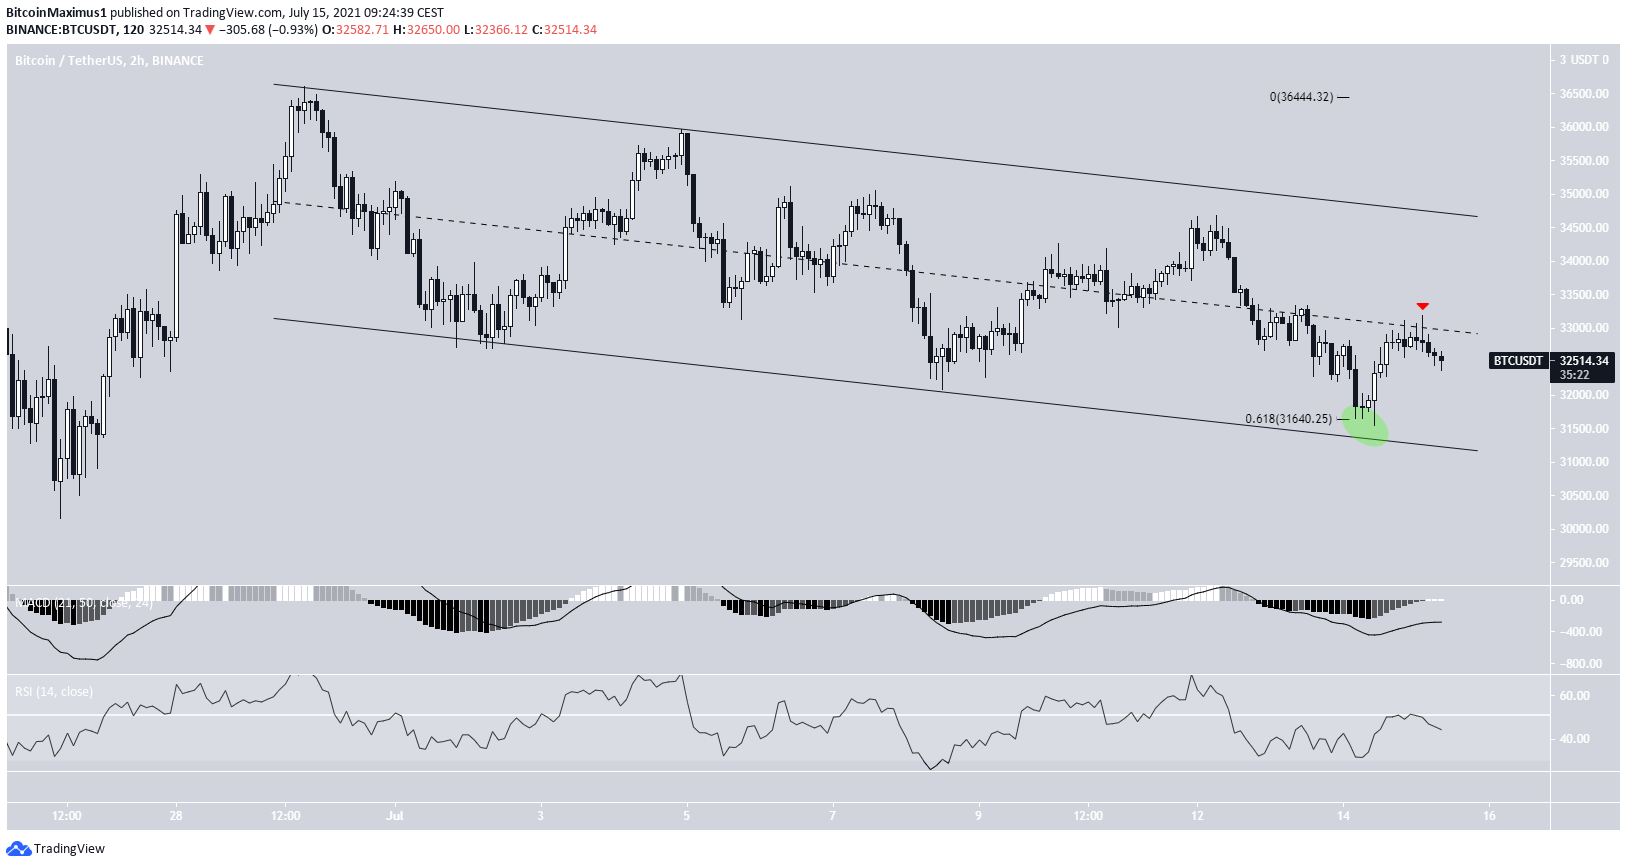
BTC has been trading inside a descending parallel channel since June 29. On July 14, it bounced at the support line of the channel and the 0.618 Fib retracement support level at $31,640 (green circle).
It has been moving upwards since, but has yet to reclaim the middle of the channel. Doing so would likely confirm that a breakout will occur.
In addition to this, it would cause the two-hour MACD and RSI to turn bullish.
ETH
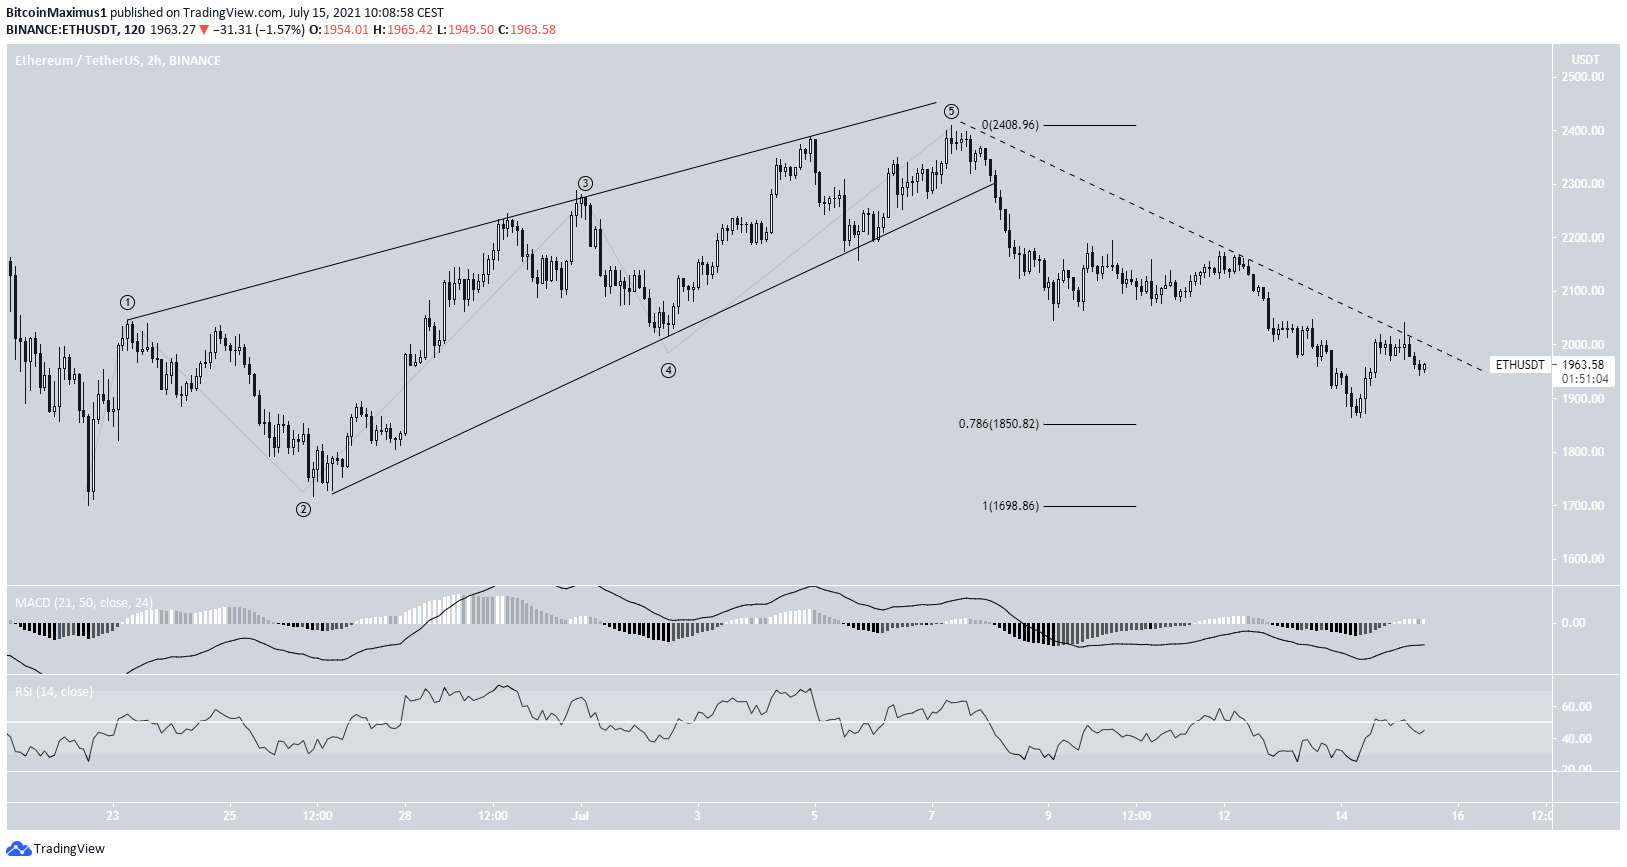
On July 7, ETH reached a high of $2,361. It has been moving downwards since, and broke down from an ascending wedge shortly afterwards. It’s likely that the wedge was a leading diagonal.
On July 14, it reached a low of $1,865 and bounced. The low was made very close to the 0.786 Fib retracement support level. The upward movement that followed appears to be impulsive (green).
ETH is potentially following a descending resistance line (dashed) but it’s still possible that it will eventually move toward the $2,880 horizontal resistance area.
XRP
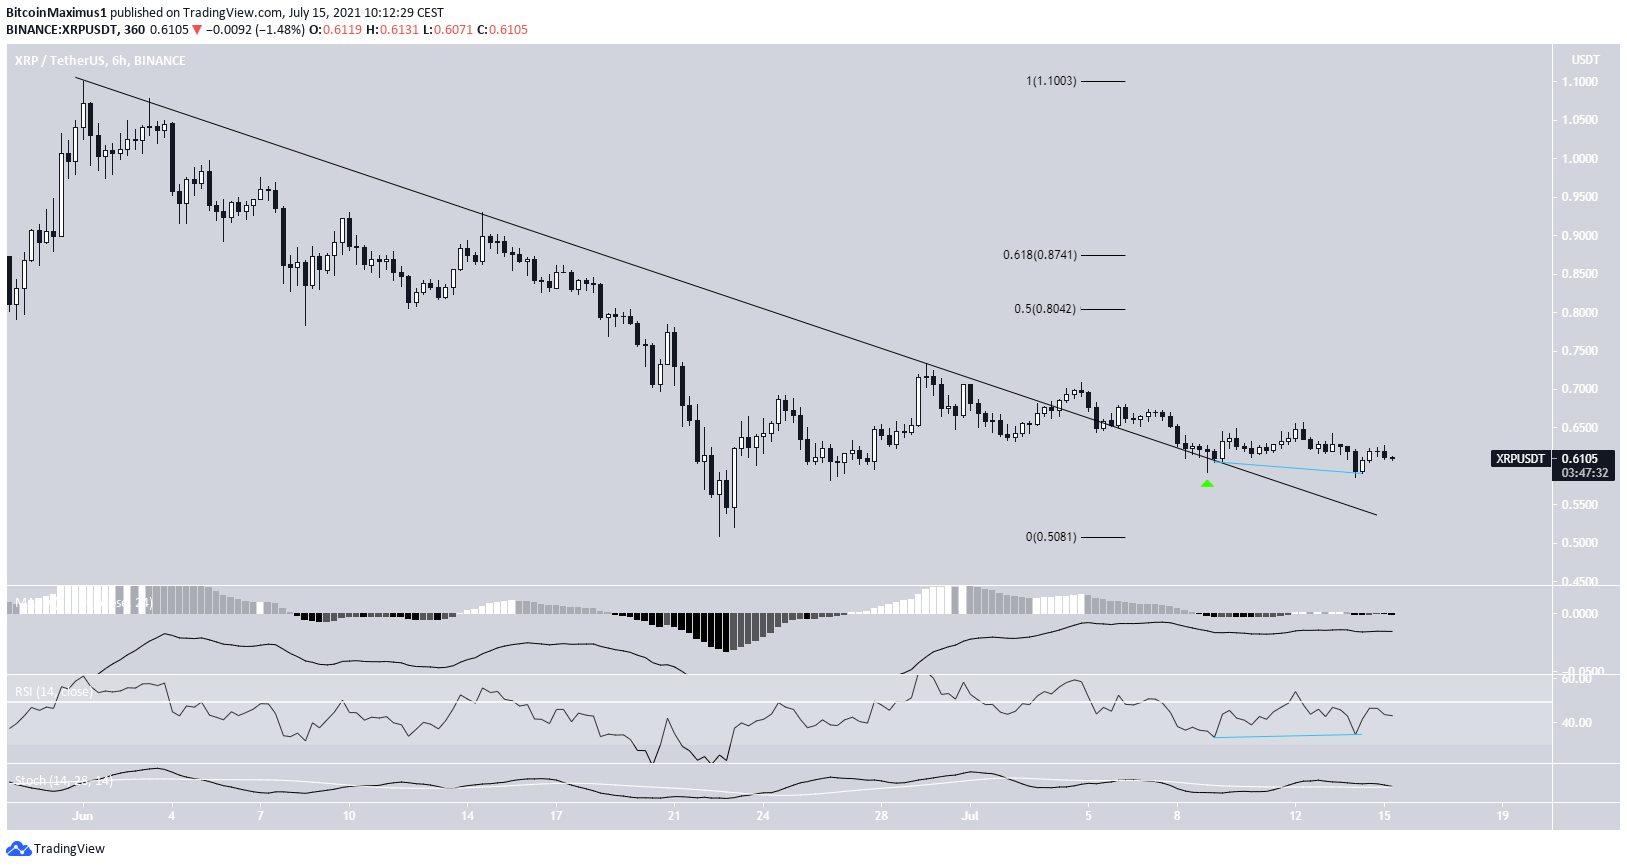
XRP had been following a descending resistance line since June 1. After numerous failed breakout attempts, it was finally successful in moving above the line on July 4.
It decreased afterwards and validated the line as support (green icon).
XRP has yet to move upwards, but the RSI has generated a bullish divergence.
The closest resistances are found at $0.80-$0.87 (0.5-0.618 Fib retracement resistance levels).
AXS
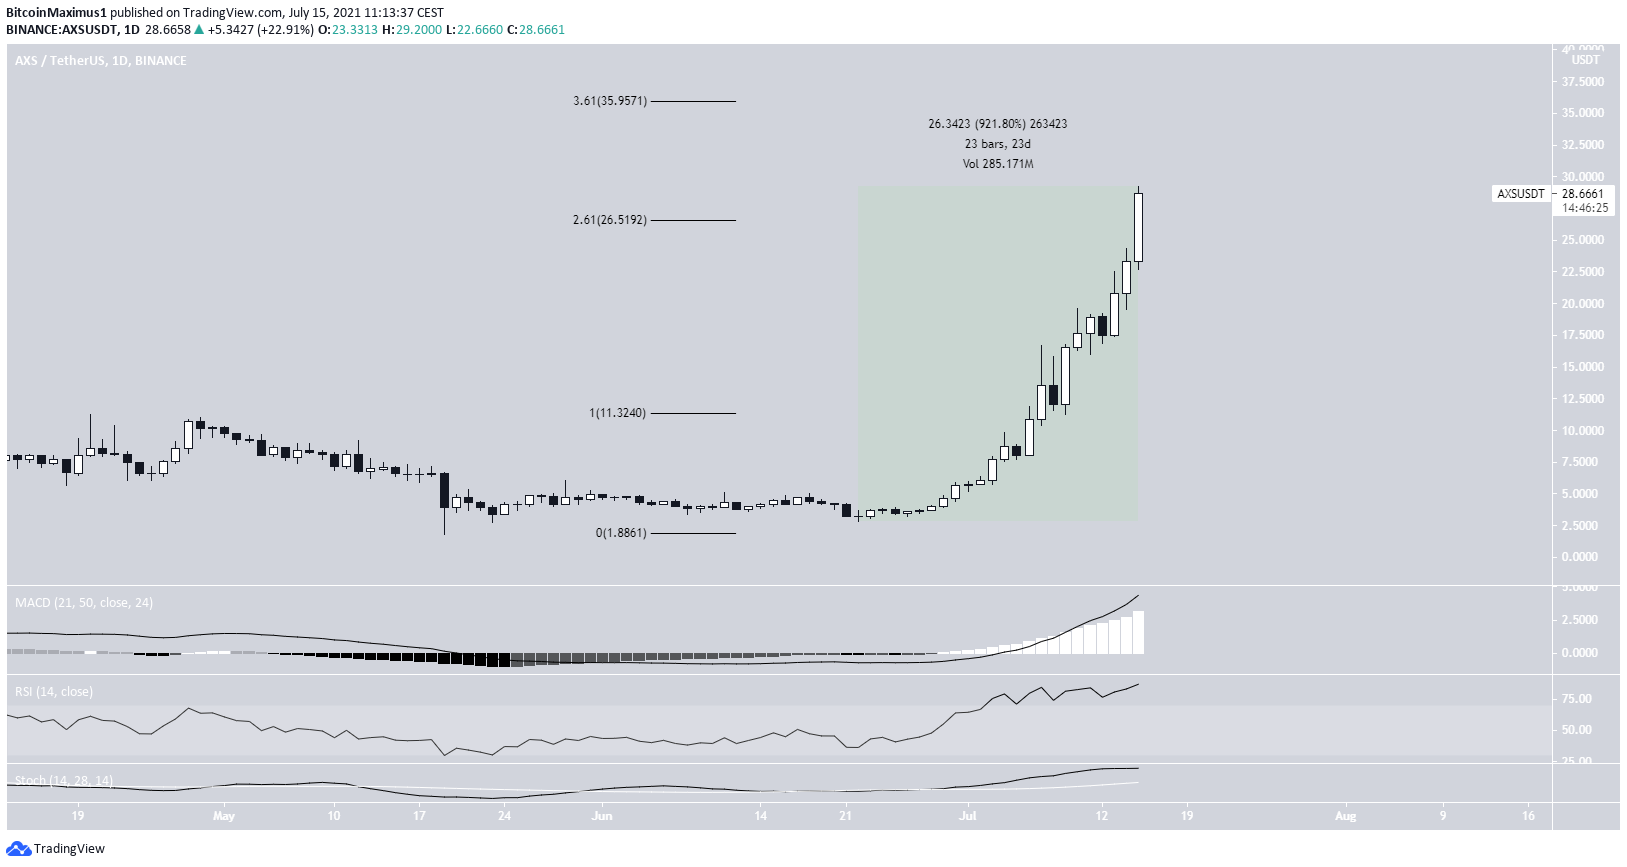
AXS has been moving upwards at an accelerated rate since June 22. In a span of 23 days, it has increased by 921%. This led to a new all-time high price of $29.20 being reached on July 15.
The high was made above the 2.61 external Fib retracement resistance level at $26.51. The next likely resistance area is found at $35.95. This target is the 3.61 external Fib retracement level.
There are no clear signs of weakness in the daily time-frame.
ZEC
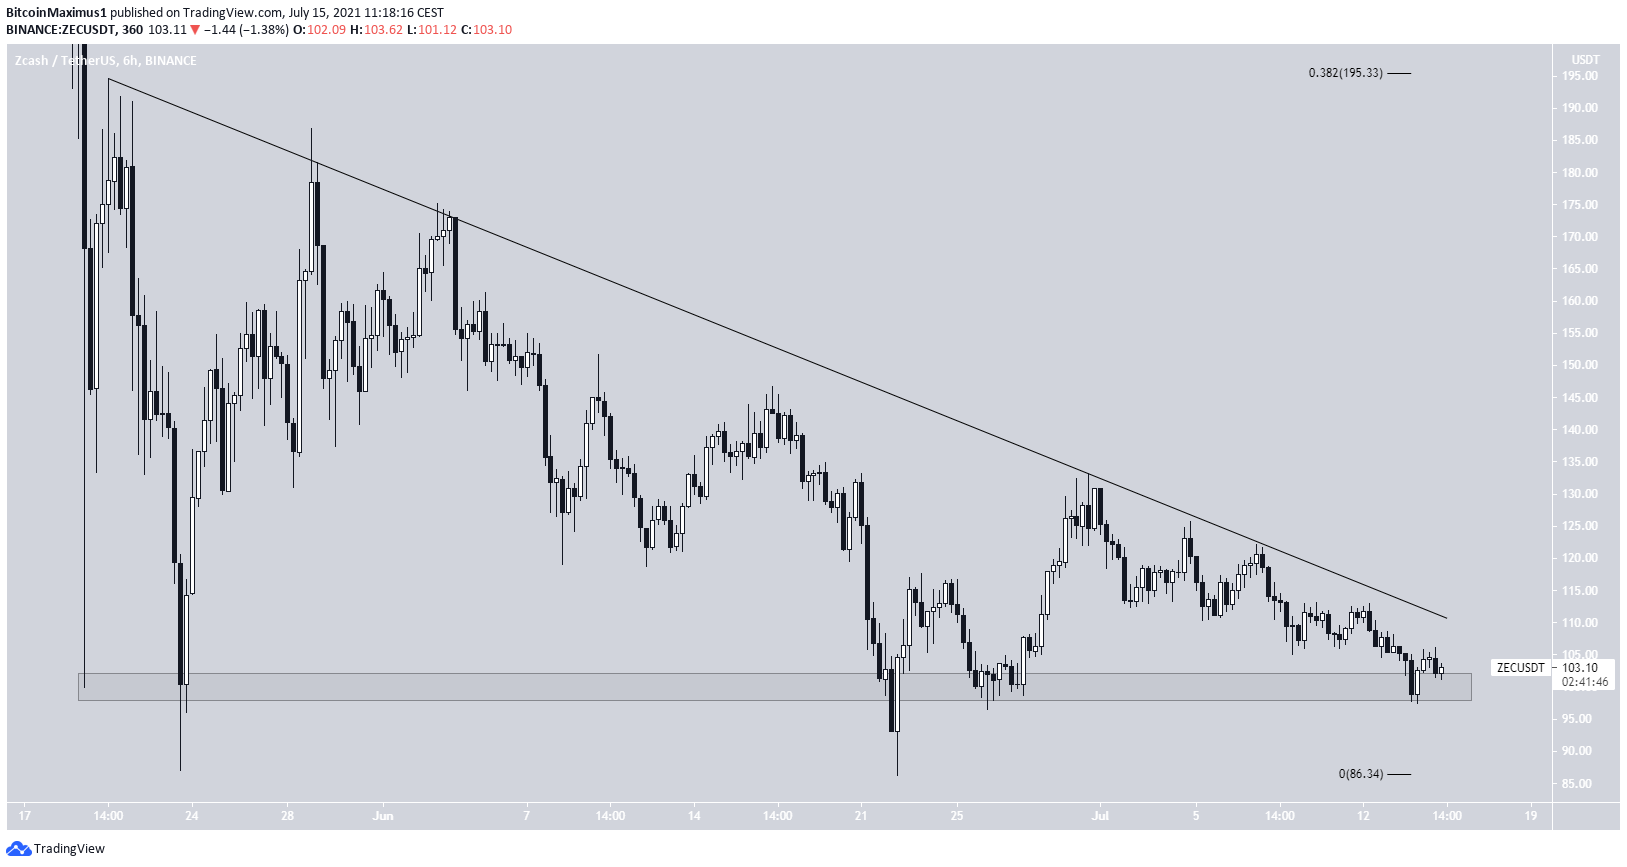
ZEC has been decreasing alongside a descending resistance line since May 20.
While following the line, it has bounced twice at the $100 horizontal support area, potentially completing a double bottom pattern.
It still has yet to break out above this descending resistance line. Until it does, the trend cannot be considered bullish.
The closest resistance area is found at $195.
FLOW
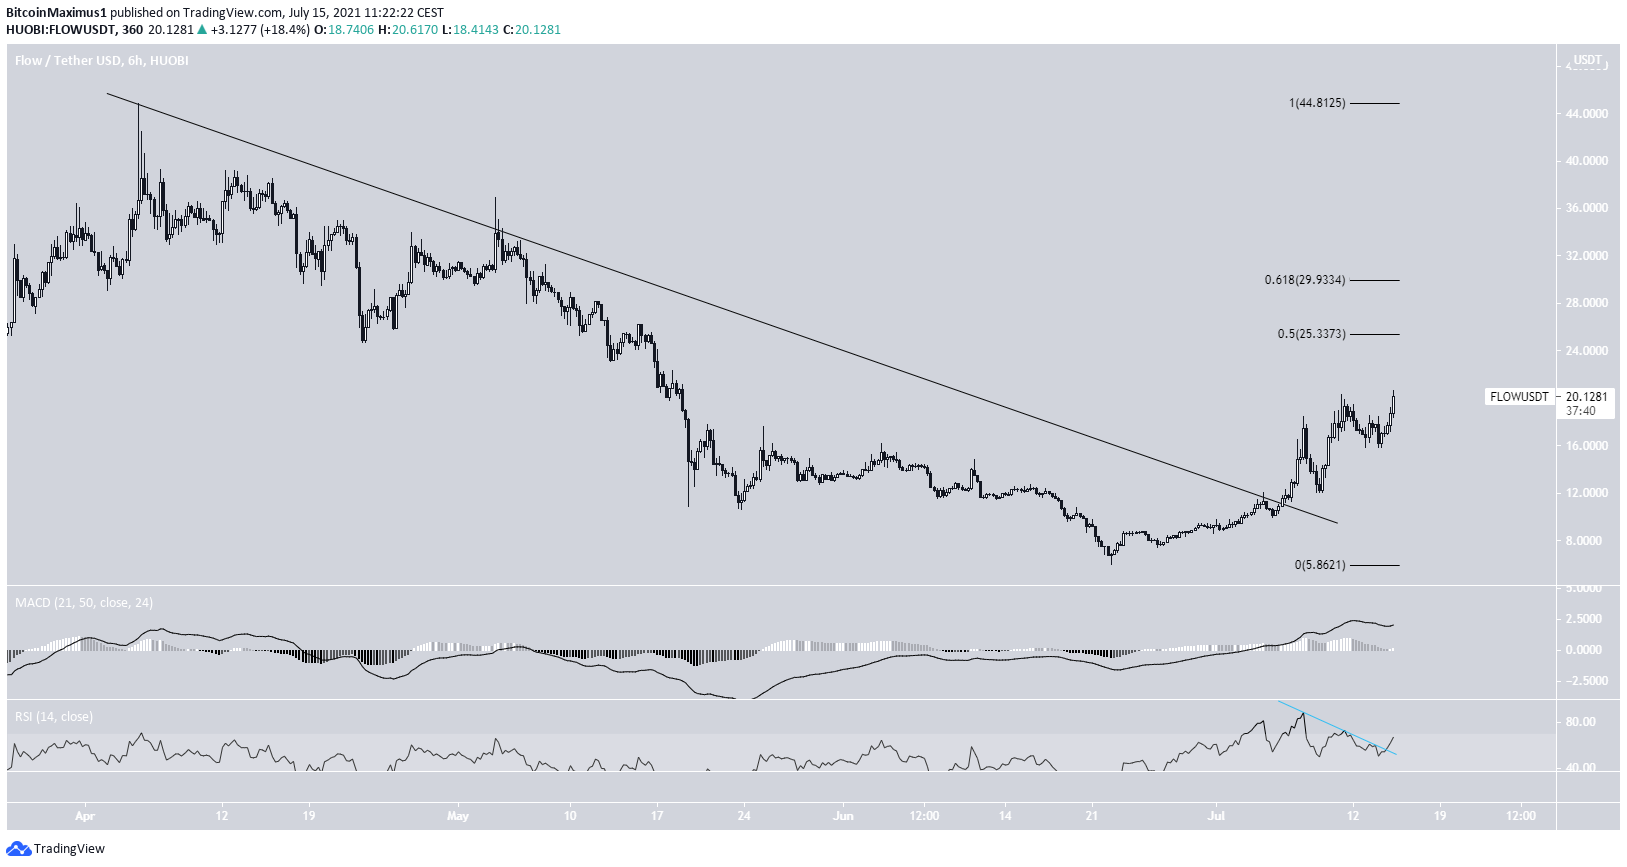
FLOW had been moving under a descending resistance line since April 5. It managed to break out on July 6, and so far has reached a high of $20.61 on July 15.
While the RSI initially generated a bearish divergence, its trendline has been broken. The MACD is also bullish.
The next resistances are found at $25.33 and $29.93. These are the respective 0.5 and 0.618 Fib retracement resistance levels.
BAKE
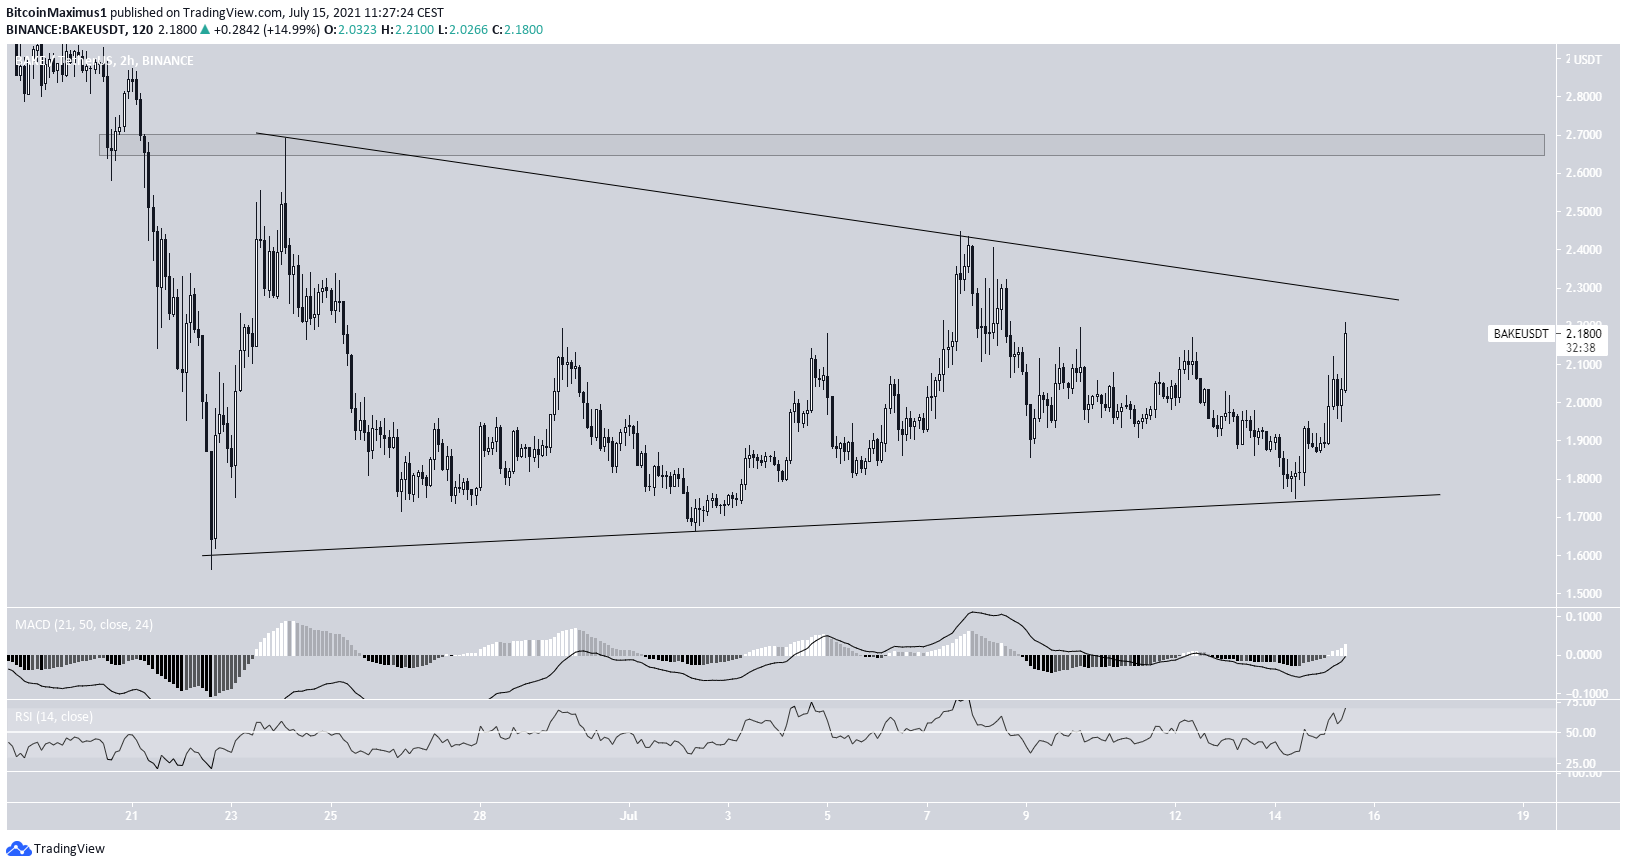
BAKE has been trading inside a symmetrical triangle since June 22. The triangle is often considered a neutral pattern.
Technical indicators in short-term timeframes are bullish. The RSI is above 50 and the MACD is above 0.
If a breakout occurs, the closest resistance would be found at $2.65.
For BeInCrypto’s latest bitcoin (BTC) analysis, click here.


