


Bitcoin (BTC) has decreased considerably but bounced at the $48,000 area.
Ethereum (ETH) is approaching a long-term resistance level.
XRP (XRP) has broken out from a descending resistance line.
Travala (AVA) is following an ascending support line.
Chiliz (CHZ) is trading inside a long-term descending parallel channel.
Monero (XMR) reached a new all-time high price on May 7 but has been decreasing since.
Digibyte (DGB) has returned to the $0.01 support area.
Bitcoin (BTC)
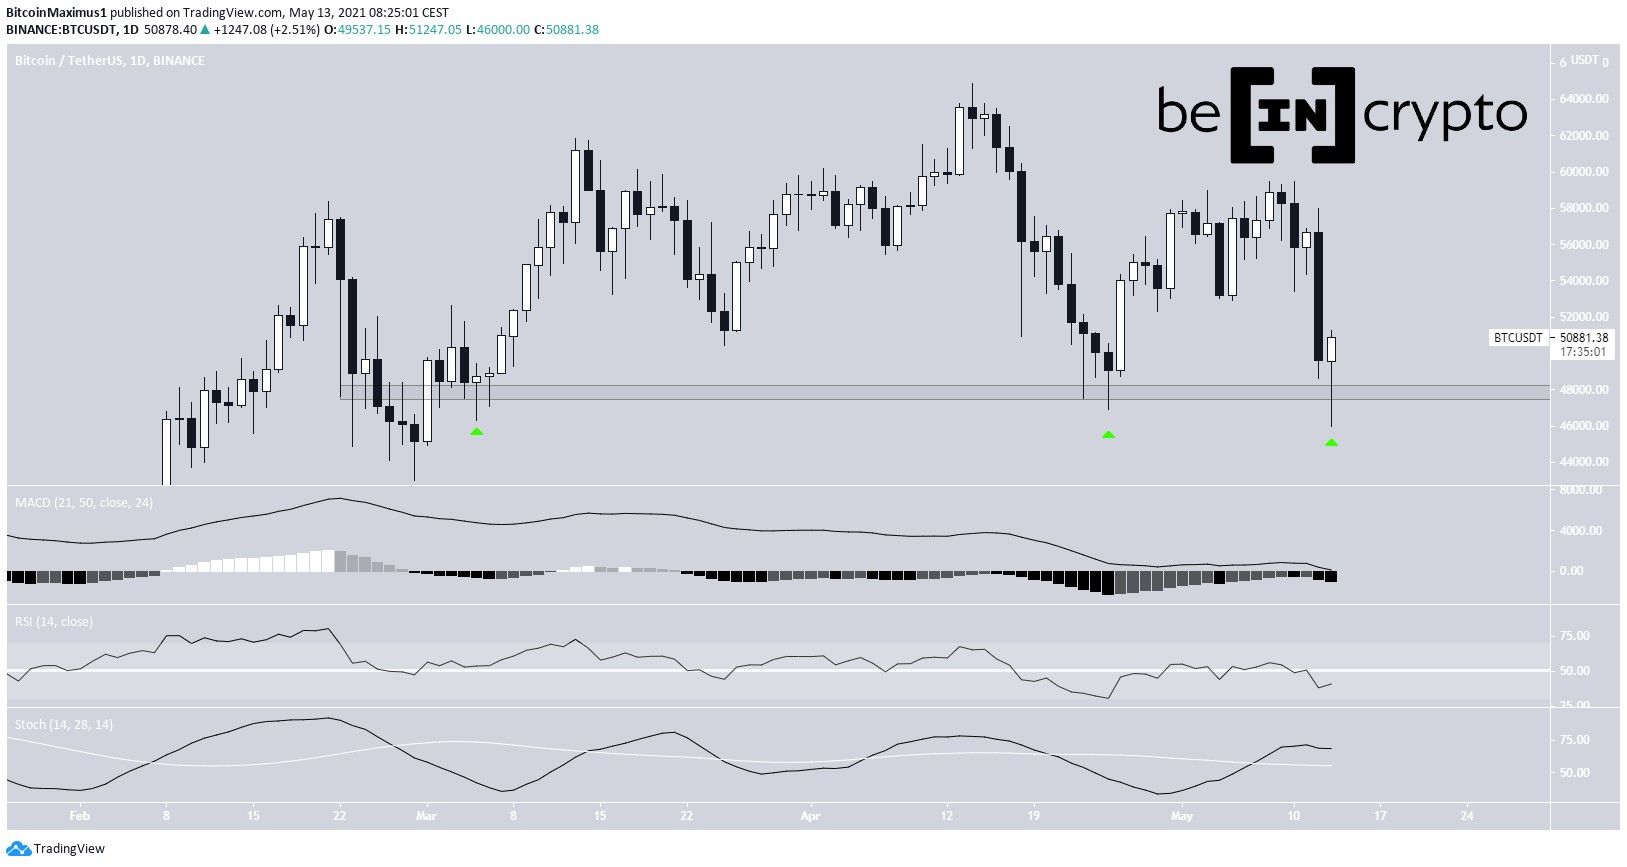
BTC decreased considerably on May 12, falling to a low of $48,000. The decrease continued into the early hours of May 13.
While the price reached a low of $46,000, it has since bounced back and reclaimed the $48,000 area.
BTC is in the process of creating a hammer candlestick, which is normally considered a bullish reversal sign.
However, it’s possible that the price will eventually make another low before moving upwards once more.
ETH/BTC
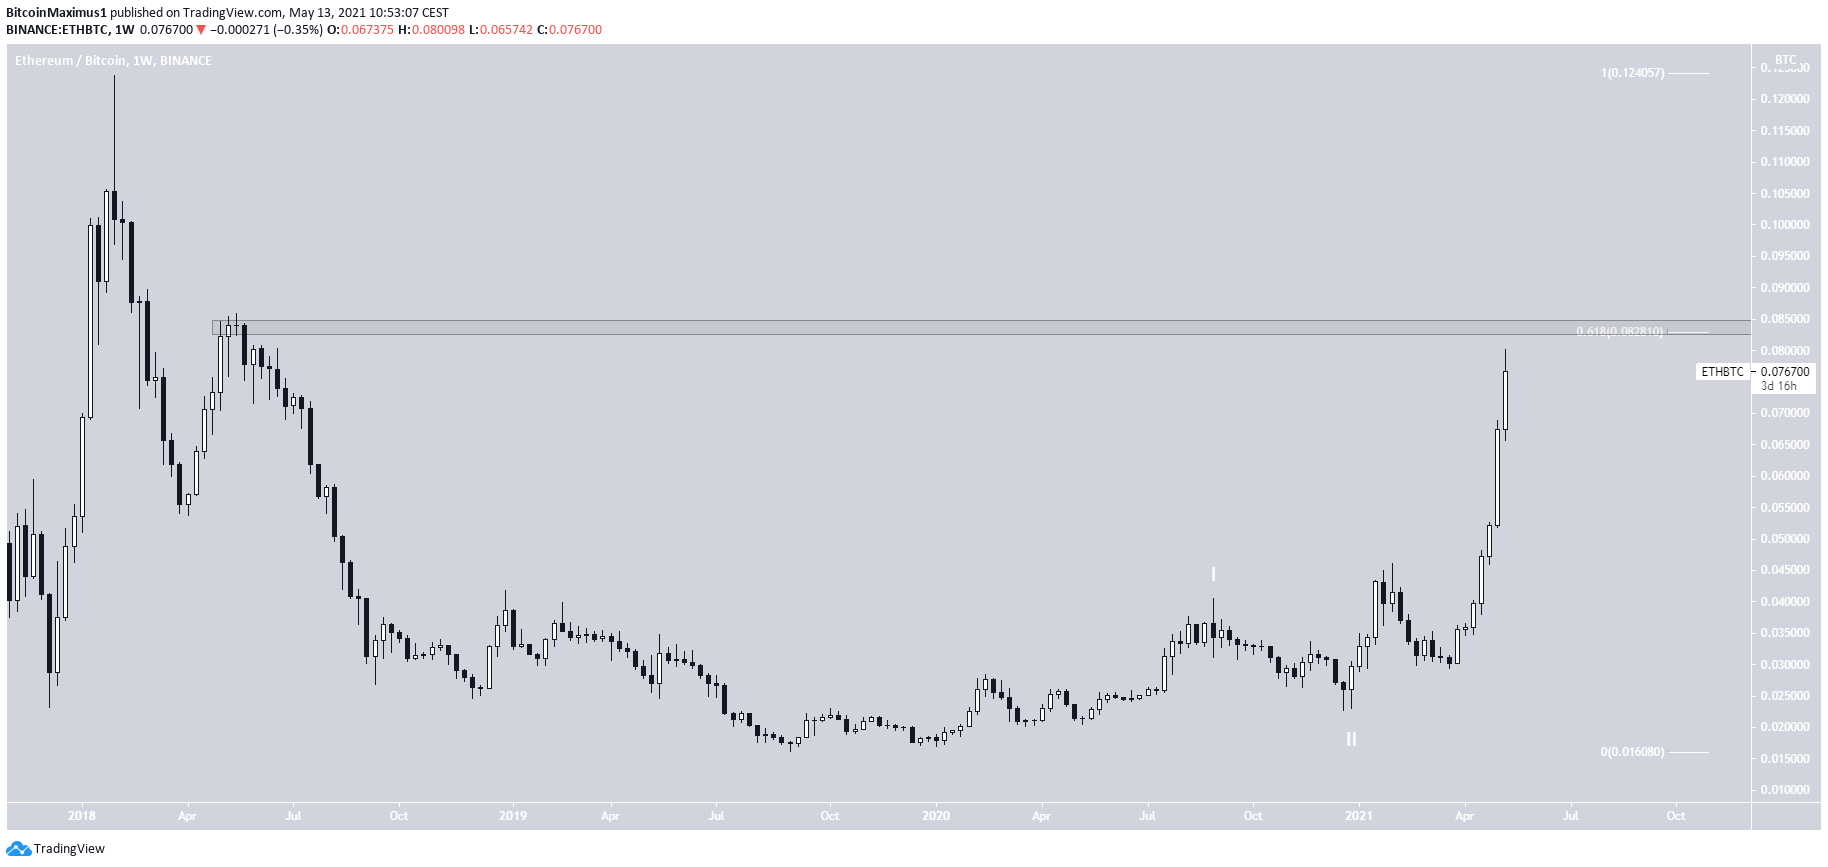
ETH/BTC has increased considerably over the past seven weeks. However, it’s approaching a crucial resistance level at ₿0.082, created by the 0.618 Fib retracement level. In addition, it’s a horizontal resistance area created by the highs of April 2018.
While the trend is clearly bullish, some type of rejection is to be expected if it reaches this resistance.
The ETH/USD pair is also likely nearing a local top.
XRP/BTC
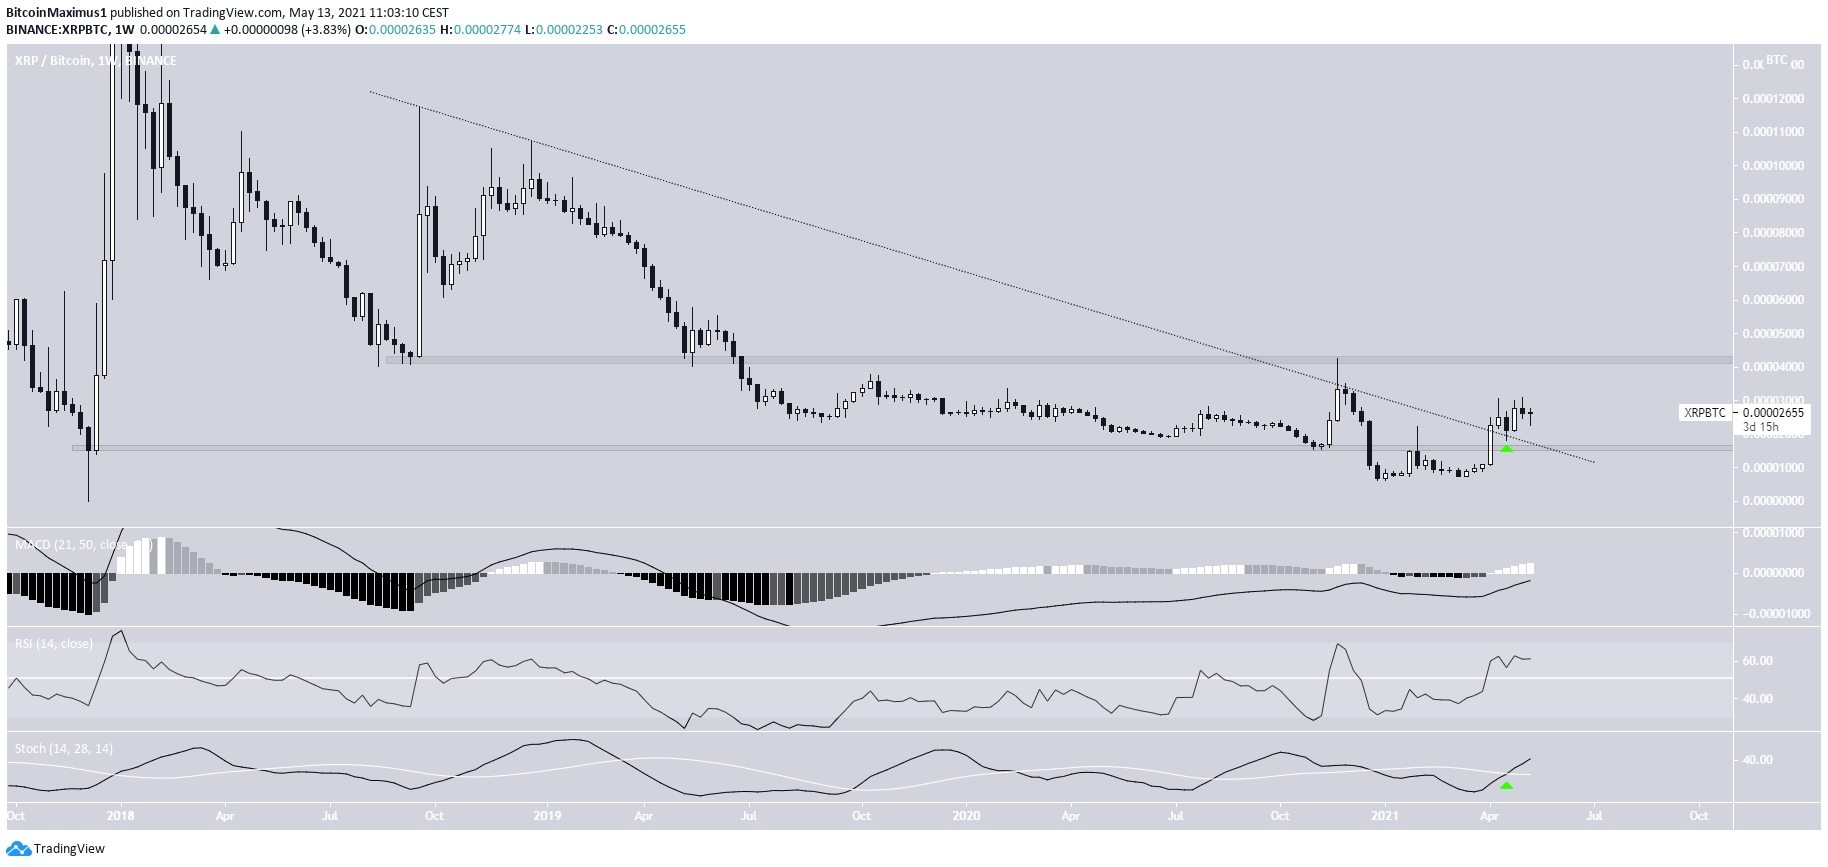
XRP had been following a descending resistance line since September 2018. On April 10, it managed to break out and then validated it as support afterward (green arrow).
Prior to the breakout, the token also reclaimed the 1,600 satoshi horizontal area.
Technical indicators are bullish, supporting the continuation of the upward movement. This is especially visible by the MACD movement above the 0-line and the bullish cross in the Stochastic oscillator.
The next closest resistance area is found at 4,200 satoshis.
XRP/USD is also expected to continue increasing.
Travala (AVA)
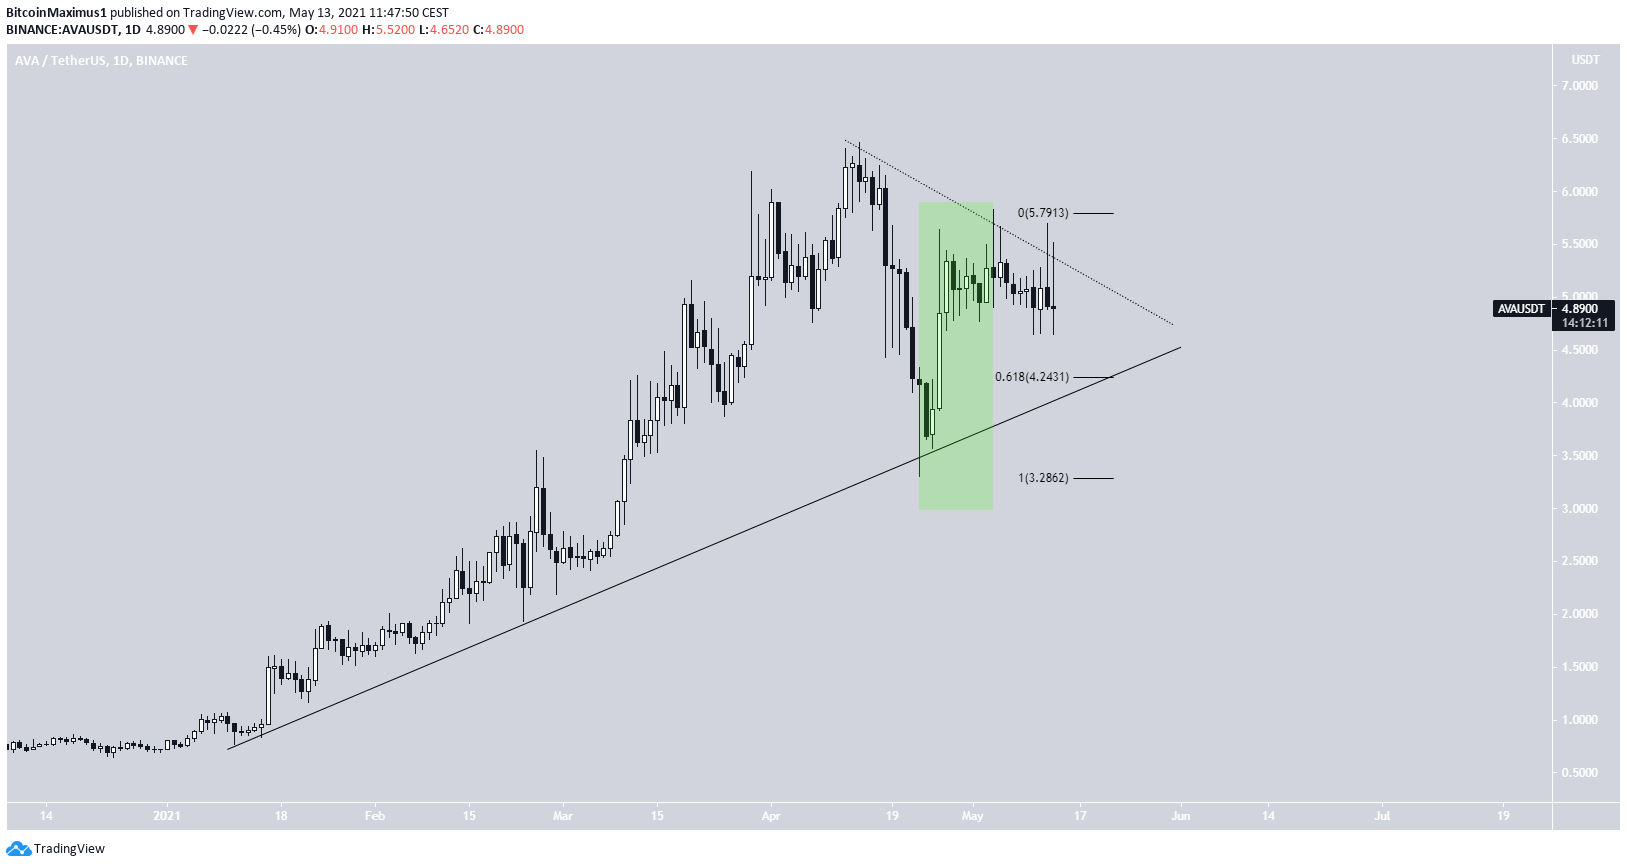
AVA began a downward movement on April 14 after it reached an all-time high price of $6.46. On April 23, it reached a low of $3.30 before bouncing. The low was made right at a long-term ascending support line that had been in place since January 2021.
The movement off the lows does look like the beginning of a new impulse (highlighted in green).
There is strong support at $4.25, created by the 0.618 Fib retracement level and the long-term ascending support line.
Therefore, the price is likely to bounce near this level and move upwards. A breakout above the short-term descending resistance line (dotted) could confirm that the price is heading higher.
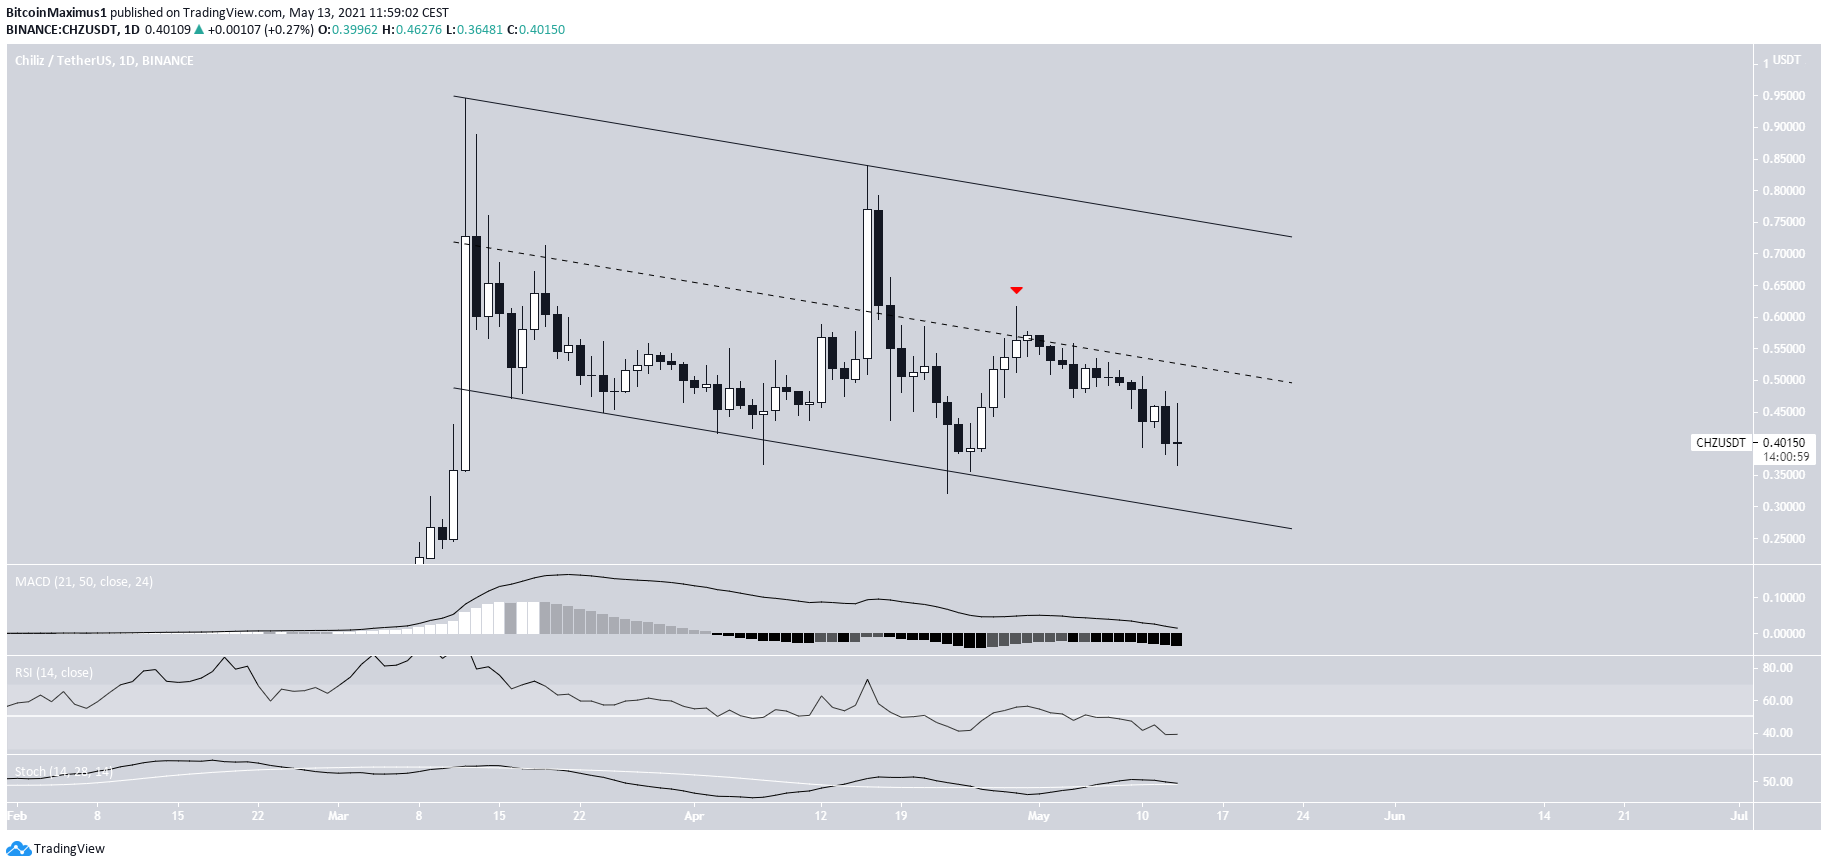
Chiliz (CHZ)
CHZ has been moving downward since reaching an all-time high price of $0.944 on March 12. Since then, it has been trading inside a descending parallel channel.
Currently, it’s in the lower portion of this channel and has been there since being rejected by the midline on April 29.
Despite technical indicators being neutral, parallel channels usually contain corrective movements.
Therefore, an eventual breakout from this pattern would be likely after another retest of the support line.
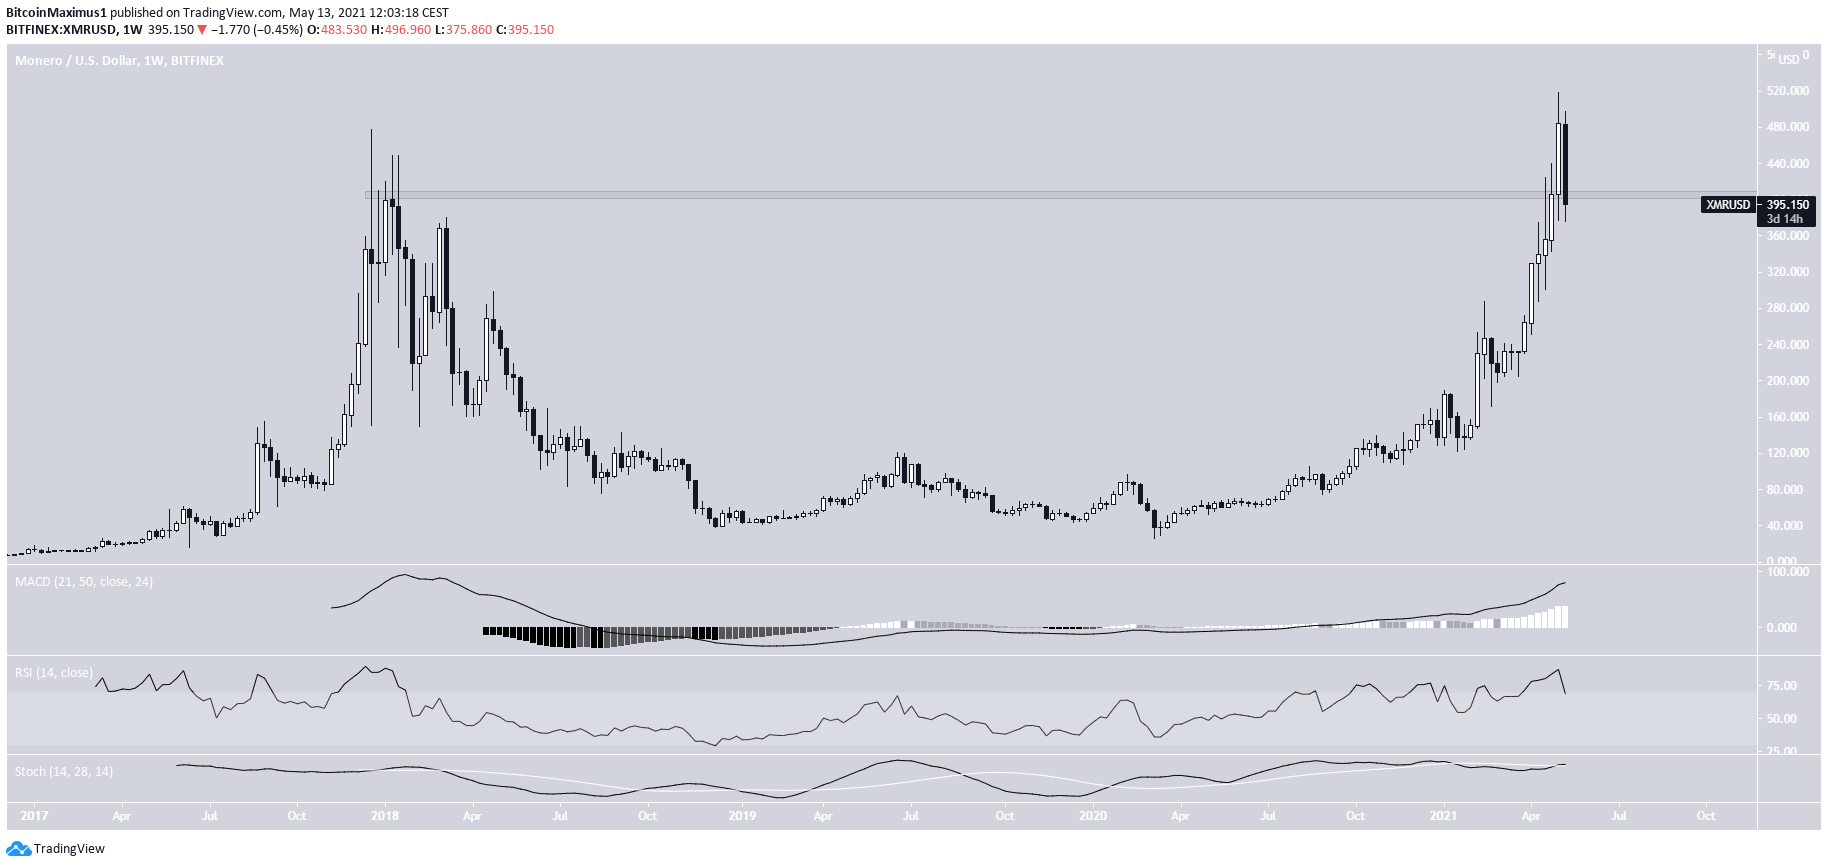
Monero (XMR)
XMR reached a new all-time high price of $518.67 on May 7. It’s currently in the process of potentially creating a bearish engulfing candlestick on the weekly time frame.
However, it’s still trading near the $400 area, which is the closing price of the previous all-time high level.
In addition, technical indicators are bullish.
Therefore, XMR is expected to bounce near this level and begin to move upwards.
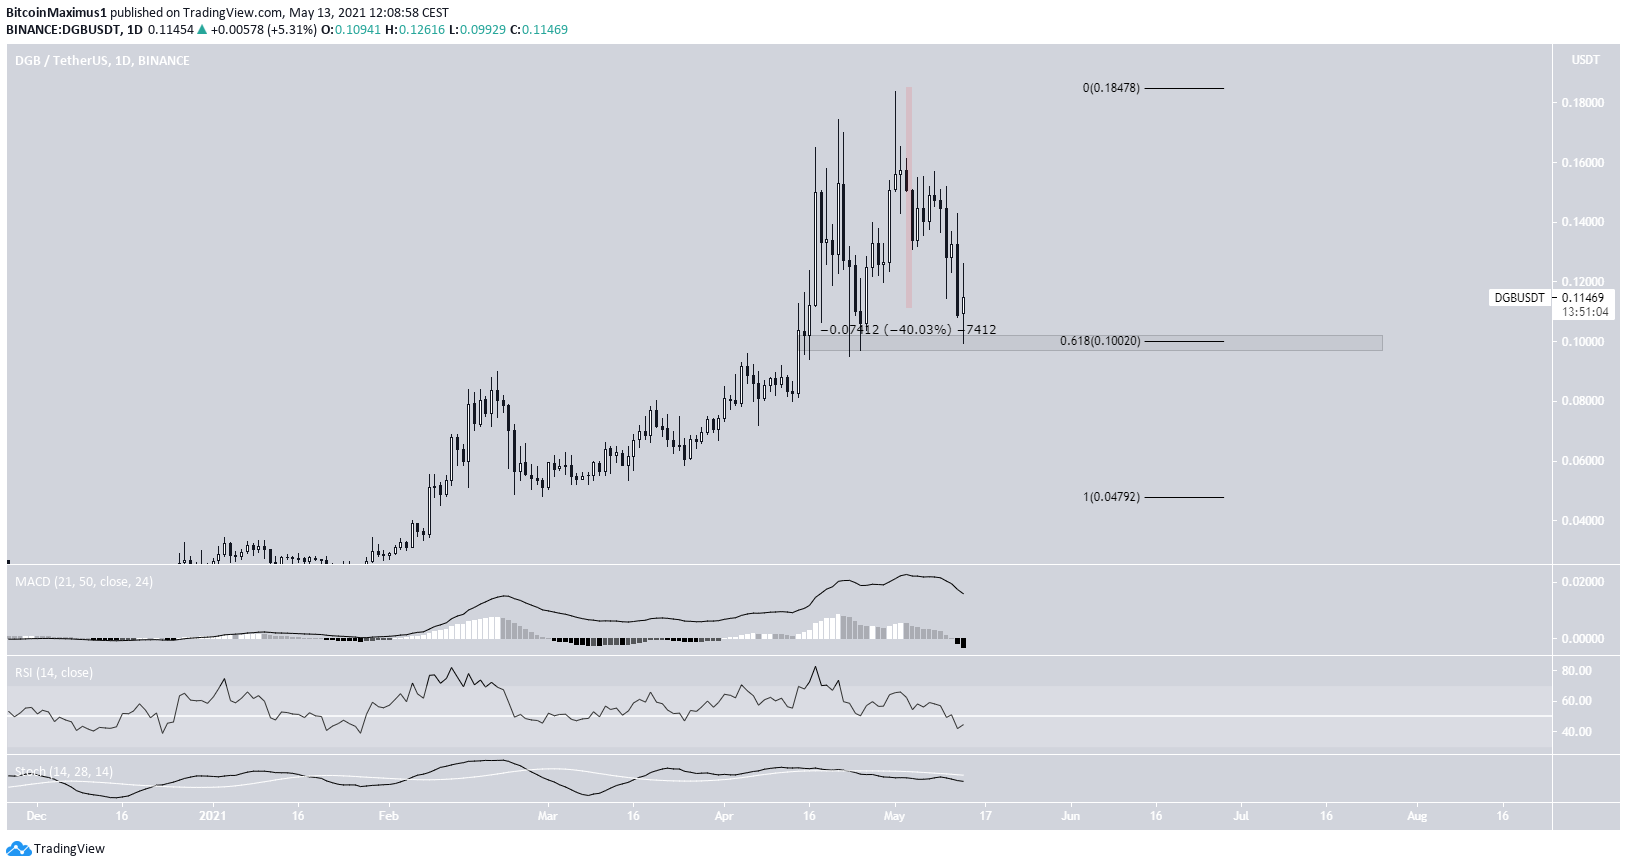
Digibyte (DGB)
DGB has been decreasing since May 1, when it reached a high of $0.184. So far, it has moved downwards by 40%.
On May 13, it reached the $0.10 support area, which is the 0.618 Fib retracement level.
However, the bounce has been weak and technical indicators do not show any signs of a reversal.
A breakdown below this level could trigger a sharp drop.
For BeInCrypto’s latest bitcoin (BTC) analysis, click here.


