


The bitcoin (BTC) price has been moving downwards, since reaching a new all-time high price on April 14.
Despite the drop, BTC is approaching a confluence of support levels that are expected to initiate a sizeable bounce.
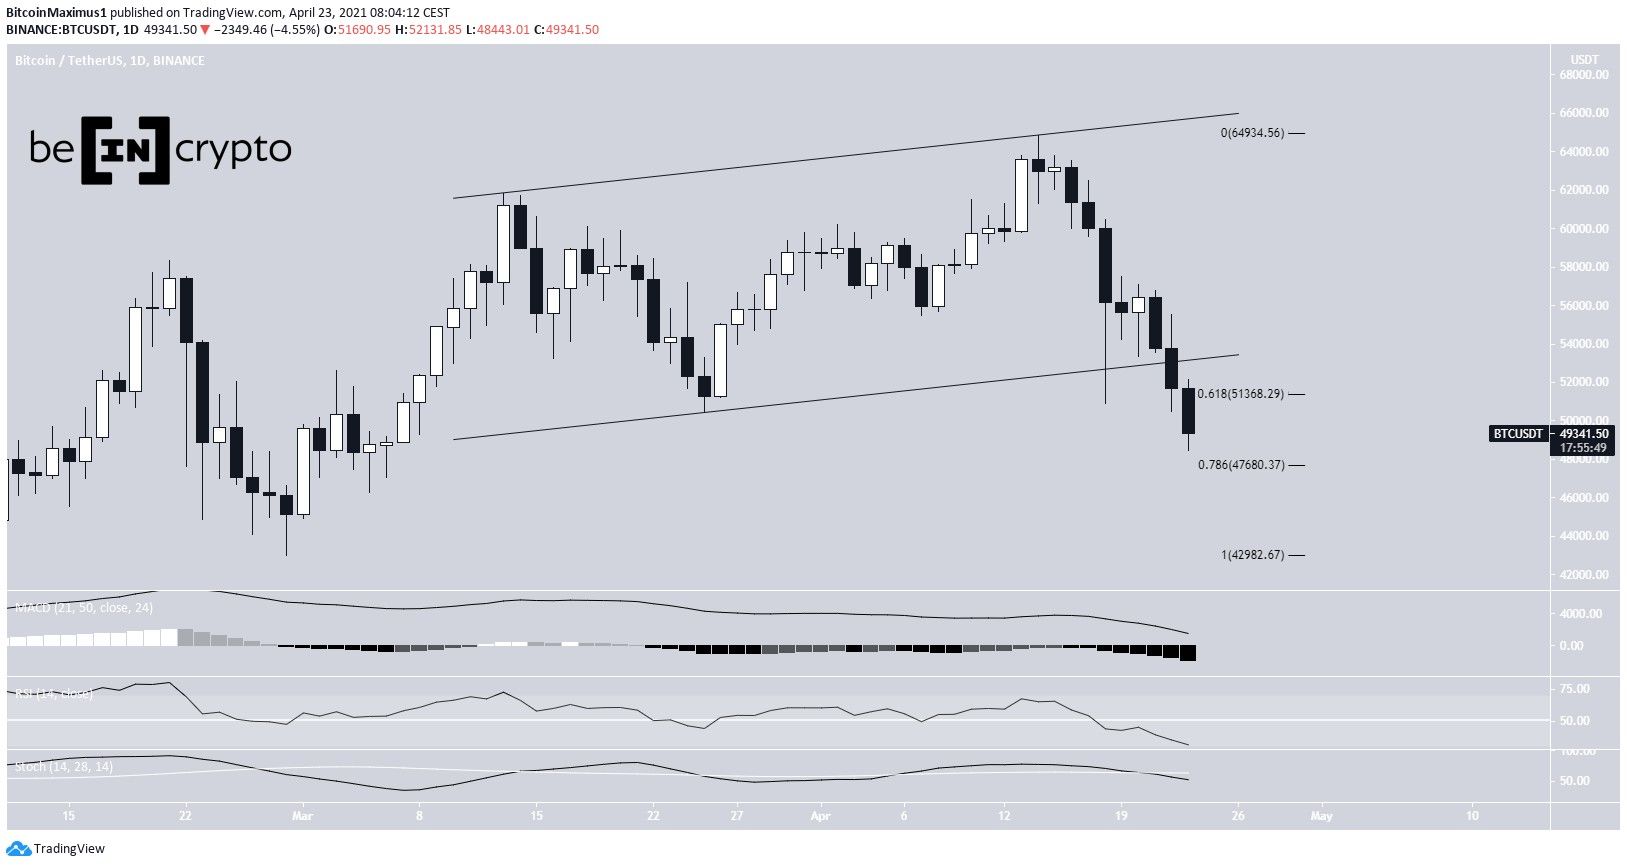
BTC breaks down from channel
BTC has been moving downwards, since April 14. The decrease accelerated on April 18, taking the price down to the support line of an ascending parallel channel.
After a weak bounce, BTC broke down from the channel, yesterday. Afterwards, it fell below the 0.618 retracement support at $51,368, an area which could now act as resistance.
Technical indicators in the daily time-frame are bearish. The Stochastic Oscillator has made a bearish cross while the RSI has dropped below 50. Furthermore, the MACD is negative.
The next support is found at $47,680, created by the 0.786 Fib retracement support.
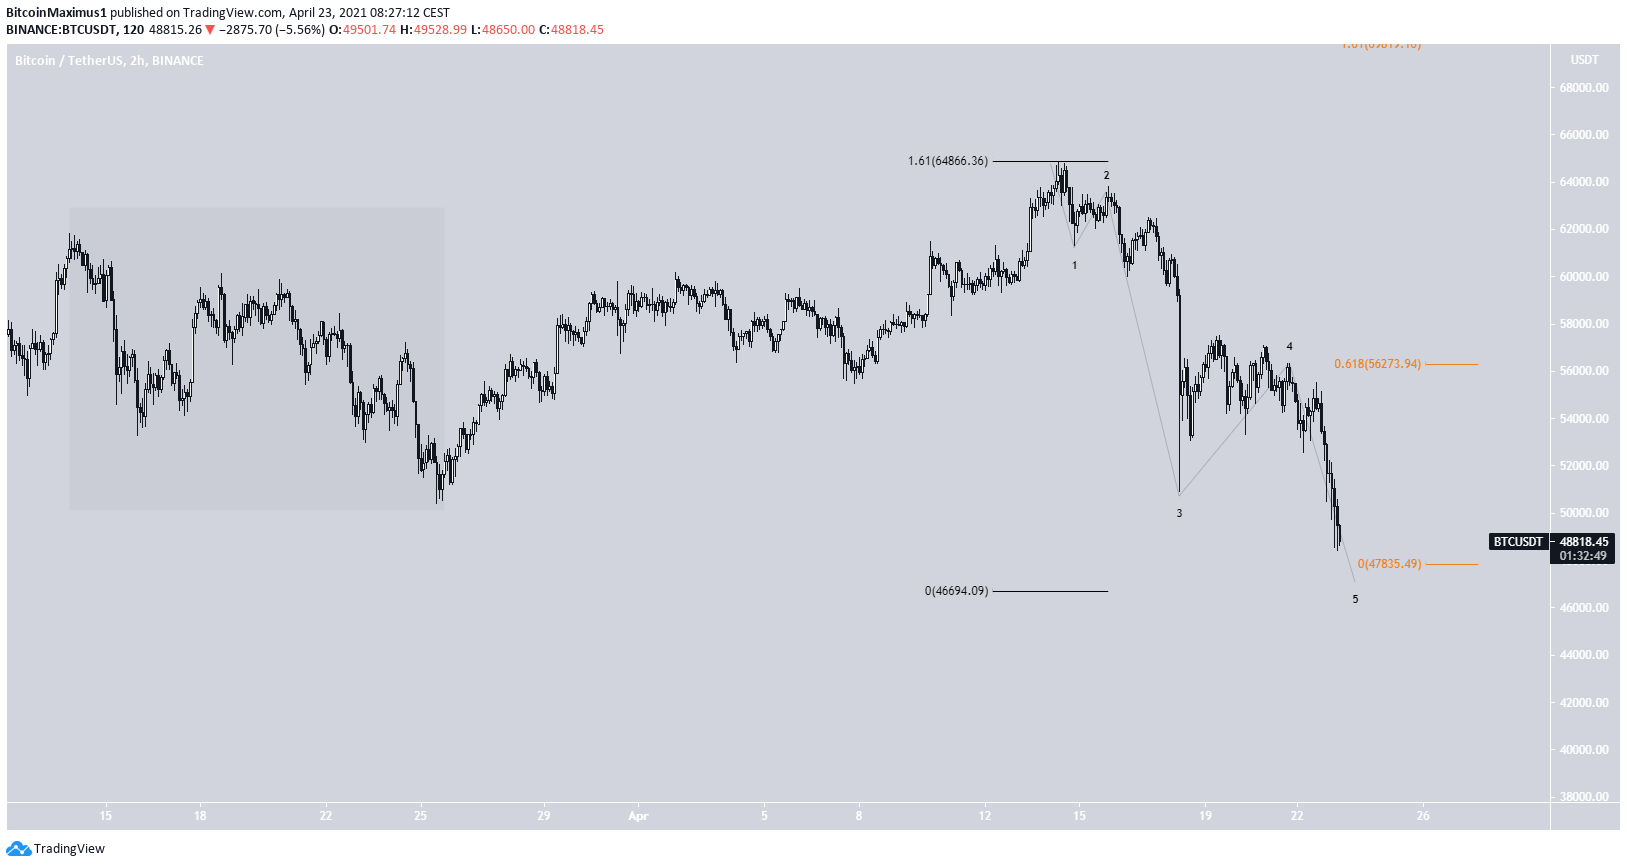
Ongoing BTC drop
Using Fib levels on the most recent drop also aligns with the target from the previous chart.
The ongoing decrease from the all-time high looks like a bearish impulse. If so, the price is currently in the fifth wave.
Using the 1.61 Fib projection on the previous drop (outlined in black) provides a target of $46,700. Using the 0.618 Fib projection on the first portion of the current drop (orange) provides a target of $47,835.
Both of these align with the 0.786 Fib support from the previous image. Therefore, it is likely that BTC will soon reach a bottom and initiate a sizeable bounce.
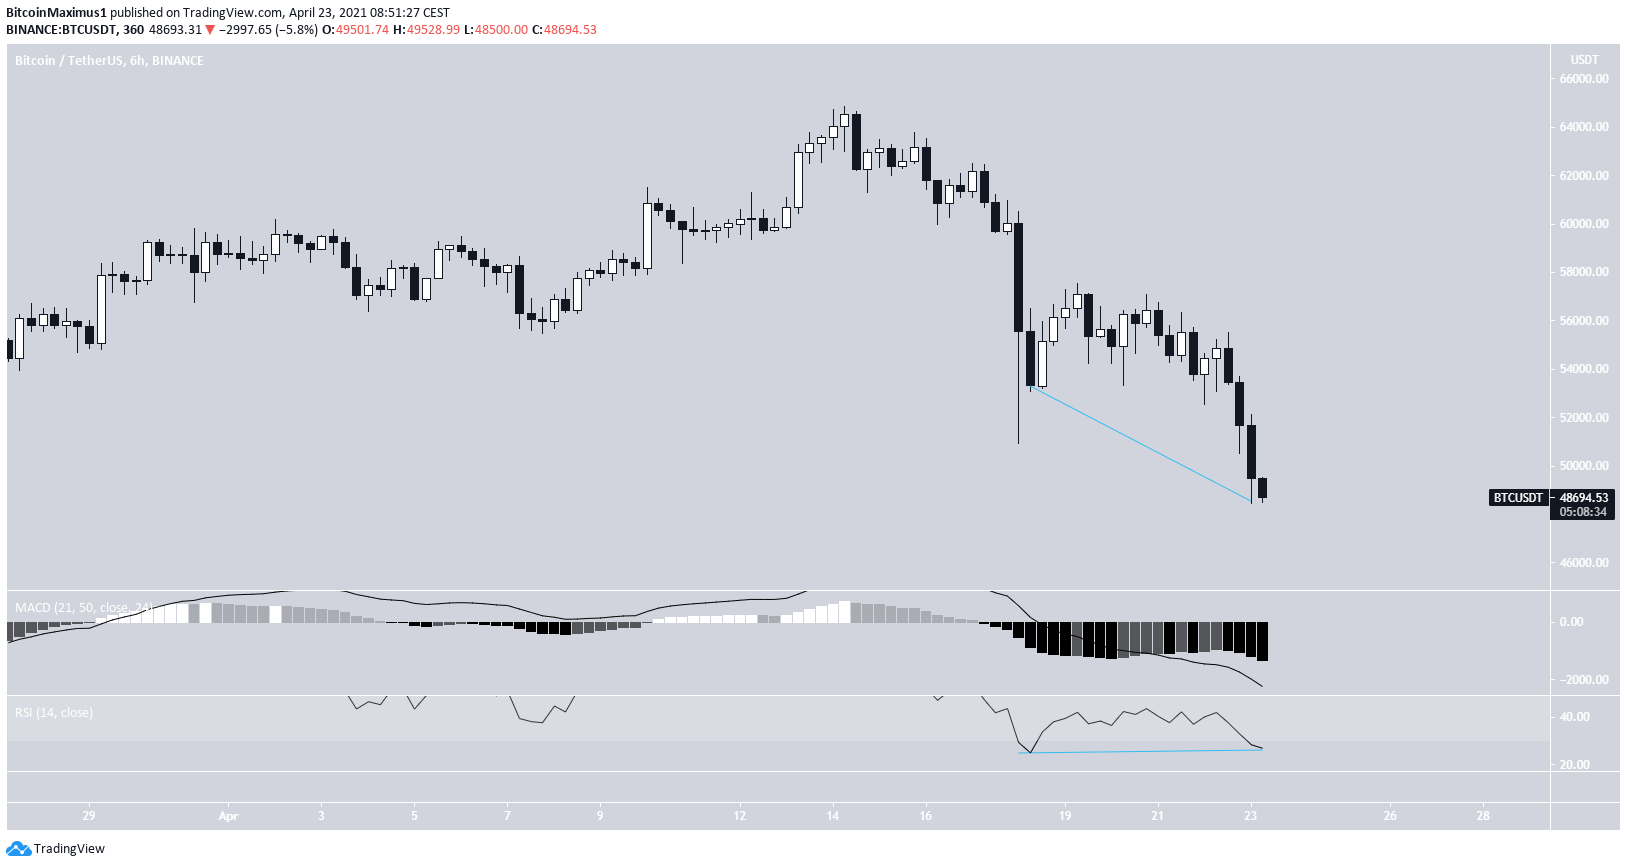
Short-term movement
The shorter-term six-hour chart shows a potential bullish divergence in the oversold RSI. While it has not yet been confirmed, it is likely to do so in the next close.
Furthermore, the MACD signal line is the lowest it has been during the year.
The even shorter-term two-hour chart aligns with this possibility, since it shows another bullish divergence, this time in both the RSI and the MACD.
Therefore, BTC is expected to initiate a sizeable bounce soon, taking it towards the $54,710 resistance area, which is the 0.382 Fib retracement of the entire drop.
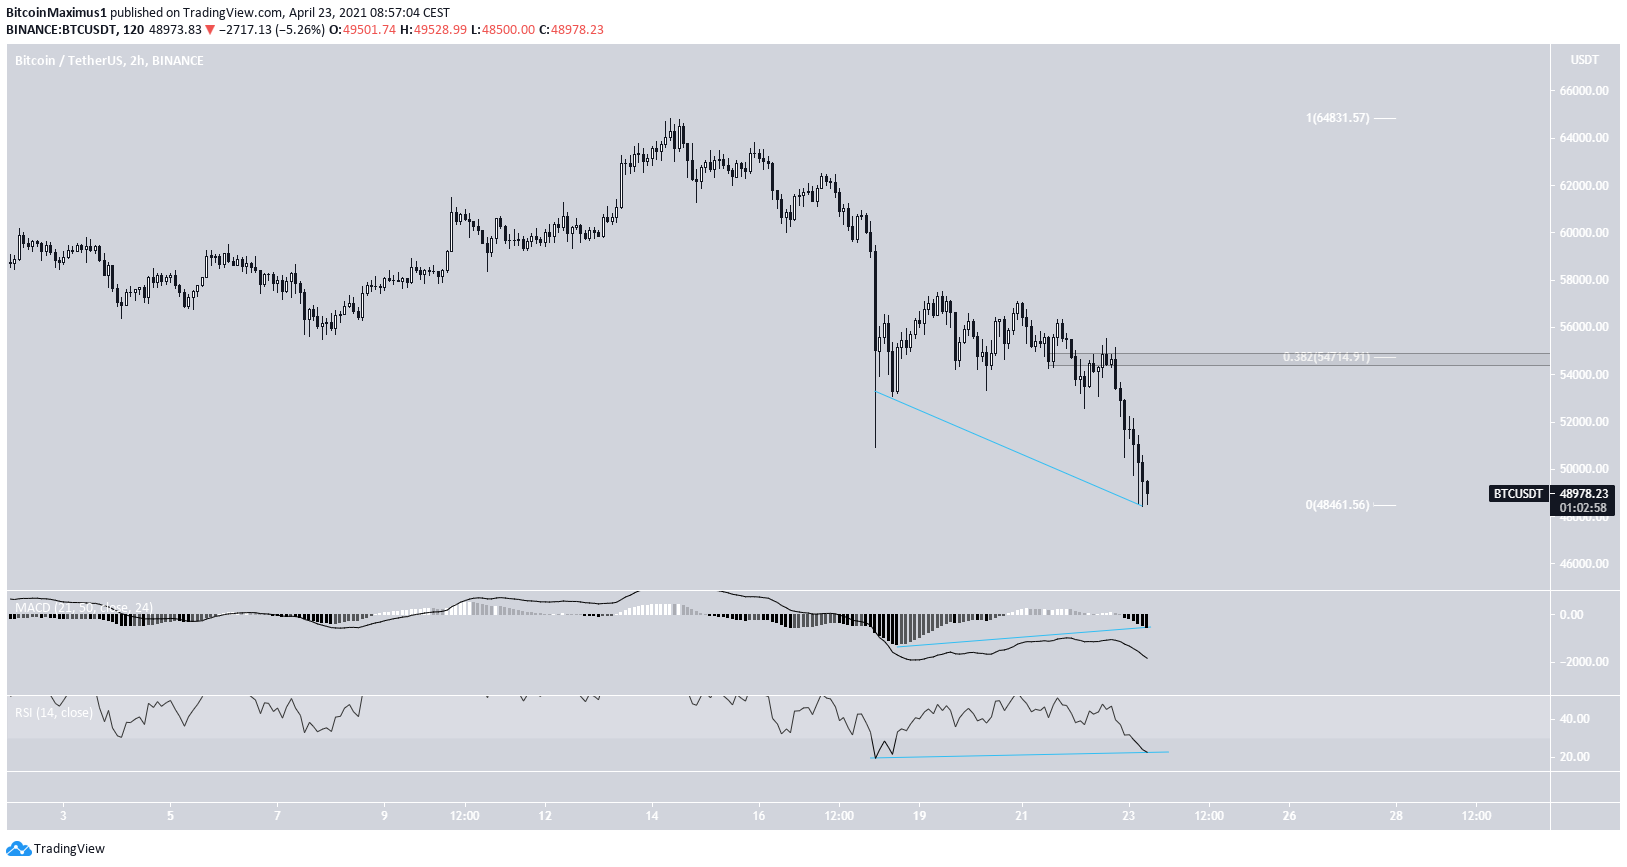
To conclude, BTC is expected to reach a bottom between $47,600 and $46,600 and initiate a sizeable bounce.
For BeInCrypto’s latest bitcoin (BTC) analysis, click here.


