


On March 16, 2019, Bitcoin (BTC) pushed past the ₮4000 barrier. We predicted these price increases in our March 15 analysis of Bitcoin, and now they are here.
However, since Mar 16, BTC prices have risen and fallen below ₮4000 several times. At the time of the writing, the price was trading at around ₮3975.
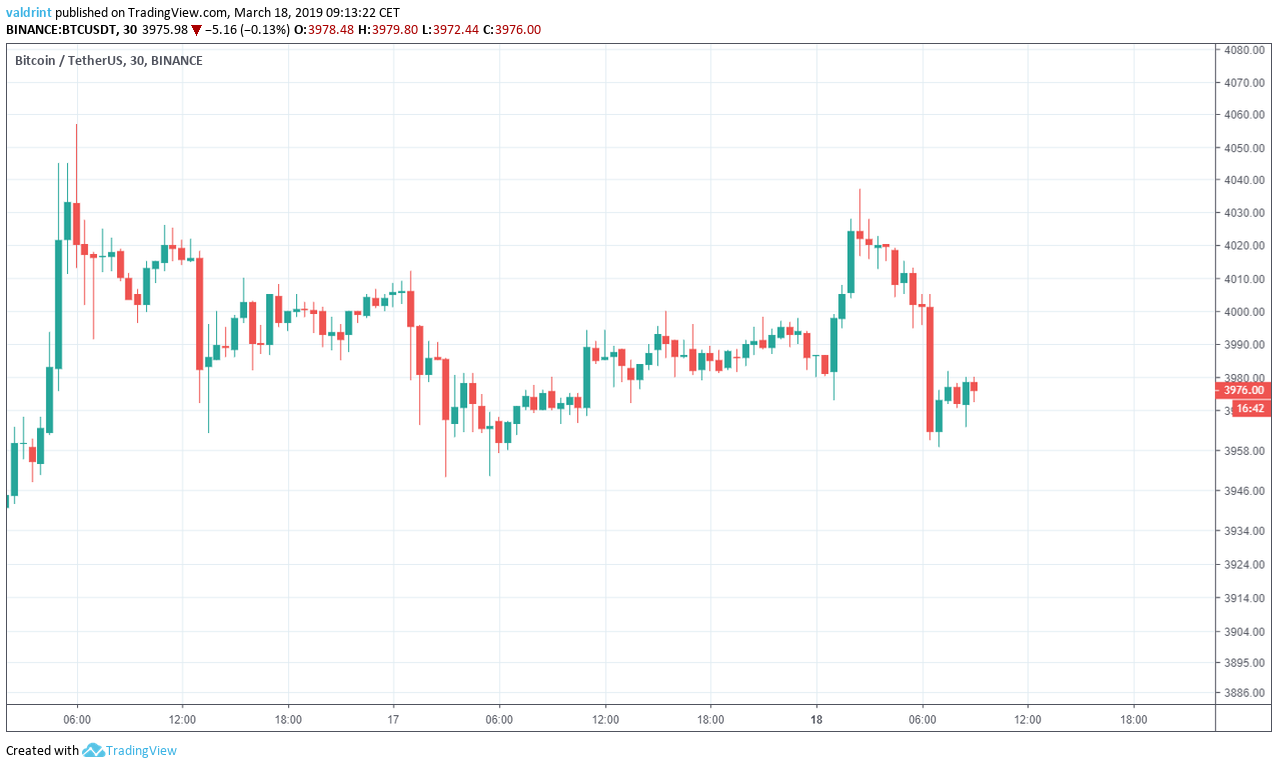
Here’s a look at prices between Mar 16 and Mar 18:
On Mar 15, we predicted that the price will eventually break out from the resistance around ₮3900. The breakout occurred later that day.
Based on today’s analysis, we predict that a slight price increase may occur, but significant fluctuations are not to be expected. However, another breakout may occur sometime thereafter with prices exceeding and stabilizing above ₮4000 for at least a brief period.
Key Highlights For Mar 18
- The price of Bitcoin has been on a downtrend since Mar 16.
- It is trading inside a short-term horizontal channel and long-term ascending channel.
- There are support areas near ₮3970, ₮3840 and ₮3720.
- There is resistance near ₮4160
Horizontal Support
The price of BTC on Binance is analyzed at thirty-minute intervals from Mar 16 to Mar 18.
The price made a low of ₮3963.20 on Mar 16. While it initially started to increase, it revisited the same level three other times. Tracing these lows gives us a horizontal support line.
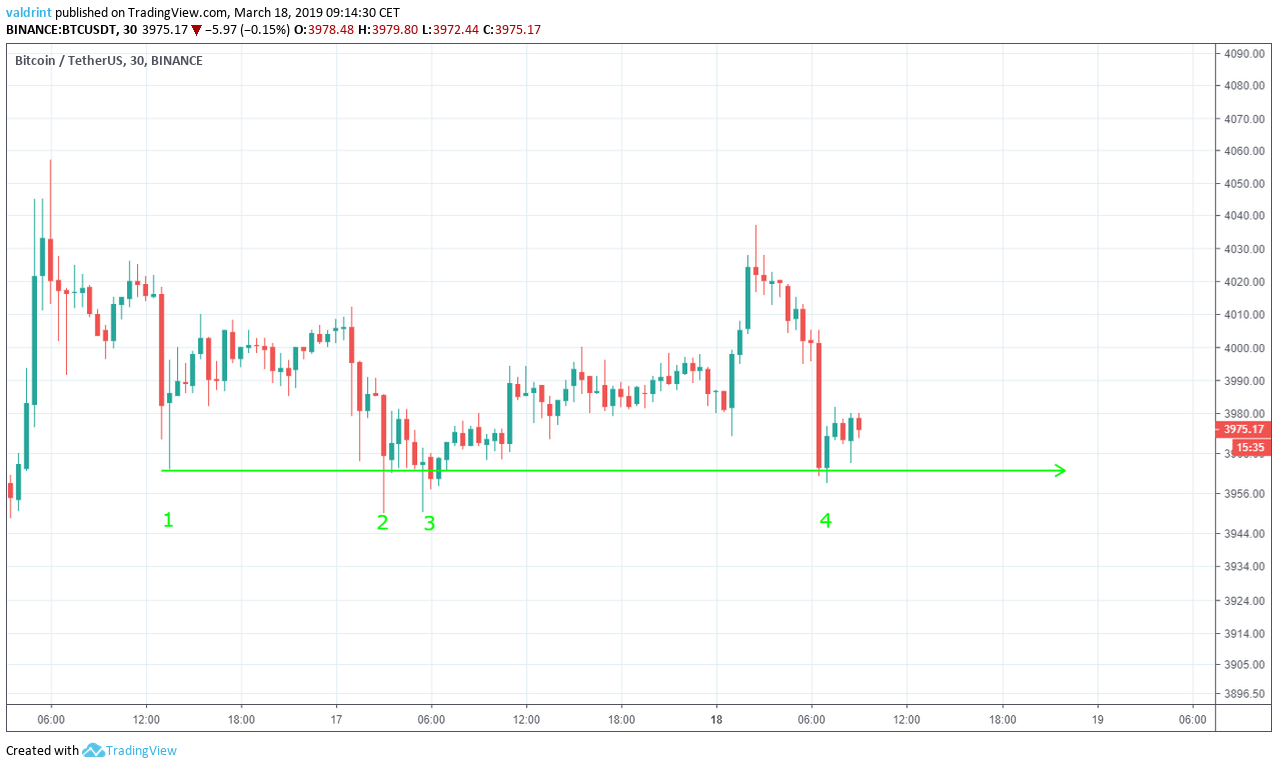
The support line acts as a floor to price, preventing further downward movement.
Wick breakdowns such as the ones on Mar 17 and 18 can be considered insignificant if they are not sustained by continuous movement below the line. In of BTC, the price immediately rebounded above the support following these lows.
Movement below this line is not likely unless a break down occurs. The support line alone is not sufficient in estimating if a break down will occur.
Horizontal Channel
The price of BTC on Binance is analyzed at 30-minute intervals from Mar 16 to Mar 18.
The price reached a high of ₮4024.97 on Mar 16. Afterward, it completed several market cycles. Mar 16’s high was revisited twice. Tracing these highs gives us a horizontal resistance line.
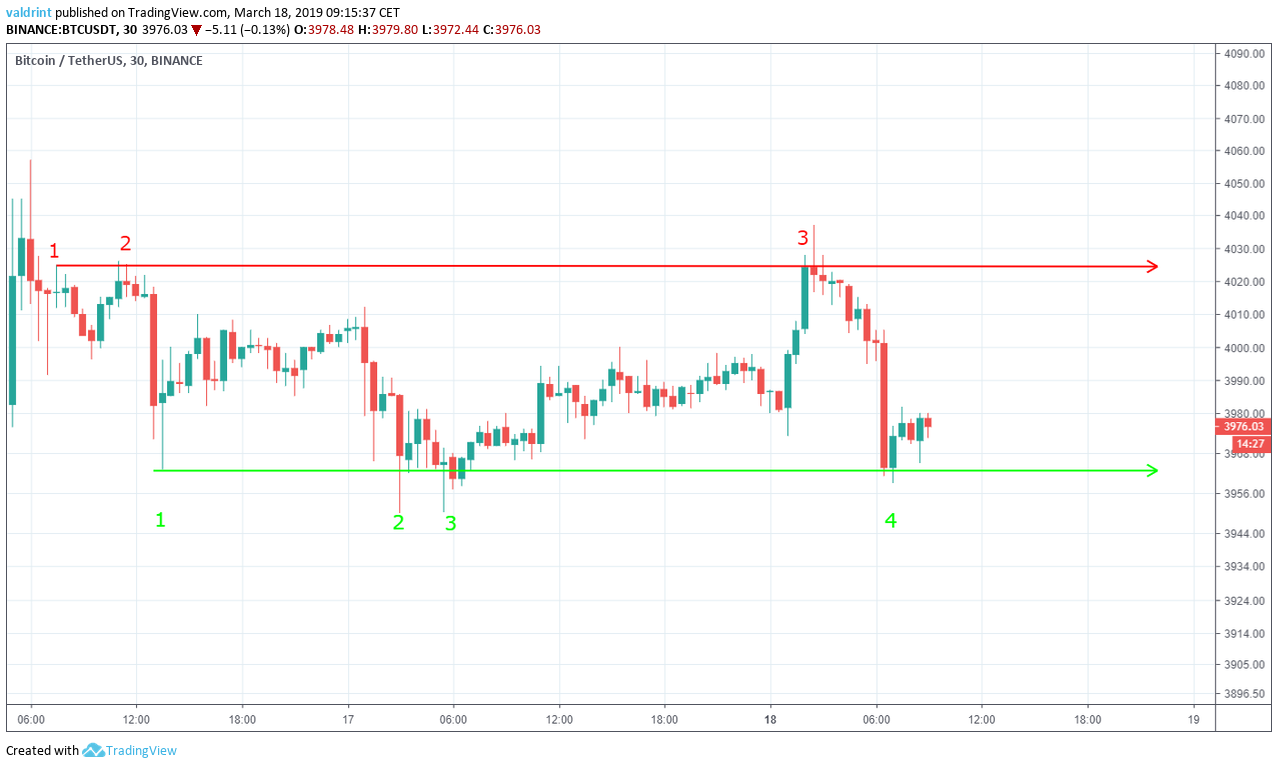
The horizontal resistance line can act as a ceiling to price, preventing further upward movement. It traces the theoretical upper limits of the price.
Wick breakouts above the line such as the one on Mar 18 can be considered insignificant since they are not supported by continuous gains.
The support and resistance lines combine to create a horizontal channel, which is a neutral pattern, making price increases and decreases equally likely.
The channel is a better predictor of price fluctuations than resistance and support lines alone.
It is unlikely that the price will move outside this channel for at least the short term. A breakout or breakdown may occur at some point.
This channel, however, does not indicate if either will occur nor can it tell us when. Even though the channel can predict price fluctuations, it is not sufficient in predicting when a decisive upward or downward movement will occur.
Ascending Triangle
The price of BTC on Binance is analyzed at one-hour intervals from Mar 4 to Mar 18, in order to observe the long-term trend and make an assumption about the direction of the short-term trend.
The price made a low of ₮3670.69 on Mar 4. Several market cycles have been completed since with each low higher than the previous. Tracing these lows gives us an ascending support line.
After the Mar 4 low, it initiated a rapid upward move which took it to ₮3877 on Mar 5. It has made several higher highs since. Tracing these highs gives us an ascending resistance line.

The ascending channel is a neutral pattern, making price increases and decreases equally likely within the channel. However, the upward movement of the channel suggests steady price increases over a longitudinal period.
On Mar 15, the price was rejected by the channel’s resistance. Currently, BTC is trading very close to support.
Given that the support lines of both the short and long-term channel are coinciding, it is unlikely that the price breaks through both of them. It is more probable that the price will move upward towards the horizontal resistance near ₮4020.
Reversal Areas
In order to better determine possible future levels of resistance and support, the price of BTC on Binance is analyzed at four-hour intervals from Feb 25 to Mar 18.
Resistance and Support areas are created when the price visits the same level several times.
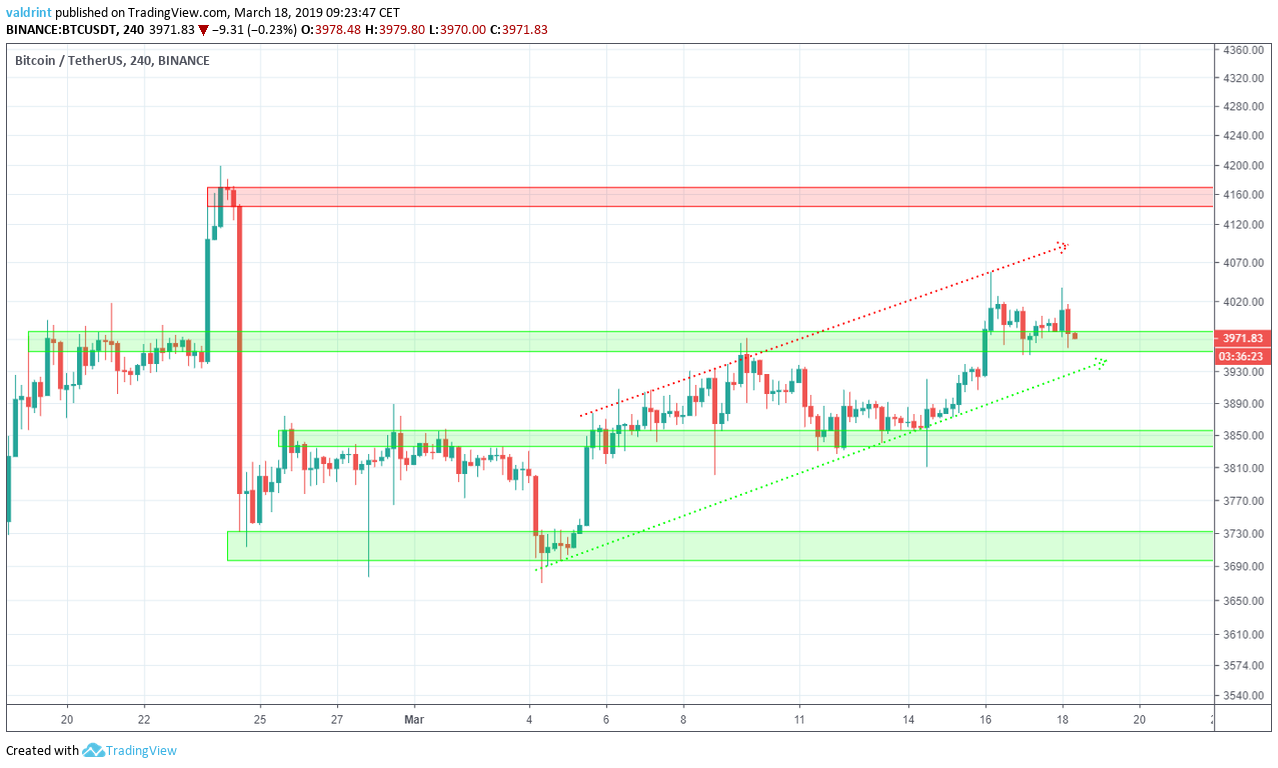
Price is currently trading inside the first support area at ₮3970. This area previously served as resistance, rejecting the price on Mar 9. However, it turned to support after the Mar 16 breakout.
Other support areas are found near ₮3860 and ₮3720. If the price breaks down from the channel, these two would provide likely reversal areas. Based on our analysis, it is not likely that the price reaches the 2nd and 3rd support areas.
Conversely, the closest resistance area is found near ₮4160. If the price breaks out the channel, this area would provide a likely reversal. Based on our analysis, the price may eventually reach this area. However, a rapid increase is not expected.
Summary of Analysis
Based on this analysis, the price of BTC is likely to move inside the confines of the short-term horizontal channel, possibly validating the horizontal resistance line. If the price touches the resistance line, this prediction will be partially validated. If it eventually breaks out, it will be fully validated. The prediction would be invalidated by a break down below the support line.
Do you think BTC will breakout above the channel or will price continue to consolidate? Let us know your thoughts in the comments below.
Disclaimer: This article is not trading advice and should not be construed as such. Always consult a trained financial professional before investing in cryptocurrencies, as the market is particularly volatile.


