


Key Highlights For Mar 11, 2019.
- The price of Bitcoin (BTC) rose along an upward trend from Mar 4 and Mar 11, 2019.
- The price is trading inside an ascending wedge.
- There is bearish divergence developing in the RSI and the MACD.
- There are support areas near ₮3840 and ₮3720.
- There are resistance areas near ₮4160 and ₮3970.
Tracing Support
The price of BTC on Binance is analyzed at 30-minute intervals from Mar 4 to Mar 11. During this time, it moved along a generally upward trend after experiencing a low of ₮3670.69 on Mar 4.
Several market cycles were completed during this period. Each major dip was higher than the preceding dip. Tracing these successively increasing lows creates ascending support line.
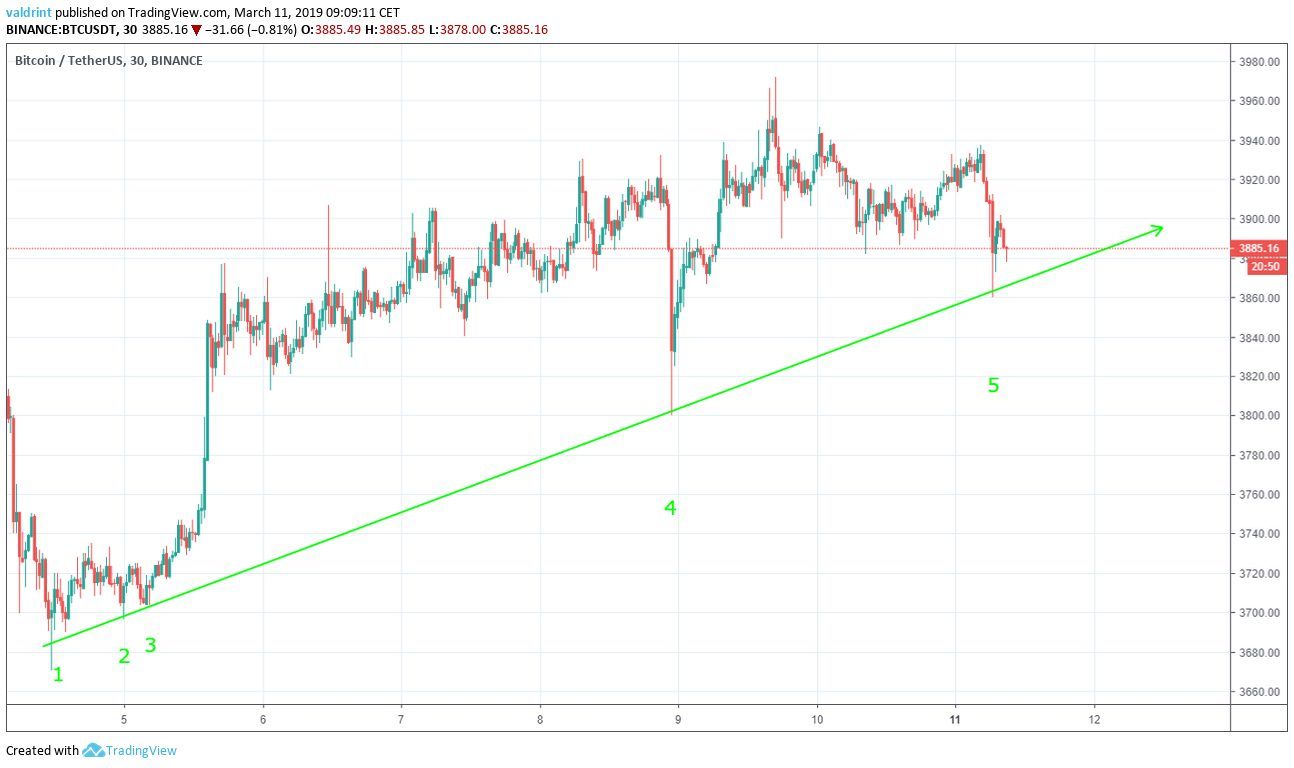
There are five points along this line. They occur on:
- Mar 4
- Mar 5 (twice)
- Mar 8
- Mar 11
The support line can act as a floor to price, preventing further downward movement. However, in the case of a breakdown, a rapid price decrease can ensure. A breakdown occurs when the price drops below the support for a sustained period of time.
Since Mar 4, BTC has been trading well above the support. Price has risen higher than the rate predicted by the line. At the time of writing, BTC was trading near, but above, the support.
Tracing Resistance
Price initiated a rapid upward move on Mar 5. It made a swing high of ₮3877.10.
It has made higher highs since. Tracing these highs gives us an ascending resistance line.
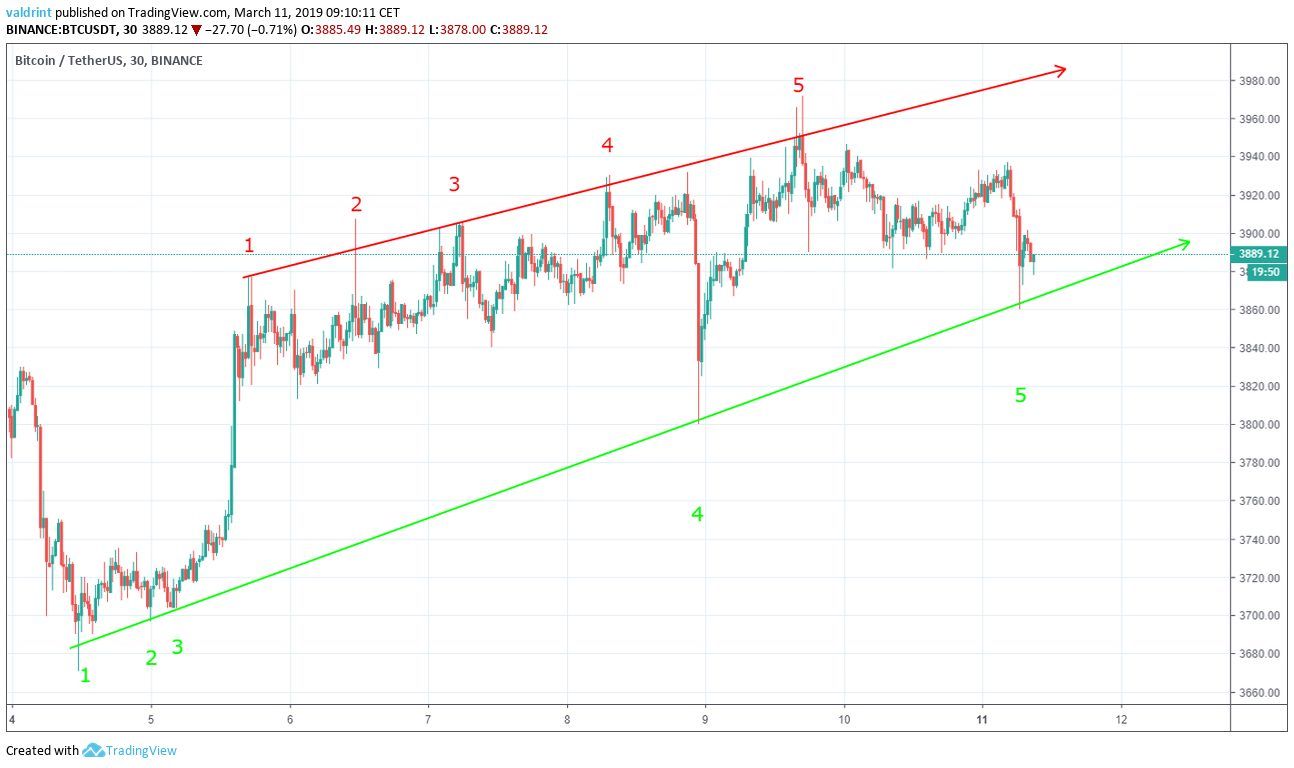
The dates in which the line was touched are :
- Mar 5
- Mar 6
- Mar 7
- Mar 8
- Mar 9
The resistance line can effectively act as a ceiling to price, preventing further upward movement. If price breaks out of the resistance for a sustained period, rapid prices increases may occur.
BTC’s price increased at the same rate as predicted by the resistance line.
At times, highs above resistance were experienced. The breakout above the resistance line by a wick in a volatile market is relatively unimportant as long as it is not succeeded by continued breakdowns. In the case of BTC, 30-minute highs rarely broke above the resistance and were not supported by maintained gains. Rapid price increases are not likely.
The resistance and support lines combine to create an ascending wedge, which is a bearish pattern, making a price decrease more likely than an increase. The recent upward trend may be a sign that the price of BTC will face a correction in the near future and that a downward trend may ensue.
Estimating the Breakdown
The moving average convergence divergence (MACD) is a trend indicator that shows the relationship between two moving averages (long and short-term) and the price. It is used to measure the strength of a move. The relative strength index (RSI) is an indicator which calculates the size of the changes in price in order to determine oversold or overbought conditions in the market.
Combining MACD and RSI bullish/bearish divergence with support/resistance essentially predicts price fluctuations.
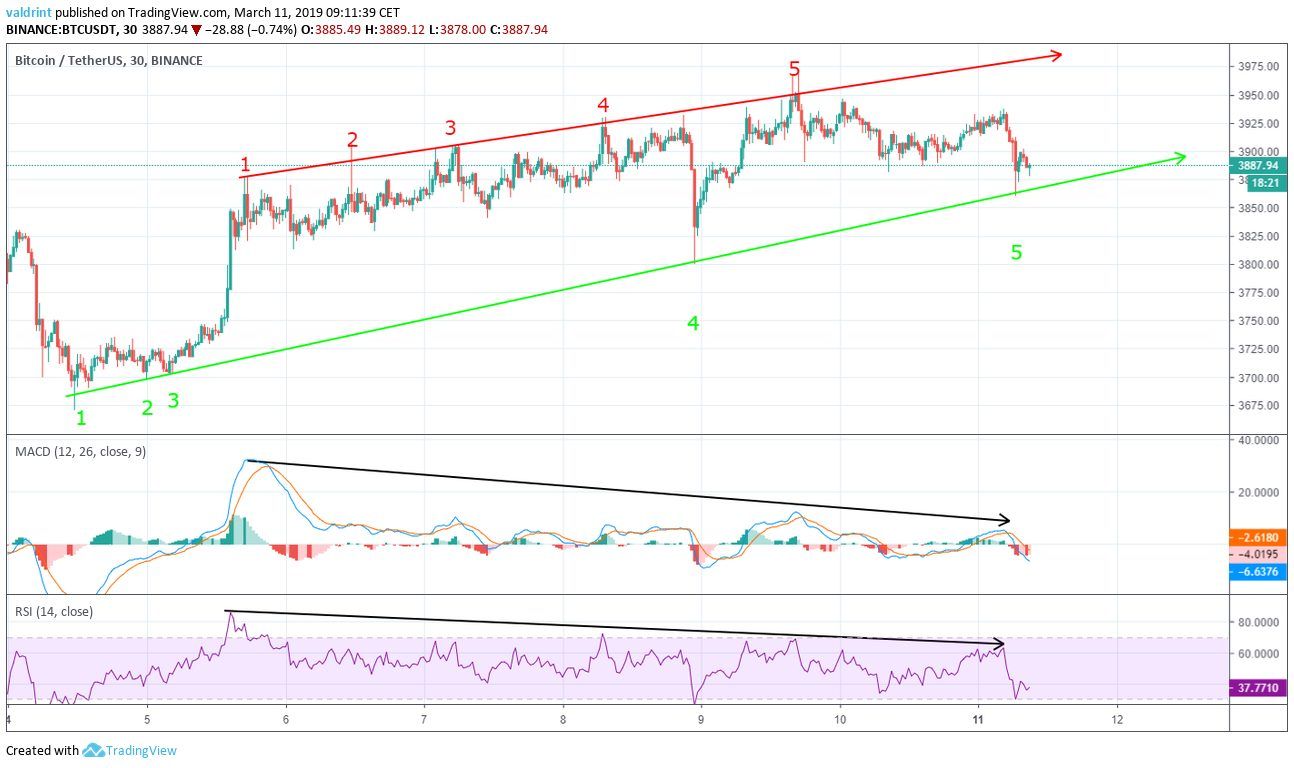
The price reached a swing high of ₮3877.10 on Mar 5. It has made higher highs since.
Similarly, the MACD and the RSI made highs on Mar 5. However, they have continues making lower highs since. This is called bearish divergence and often precedes drops in price.
Divergence predictions are especially effective when there is a bullish divergence on a bullish pattern and vice versa. If both indicators are in agreement, they can be used to further add validity to the divergence analysis. This is the case with BTC since the ascending wedge is a bearish pattern.
Using these indicators, a forthcoming correction for BTC appears likely.
Future Movement
The price of BTC on Binance is analyzed at 2-hours intervals from Feb 19 to Mar 11
Resistance and support areas are formed when the price reaches a certain level several times. They can act as a ceiling/floor that prevents the price from moving further in that direction.
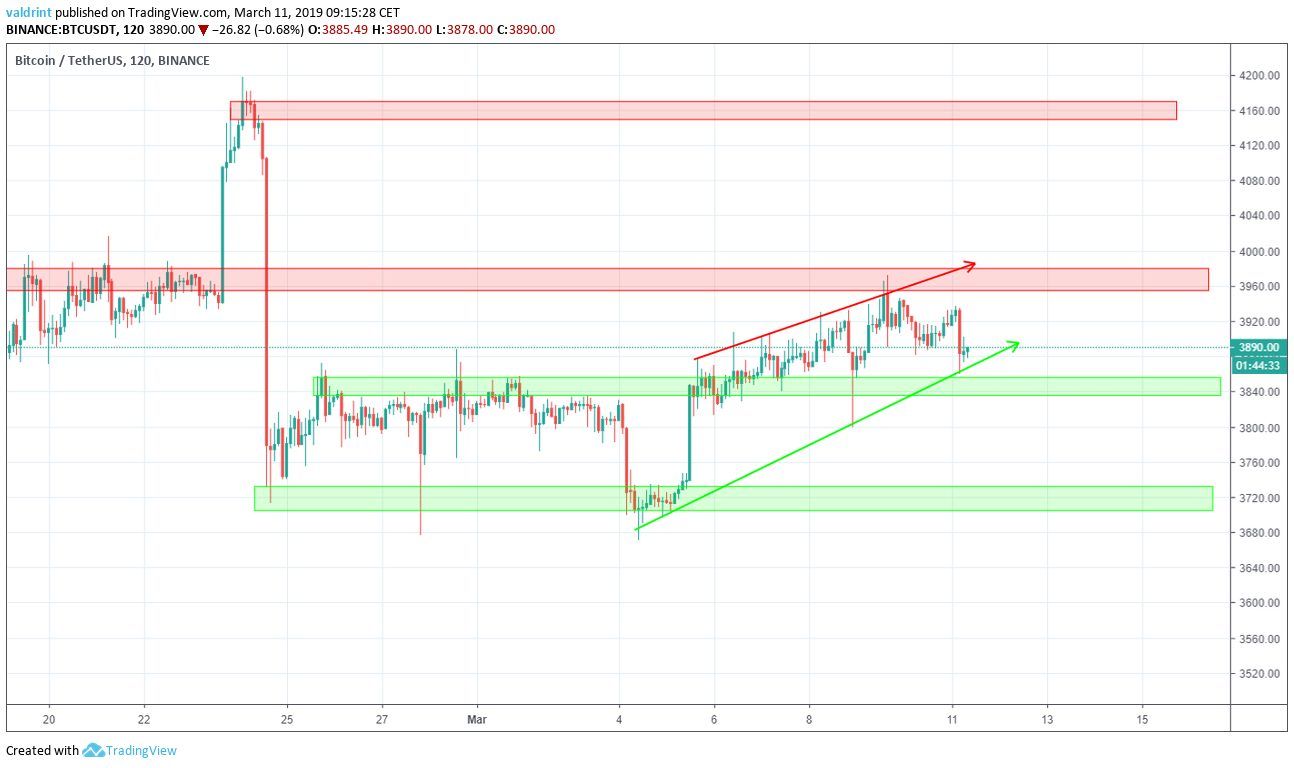
The first support area is found near ₮3840 and the second near ₮3720. In the case of a breakdown, these two would likely be reversal areas. If a price decrease begins, ₮3840 becomes a possible landing point. However, if prices break below ₮3820, a low of ₮3720 might emerge. A break beneath this level might lead to rapid and significant price losses to an indeterminate low.
Conversely, the closest resistance area is found near ₮3960—coinciding with the top of the wedge. The second one is found near ₮4160. In case of a breakout above the resistance, a price of ₮3960 might be reached. A break above this level could lead to prices as high as ₮4160. We believe that this is the less likely scenario.
Summary of Analysis
Based on this analysis, a breakout below the support appears more likely than a breakout above resistance. If the price of BTC trades within the confines of the ascending wedge, this prediction may be partially validated. If the price breaks down from the support line and reaches ₮3840 or ₮3720, this prediction will be fully validated.
Do you think the price of BTC will breakdown to ₮3840? Let us know in the comments below.
Disclaimer: This article is not trading advice and should not be construed as such. Always consult a trained financial professional before investing in cryptocurrencies, as the market is particularly volatile.


