
BeInCrypto takes a look at the price movement for seven altcoins, including Enjin Coin (ENJ), which is very close to reaching a new all-time high price.
BTC
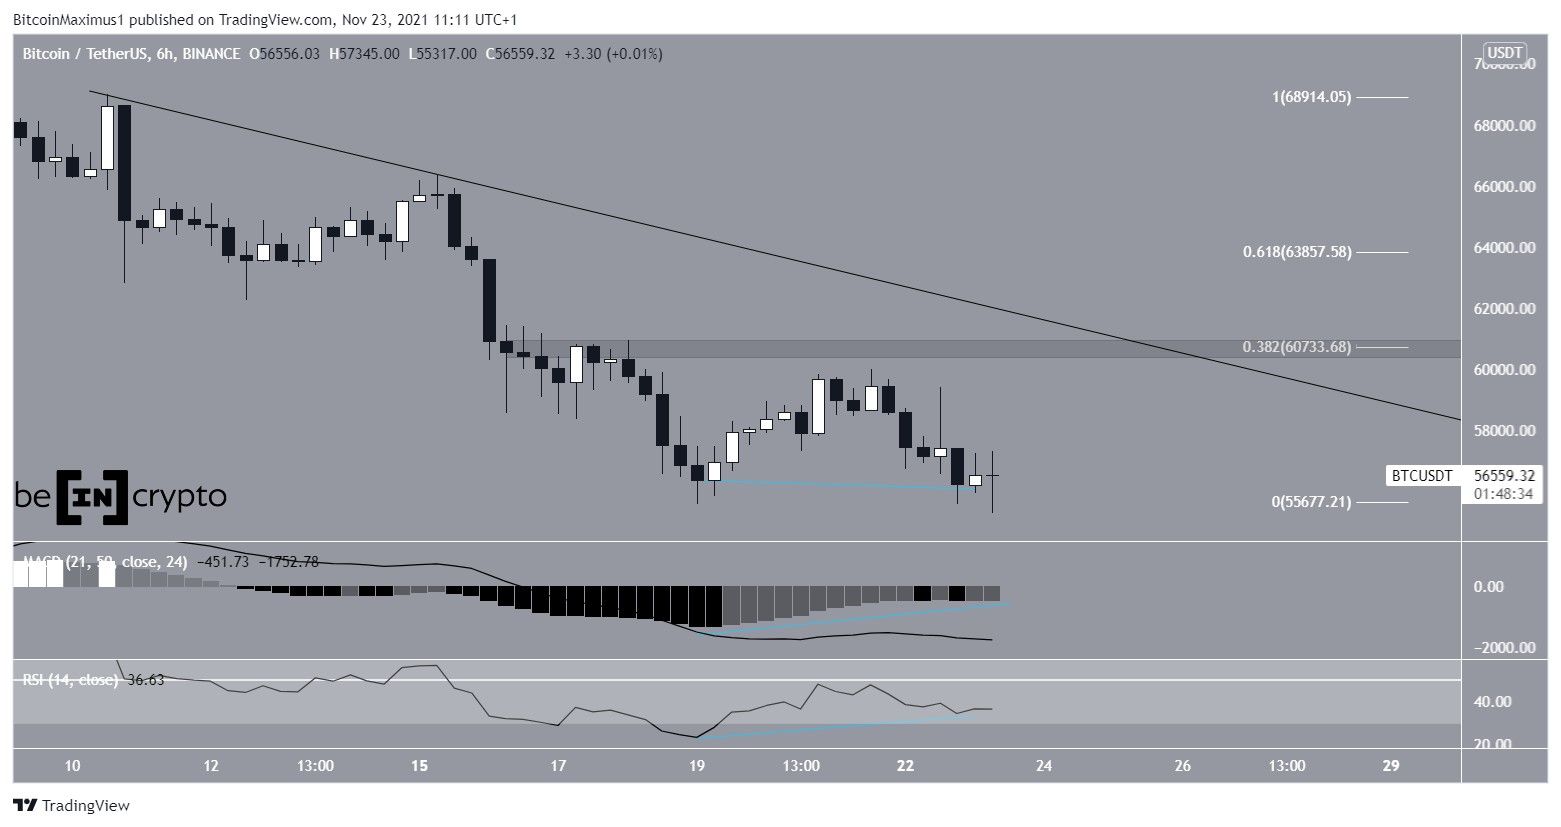
Bitcoin (BTC) has been decreasing alongside a descending resistance line since reaching an all-time high price of $69,000 on Nov 10. This led to a low of $55,600 on Nov 19.
After an initial bounce, BTC fell once more and reached a low of $55,317 on Nov 23.
However, it created a double bottom, which is considered a bullish reversal pattern.
Furthermore, the pattern was combined with bullish divergence in both the RSI and MACD. This is an occurrence when a price decrease is not accompanied by a decrease in technical indicators, and often preceded trend reversals.
The closest resistance is at $60,730. This is the 0.382 Fib retracement resistance level and a descending resistance line.
ETH
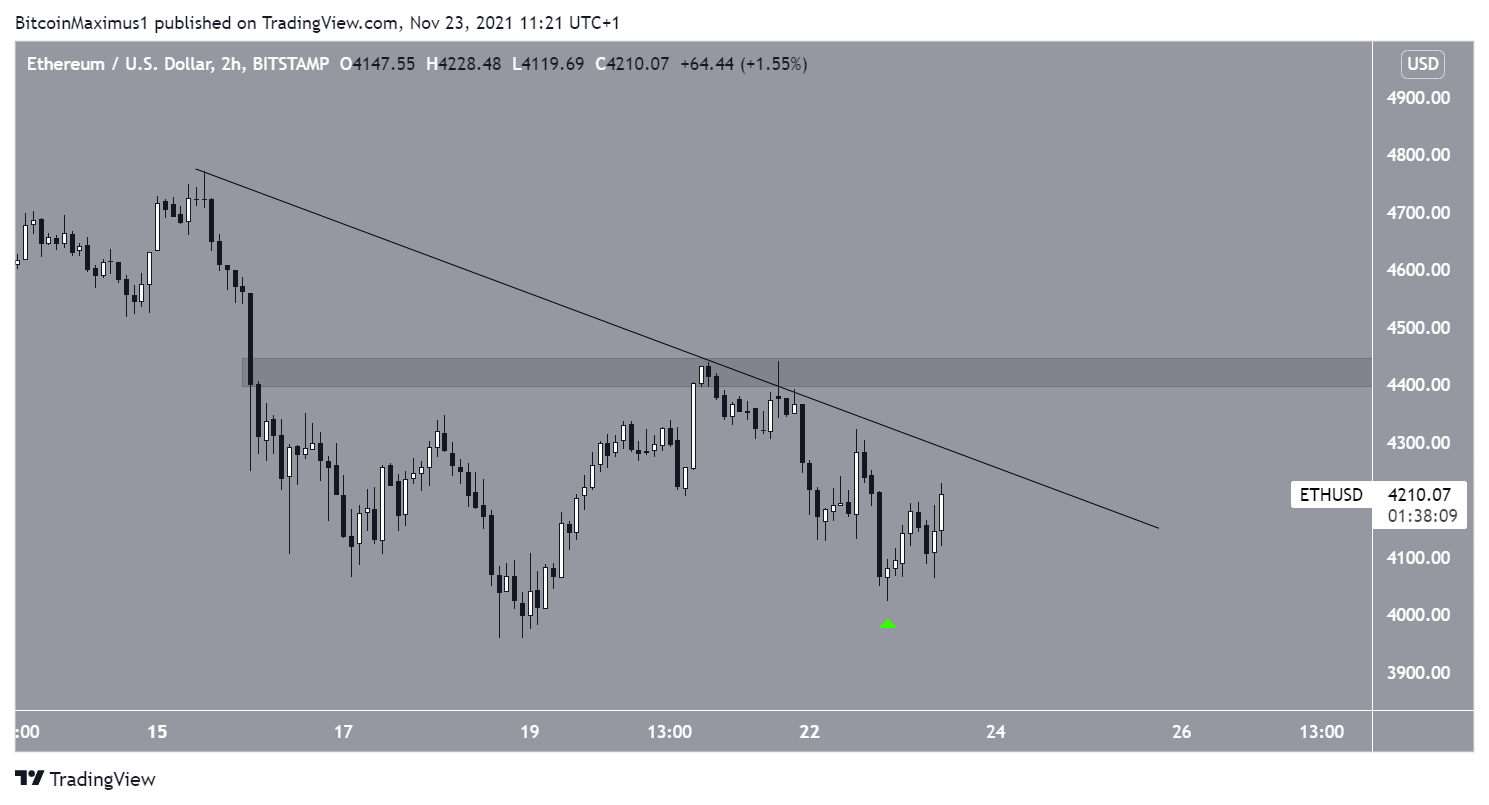
Similarly to BTC, Ethereum (ETH) has created what resembles a double bottom pattern on Nov 19 and 23. However, unlike BTC, the token has not reached a lower low, rather has created a higher low (green icon). This is a bullish sign, since it suggests that ETH has more strength than BTC.
ETH is also following a descending resistance line. A breakout above it would take it to the $4,420 resistance area.
XRP
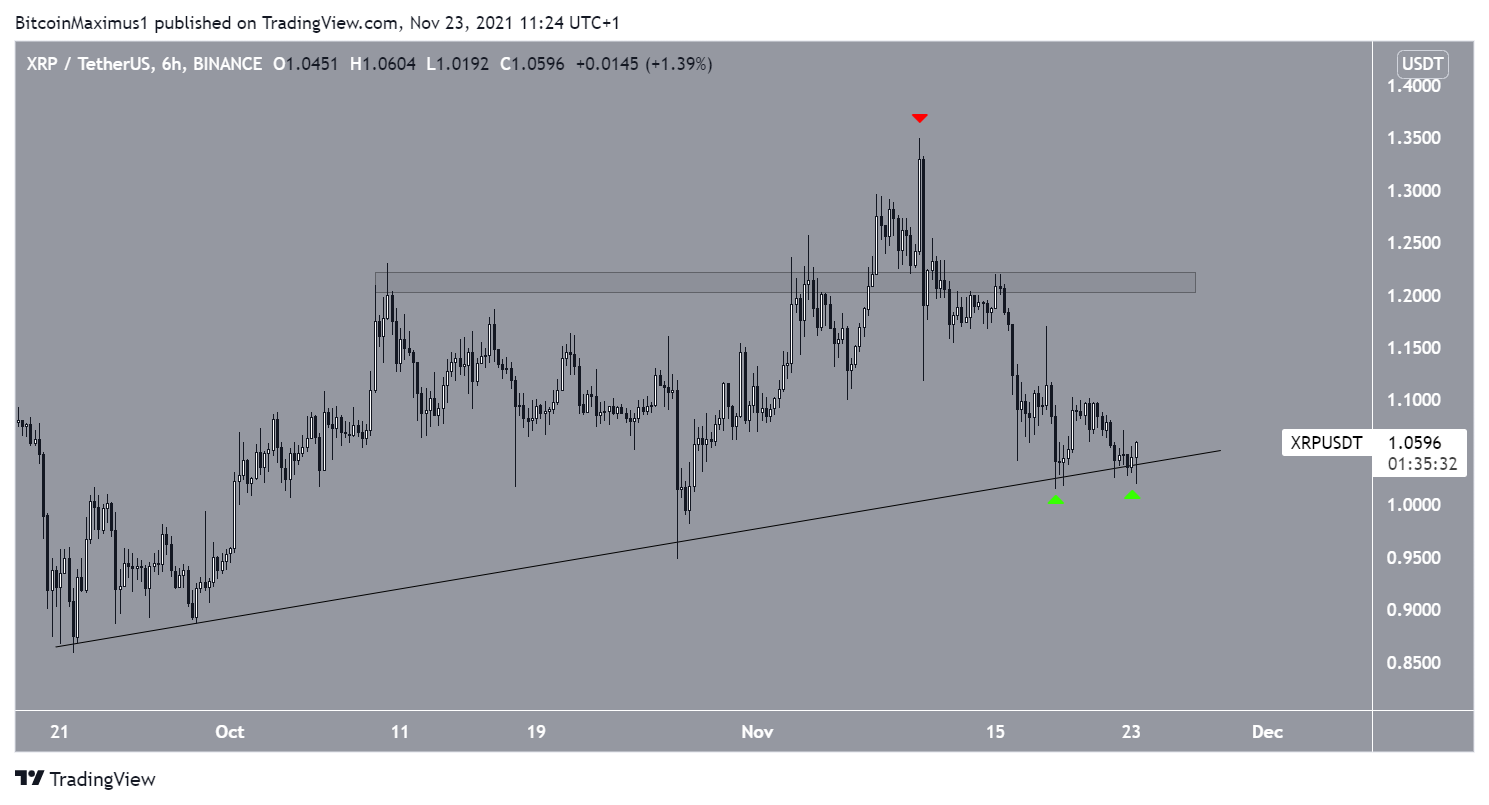
XRP (XRP) has been falling since Nov 10, when it deviated above the $1.215 resistance area. The decrease led to a low of $1.01 on Nov 18.
This caused a validation of an ascending support line in place since Nov 18. Afterwards, XRP validated the line once more on Nov 22 (green icon).
If the upward movement continues, the $1.215 area would be expected to act as resistance once more.
ICX
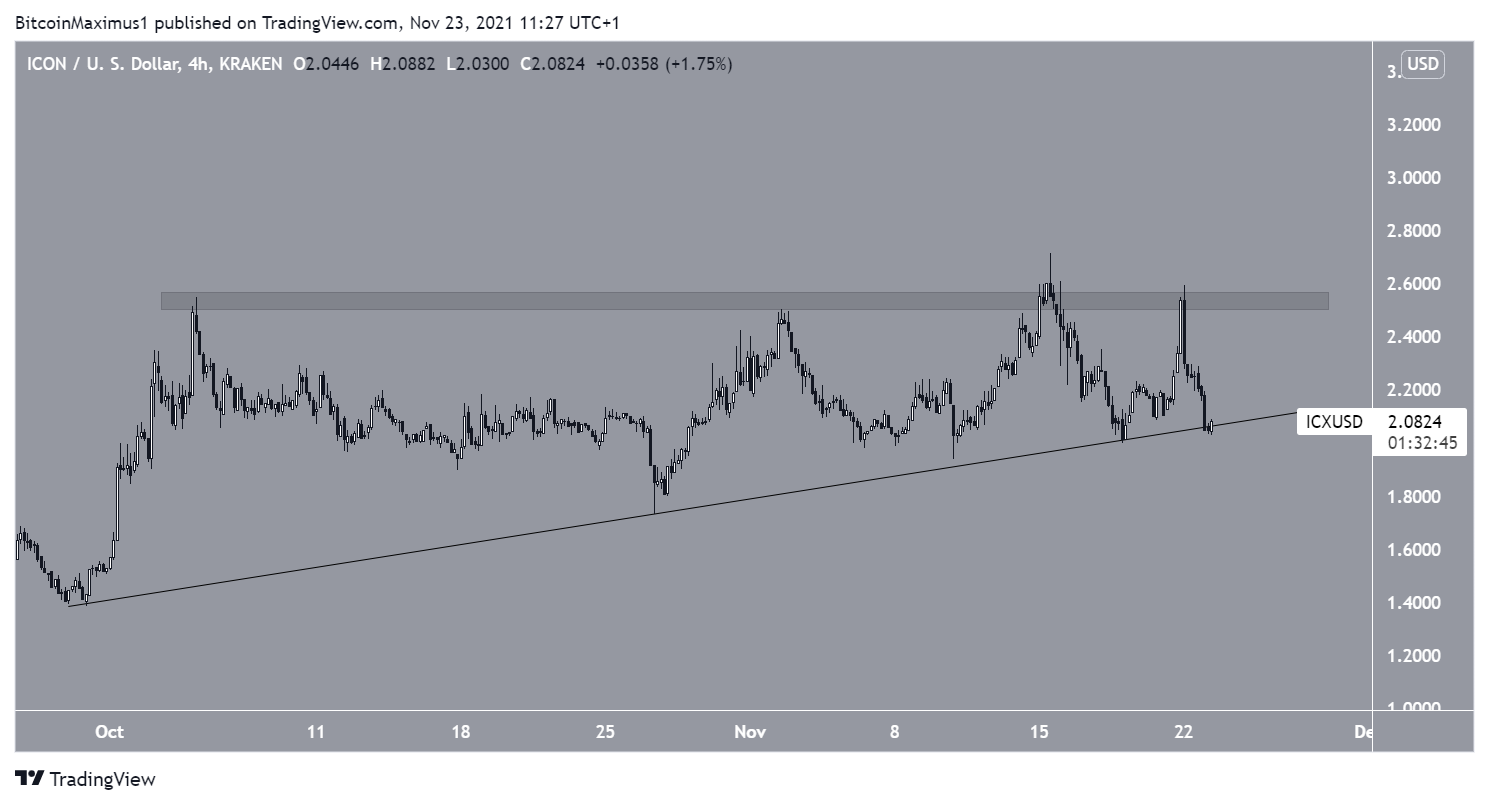
ICON (ICX) has been increasing alongside an ascending support line since the beginning of Oct. While following the line, it has been rejected four times by the $2.55 resistance area.
However, when combined with the line, the area creates an ascending triangle, which is considered a bullish pattern.
Therefore, it is possible that ICX will break out.
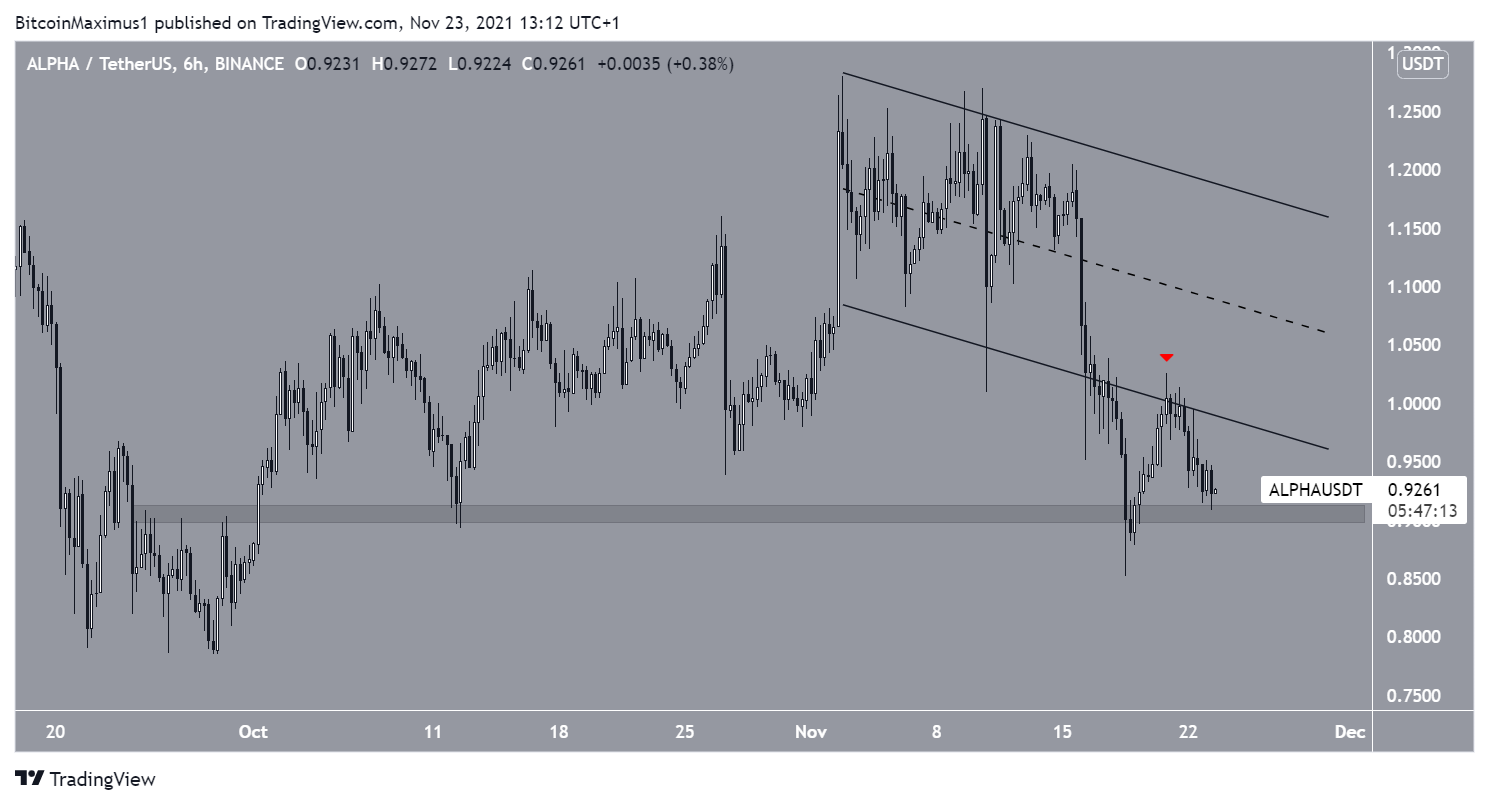
ALPHA
On Nov 16, Alpha Finance (ALPHA) broke down from a descending parallel channel. Afterwards, it validated it as resistance (red icon) three days later and resumed its descent.
However, it is still holding on above the $0.905 horizontal support area. A breakdown below it would take ALPHA towards the $0.80 lows.
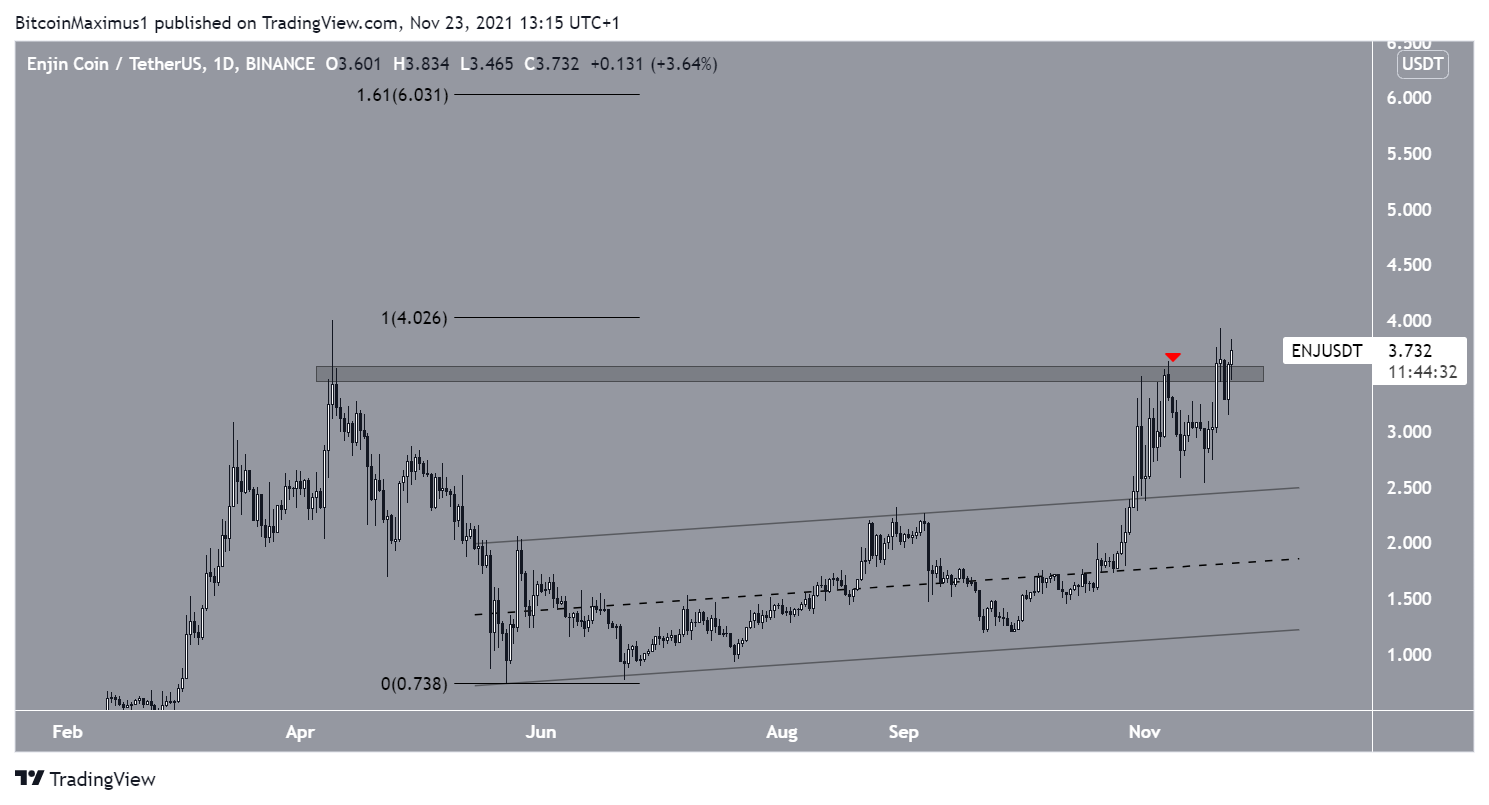
ENJ
On Nov 7, Enjin Coin (ENJ) was rejected by the $3.75 resistance area. However, after a brief descent, it resumed its upward movement and broke out on Nov 20. It nearly reached a new all-time high, culminating at $3.92, only $0.08 below the current all-time high.
If it is successful in sustaining the upward movement, the next resistance would be at $6.03. This is the 1.61 external Fib retracement resistance level.
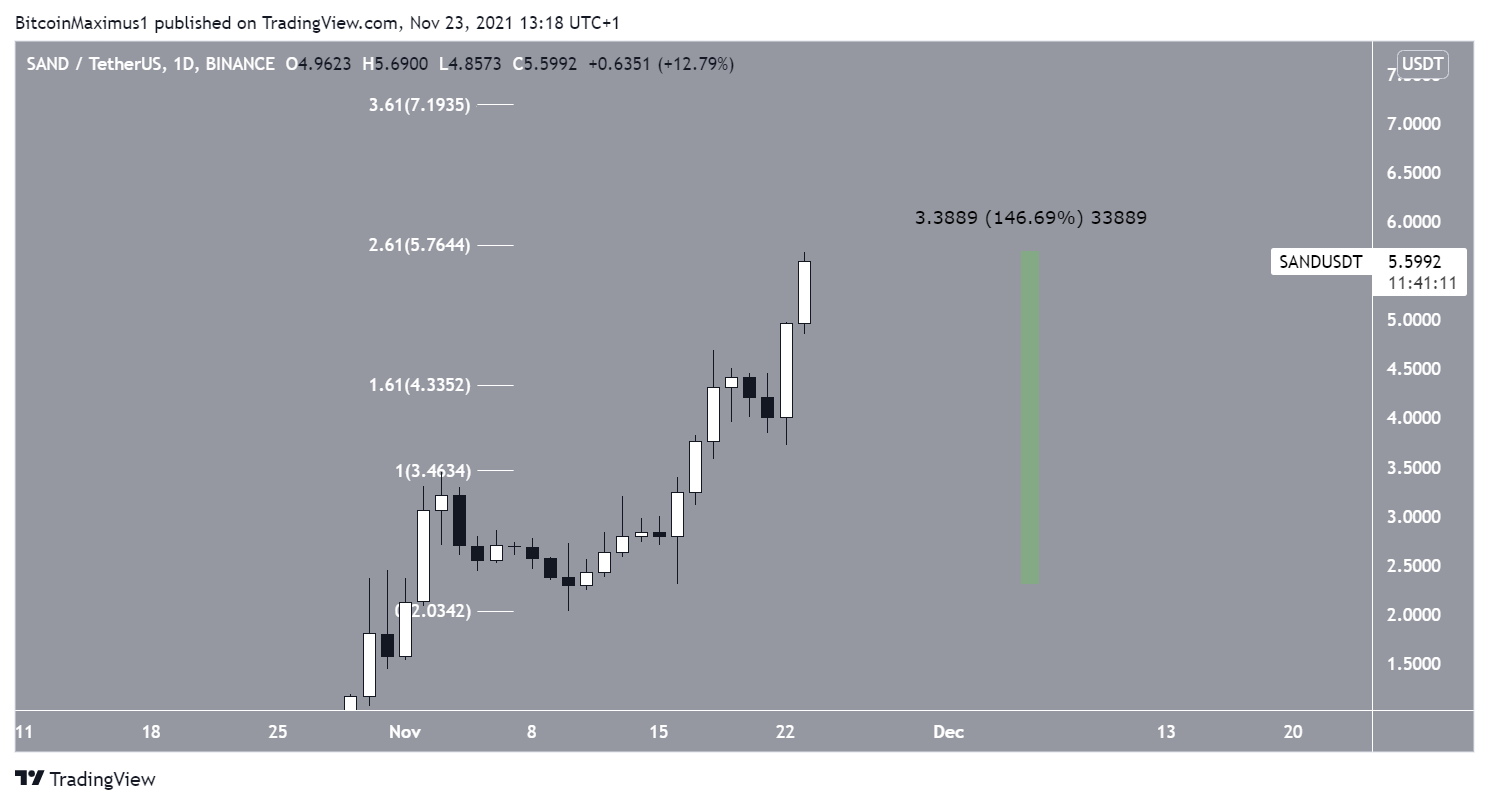
SAND
The Sandbox (SAND) has been increasing at an accelerated rate since Nov 16. So far, it has moved upward by 150%.
Currently, it is trading very close to the 2.61 external Fib retracement resistance at $5.76. It is possible that it will get rejected once it gets there.
The next resistance is at $7.2. This is the 3.61 external Fib retracement resistance.
For BeInCrypto’s latest Bitcoin (BTC) analysis, click here.
What do you think about this subject? Write to us and tell us!
