
Meme coins, including Bonk (BONK), were among the top gainers of the last 24 hours. Before now, BONK had to cope with the torrid environment, as its market cap dropped by almost $2 billion in less than two months.
However, the token looks set to regain some of those losses. On-chain and technical analysis evaluates the potential price levels BONK can reach.
The Market Looks In Bonk’s Direction
As of this writing, BONK trades at $0.000022. This is a 17.20% price increase from June 24 and the highest level since June 20. Furthermore, the price seems ready to keep going north, according to indications from the social dominance.
Social dominance measures the percentage of crypto discussions online about one asset. It compares it to the combined social volume of other cryptocurrencies in the top 100. Whenever social dominance increases, conversation about the asset in question increases.
Conversely, a decline suggests otherwise. According to Santiment, BONK-related discussions continue to rise as social dominance jumps to 0.216%.
Read More: How to Buy Solana Meme Coins: A Step-by-Step Guide
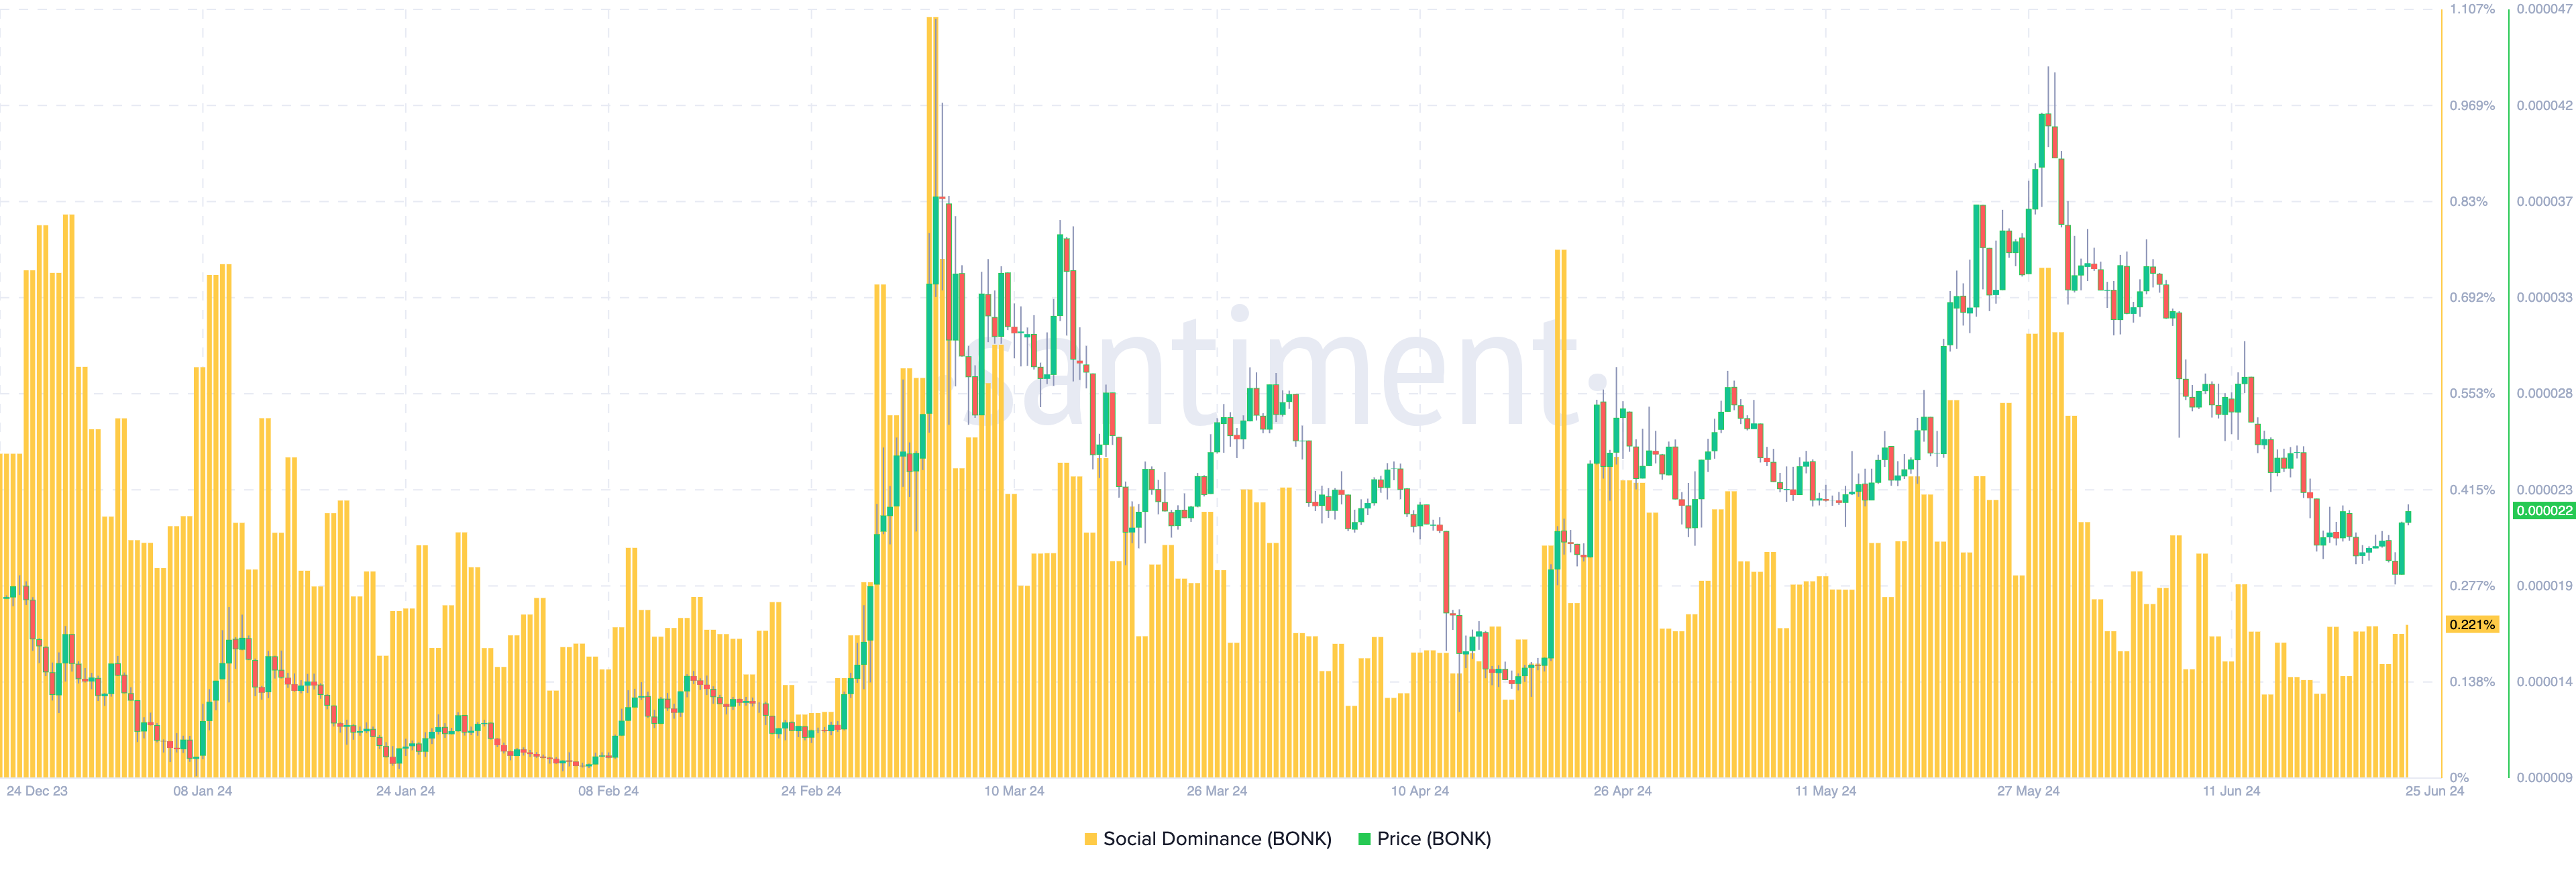
Historically, rising social dominance foreshadows a price increase for the token. For instance, when BONK reached an All-Time High (ATH) of $0.000047 in March, the metric rose to 1.09%. Last month, the metric reading spiked to 0.73%, with the price climbing to $0.000042.
Therefore, the cryptocurrency holders can gain as long as the dialogue about the meme coin ascends.
It is worth noting that BONK is 52.41% down from its ATH. Thus, this may not be the upswing that sends it back to such levels.
Bulls Break Through the Hurdle
Despite that, analysis of the 4-hour BONK/USD chart suggests a further climb for the token. The Supertrend is leading this prediction.
The Supertrend is a technical analysis tool used to identify trends and generate buy and sell signals. It consists of two green lines— green and red. When the green line is below the trading price, it indicates a buy signal.
On the other hand, when the red line is above the price, it indicates a bearish trend and potential entry to sell. In BONK’s case, the price rises above the $0.000020 support and breaches the sell signal flashed by the Supertrend.
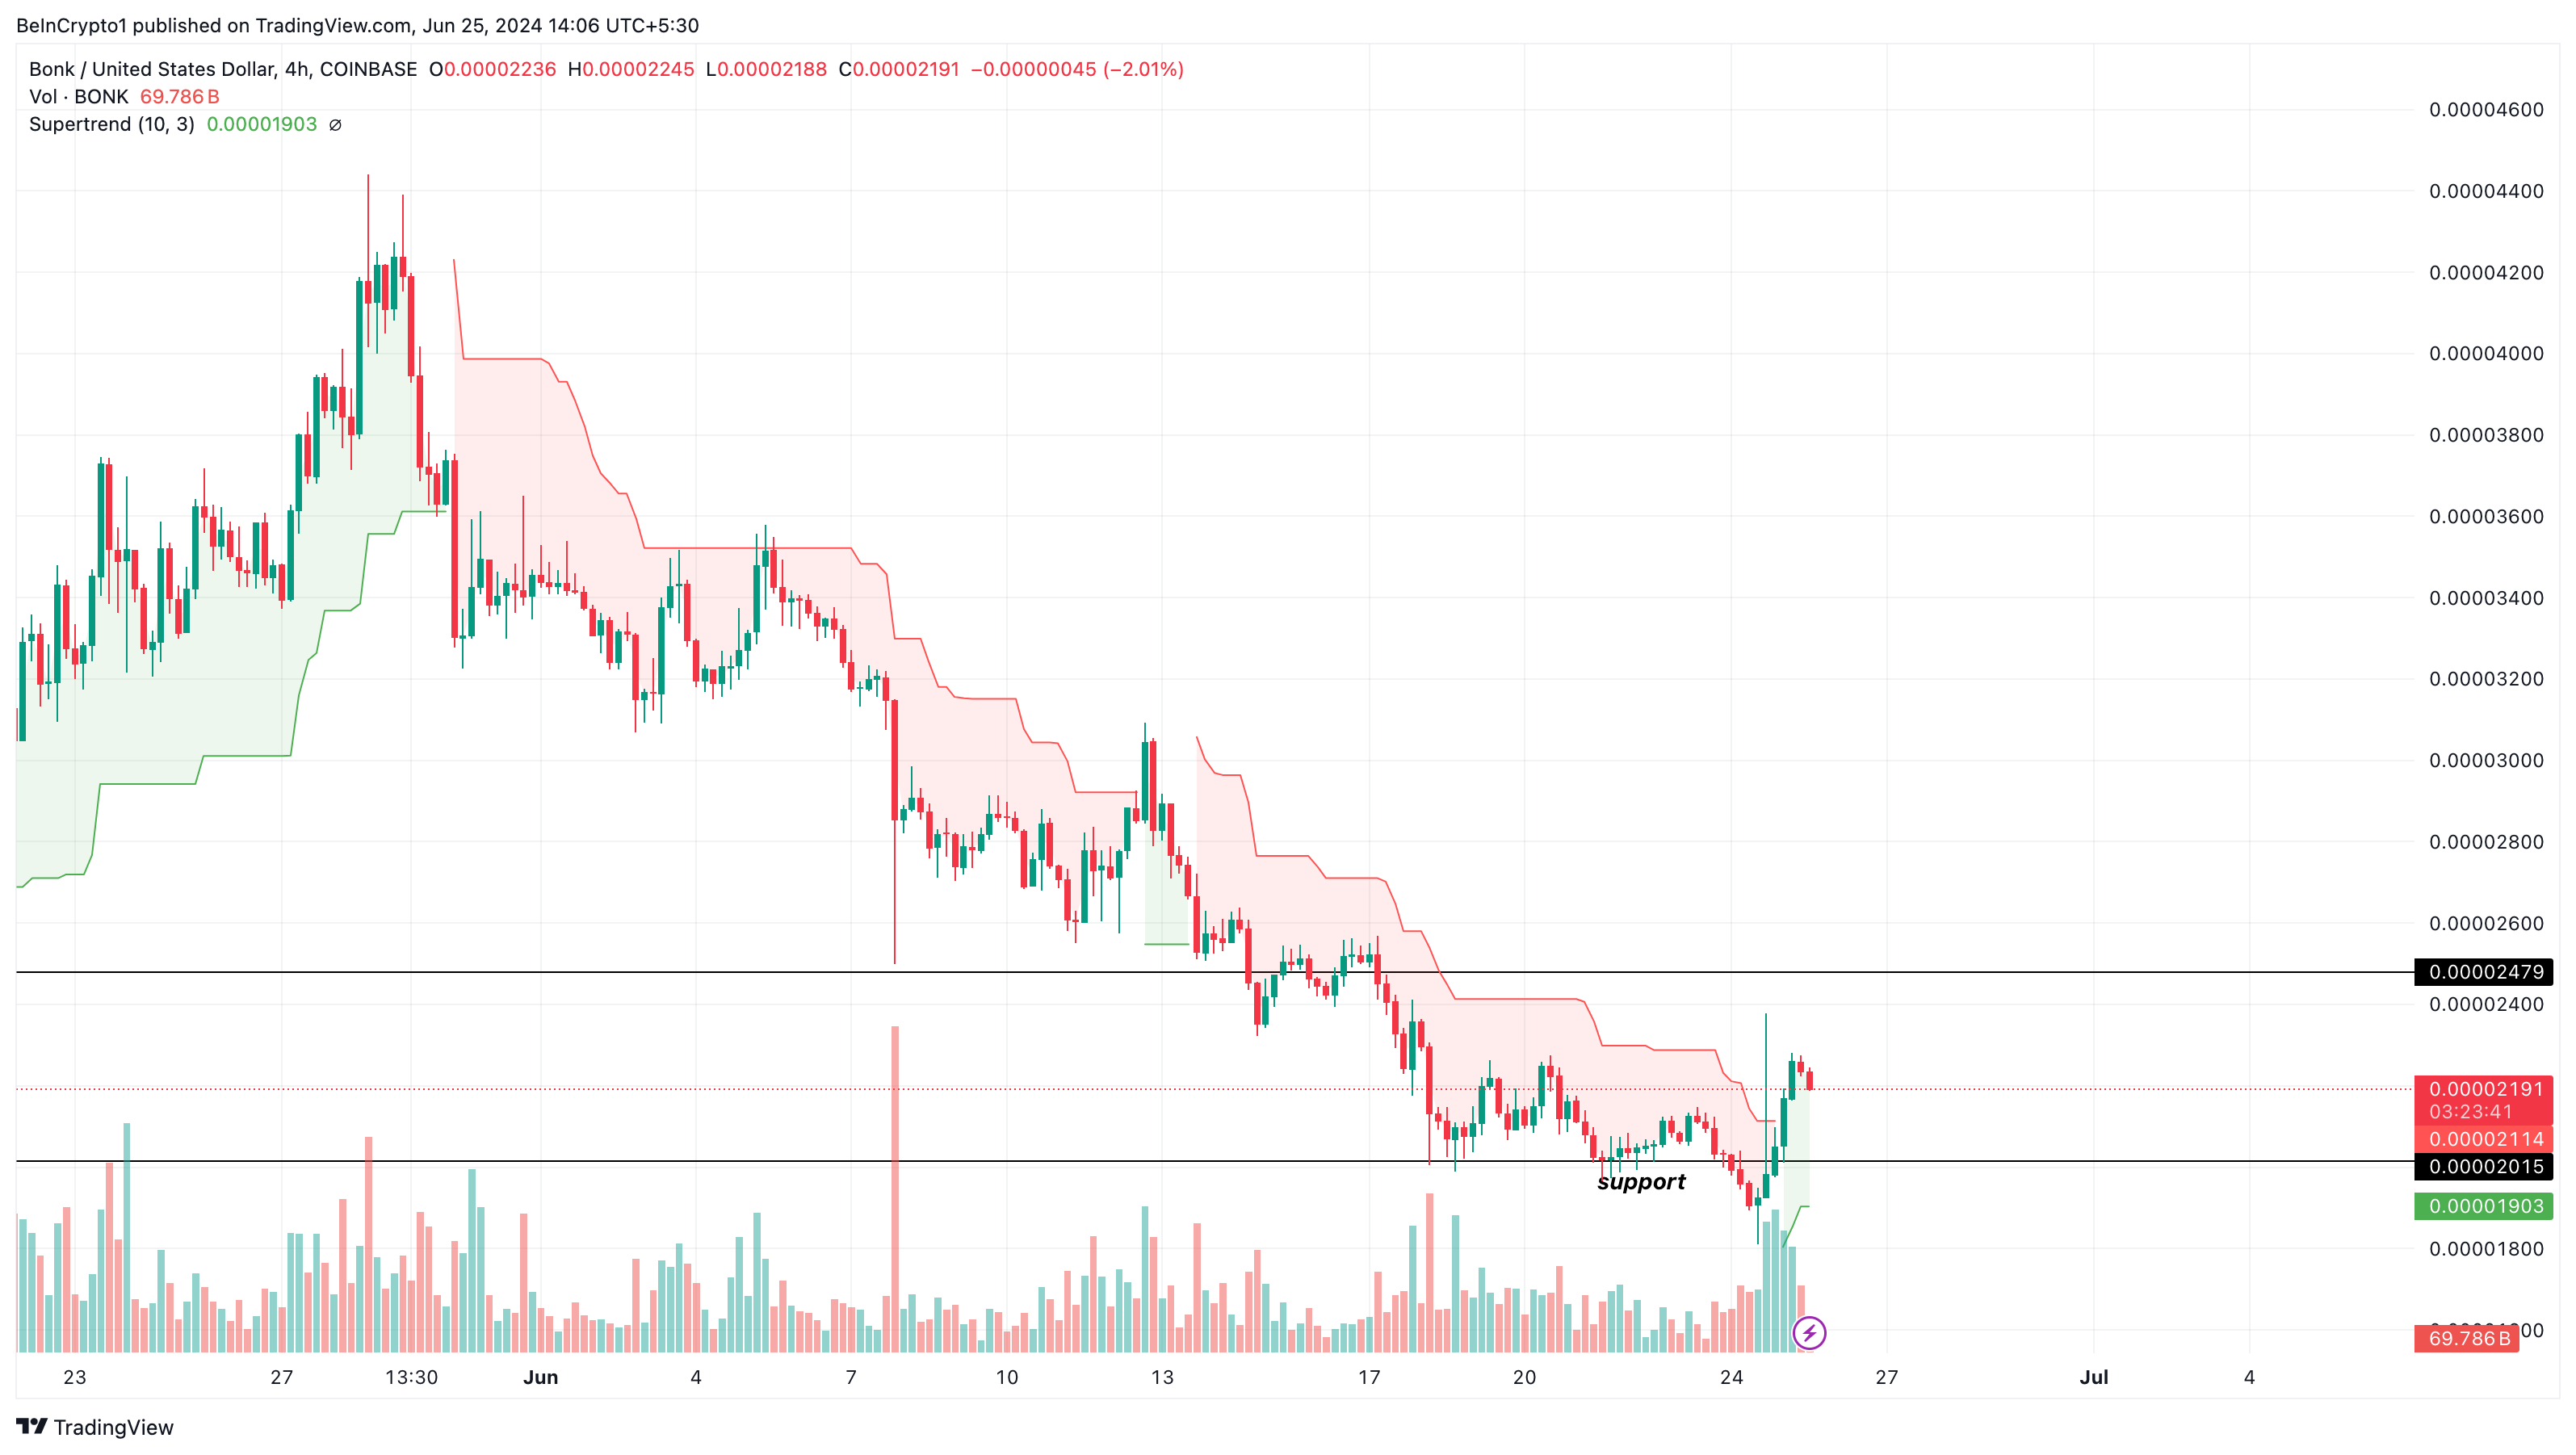
With the red line below BONK’s price, bulls will aim to increase the value. If this happens and traders opt against booking profits, the price may reach $0.00025 in a few days.
BONK Price Prediction: Prepare for $0.000025
On the daily chart, BeInCrypto analyzes the Bollinger Bands (BB) and Awesome Oscillator (AO). The BB reveals the volatility around a token and identifies potential entry and exit points. Assuming the upper band of the indicator touches the price, it means that the cryptocurrency is overbought.
In this case, it will be time to sell and exit. However, if the lower band touches the price, it is oversold and an opportunity to buy. Assuming the upper band of the indicator touches the price, it means that the cryptocurrency is overbought. In this case, it will be time to sell and exit. However, if the lower band touches the price, it is oversold and an opportunity to buy.
At press time, the bands expand, but neither taps BONK’s price. This suggests that it is not oversold or overbought.
For the AO, it measures market momentum. Positive readings indicate increasing upward momentum, while negative ones suggest otherwise. From the chart below, the Awesome Oscillator is negative. However, the green histogram bars show that BONK is in recovery mode.
Read More: Bonk Aidrop Eligibility: Who Can Claim and How?
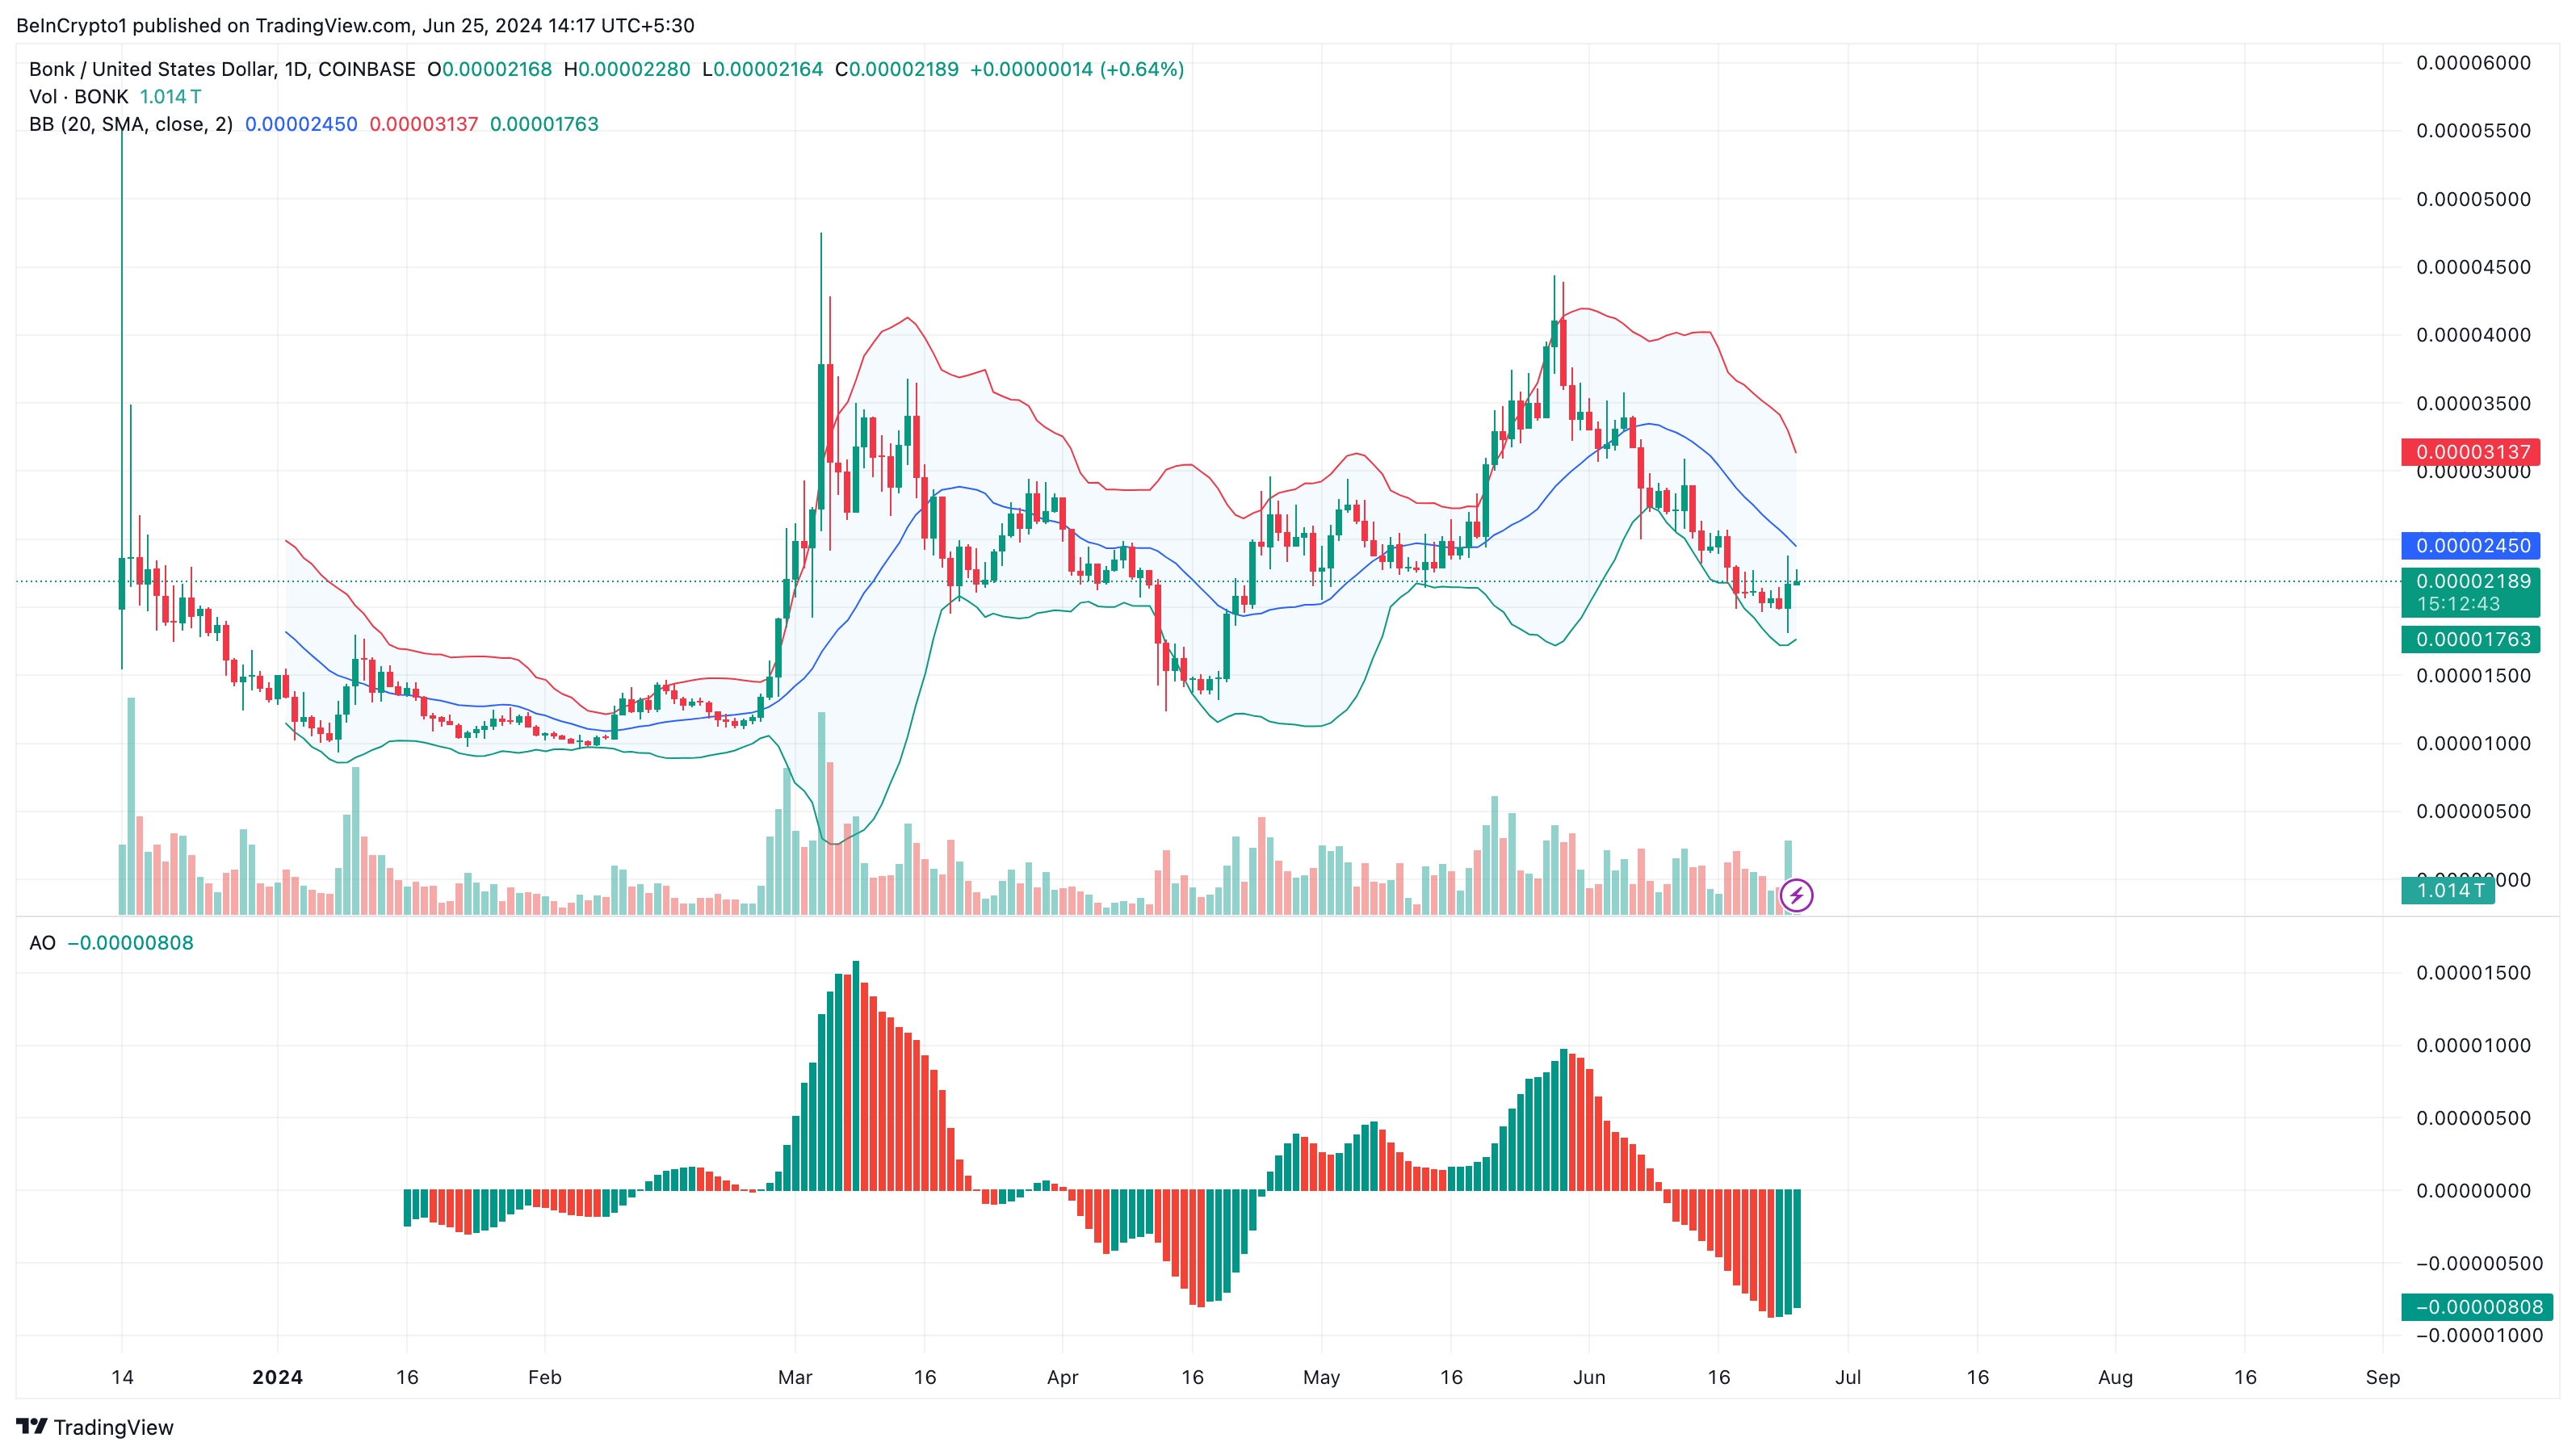
Should the AO rise slowly to positive territory, BONK’s price prediction to $0.000025 may be validated.
However, the bullish thesis will be rendered invalid if BONK maintains its strong correlation with Bitcoin (BTC). Another possible nullification will occur if holders of the meme coin book profit from the recent hike.
