


Binance Coin (BNB) has put and end to its downward movement by bouncing at the $385 horizontal support area.
While a short-term bounce seems likely, the direction of the longer-term trend is not yet clear.
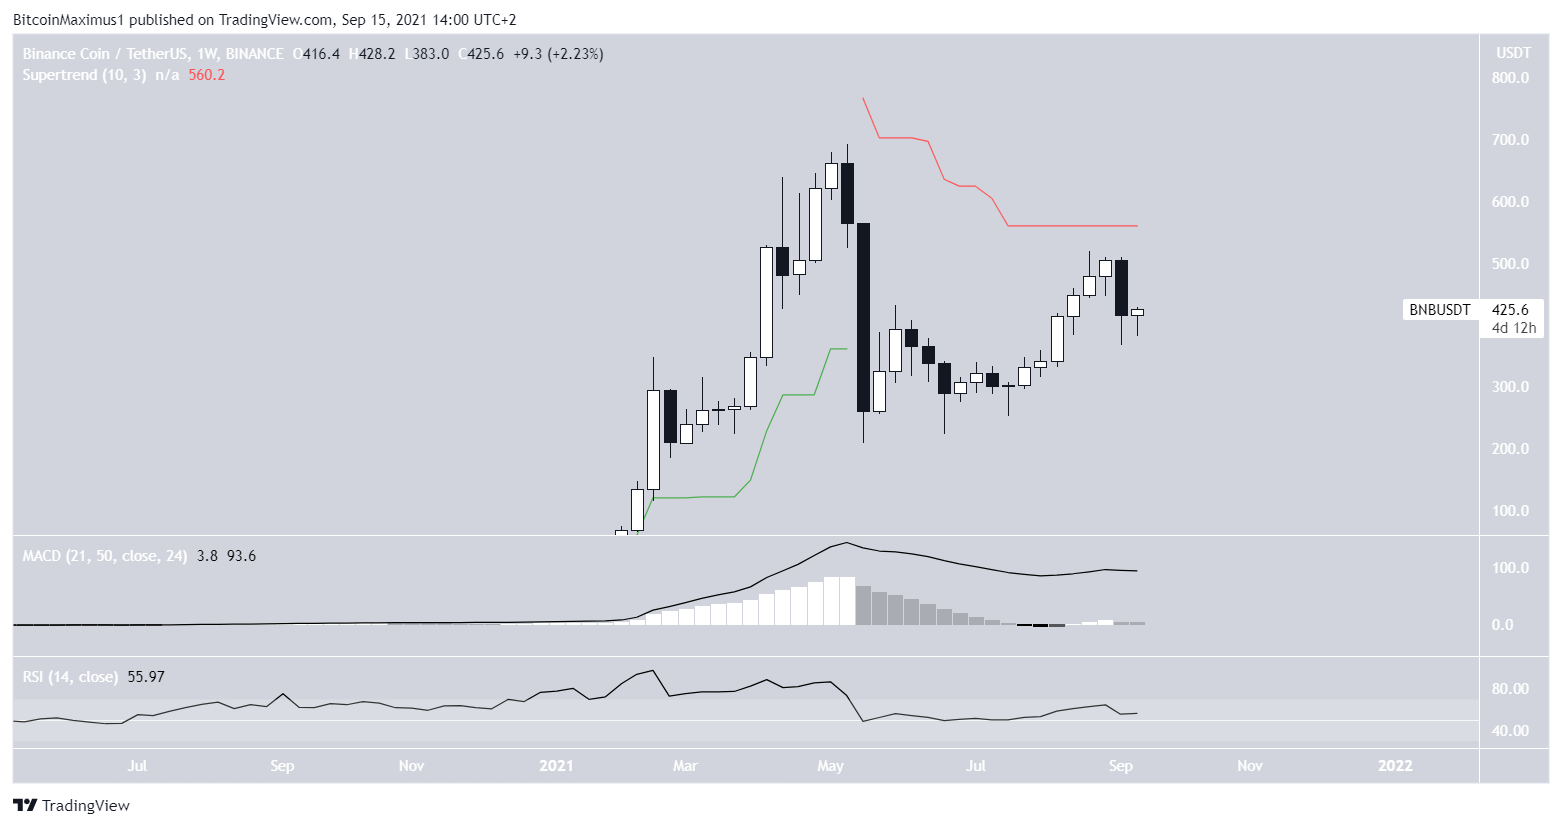
Long-term movement
The weekly chart for BNB gives conflicting signs.
While the token has been increasing since the May drop, last week’s rejection could potentially be the first lower high relative to the $691.8 all-time high price.
Furthermore, readings from indicators are mixed. The MACD is positive but decreasing. Similarly, the RSI is above 50, but it is also decreasing. In addition to this, the Supertrend is bearish (red line).
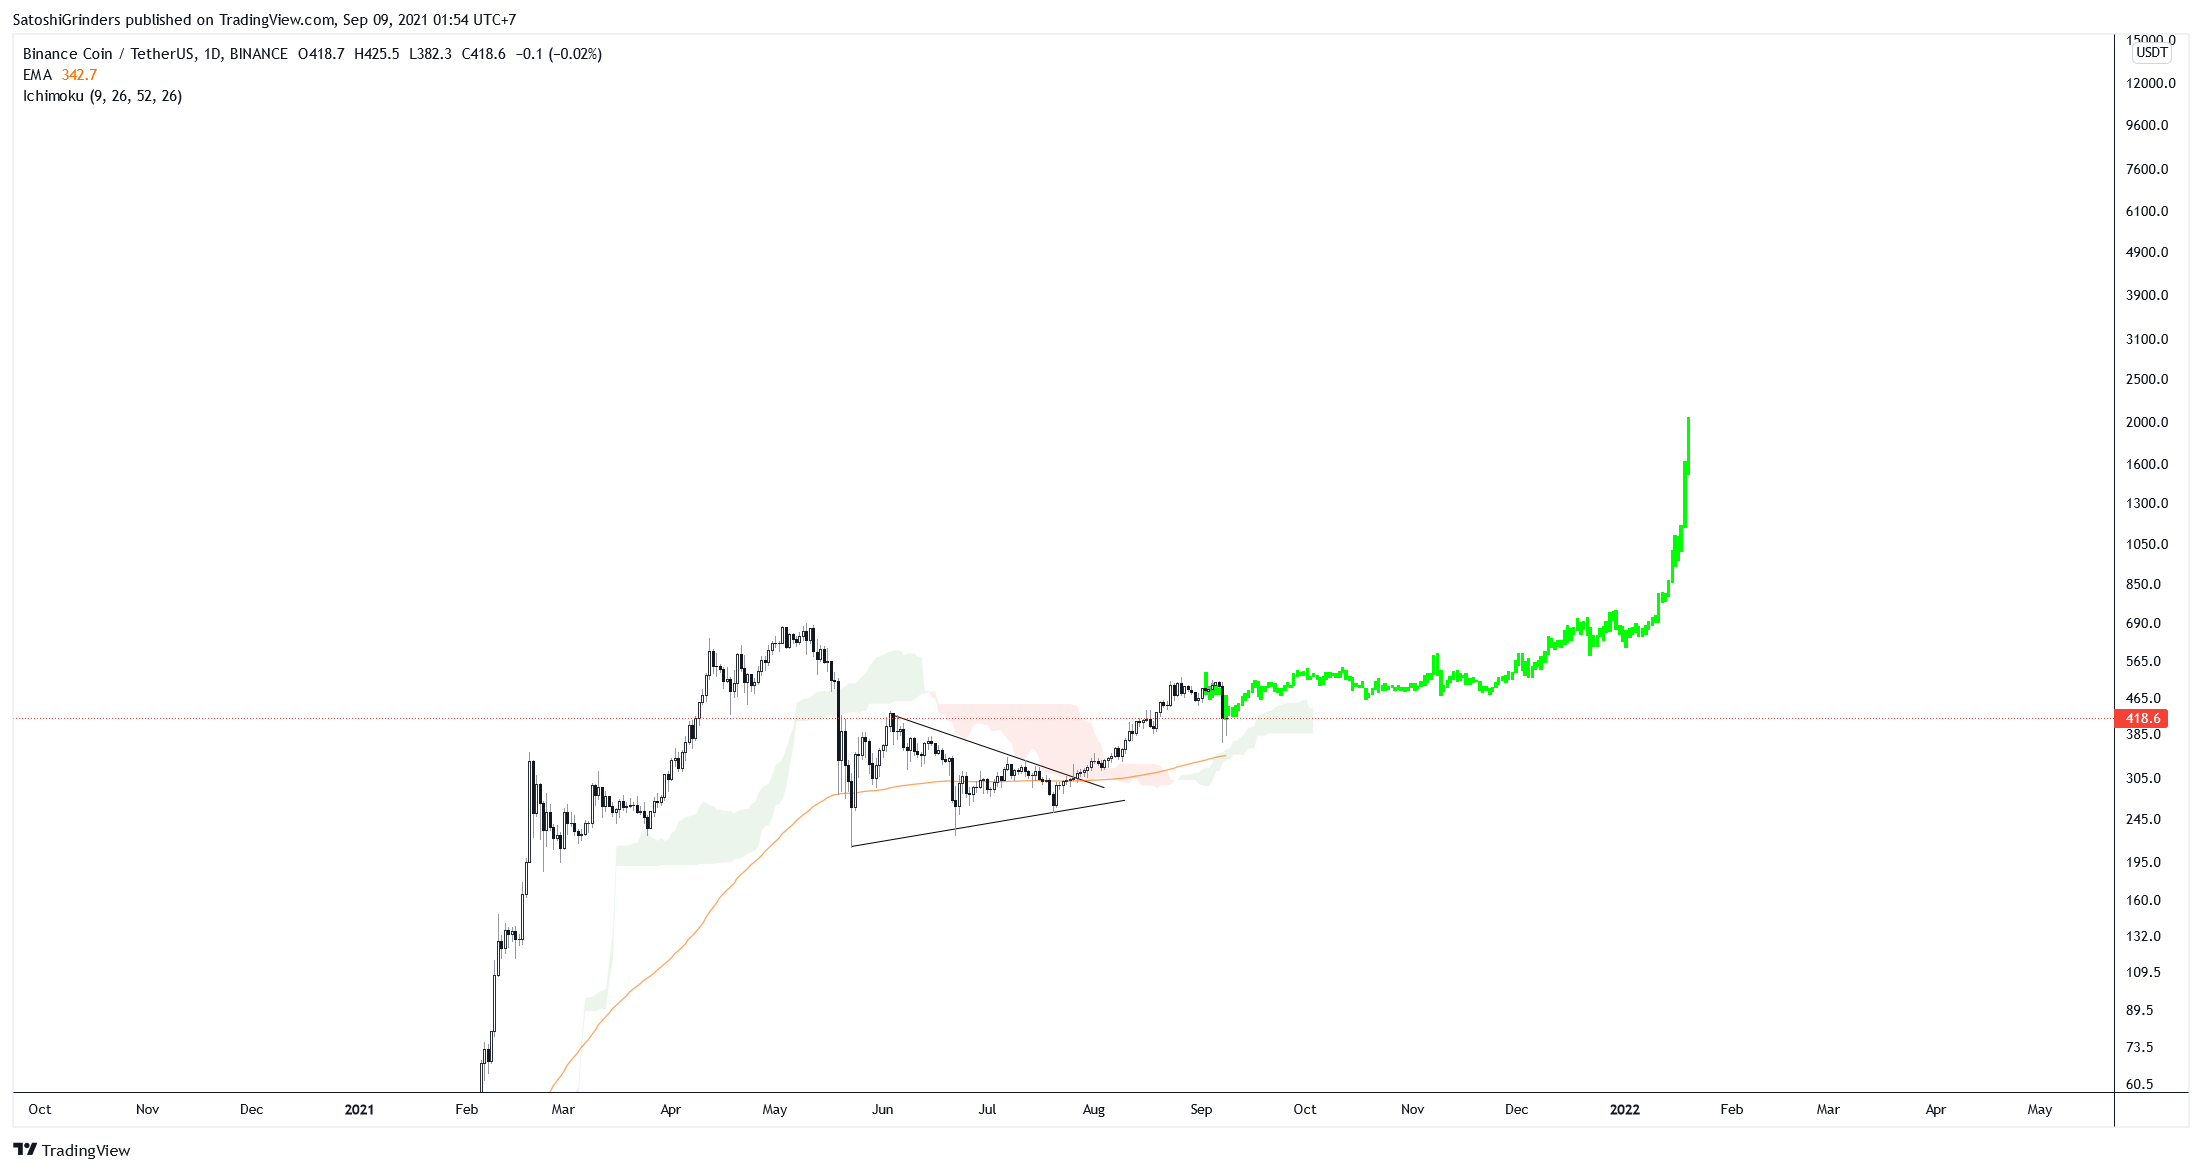
Cryptocurrency trader @Thebull_crypto outlined a BNB chart, stating that the token could go all the way to $2000 before the end of the year.
Due to the mixed readings from the weekly time-frame, a look at lower time-frames is required in order to determine if BNB will reach a new all-time high.
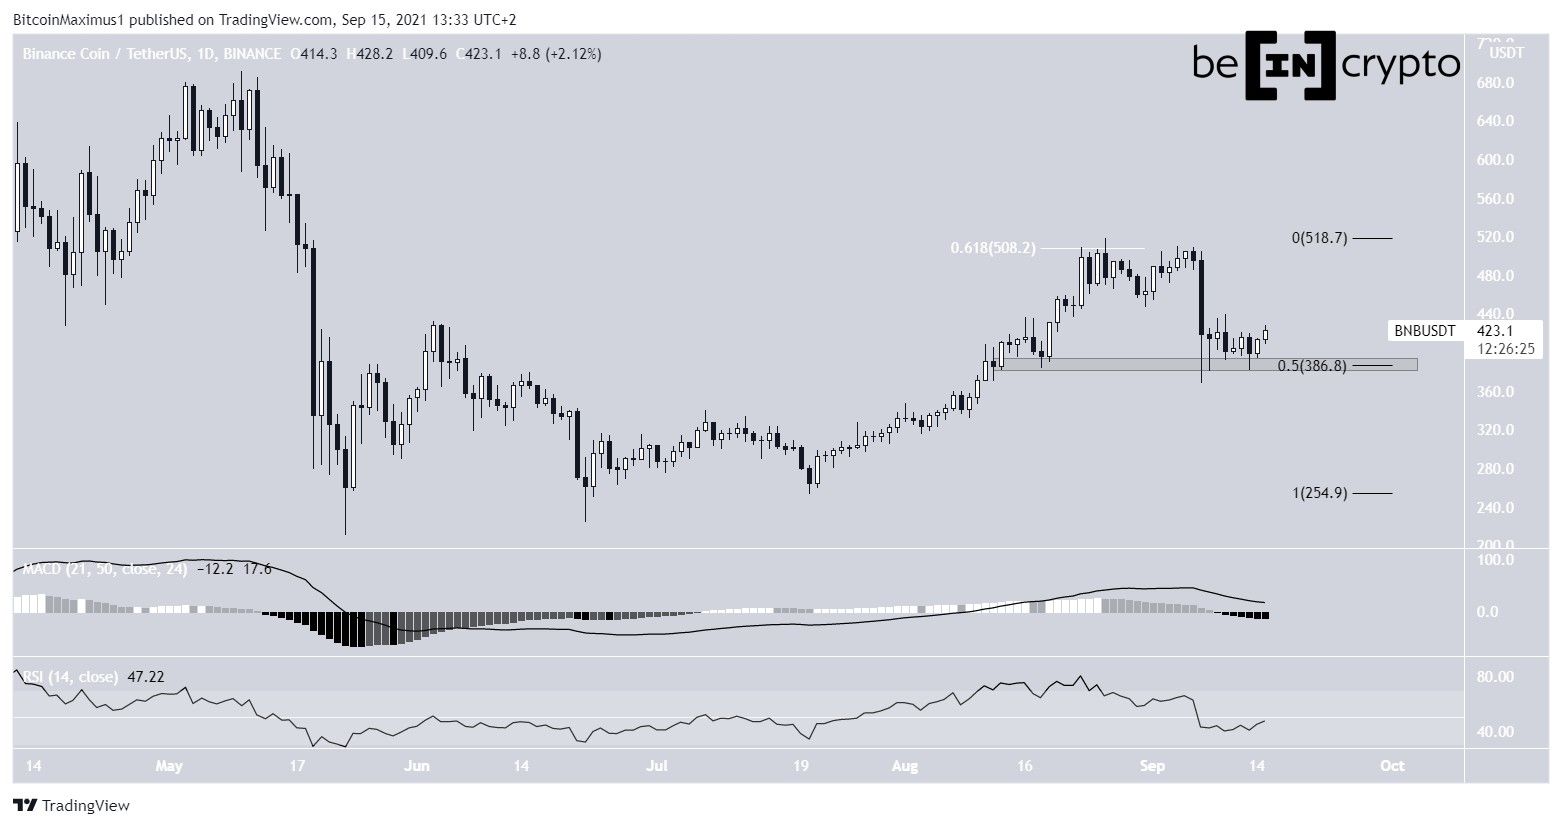
BNB gets rejected
BNB has been moving upwards since June 22. The upward movement continued until Aug 26, when the token reached a high of $518.9.
However, it has been moving downwards since, after it was rejected by the 0.618 Fib retracement resistance level. The downward movement accelerated on Sept 7.
After the drop, BNB bounced once it reached the 0.5 Fib retracement support level at $385. This is also a horizontal support area. But, despite the bounce, technical indicators in the daily time-frame are bearish. The MACD is decreasing and the RSI is below 50.
Therefore, there are conflicting signs from the price action and from technical indicators.
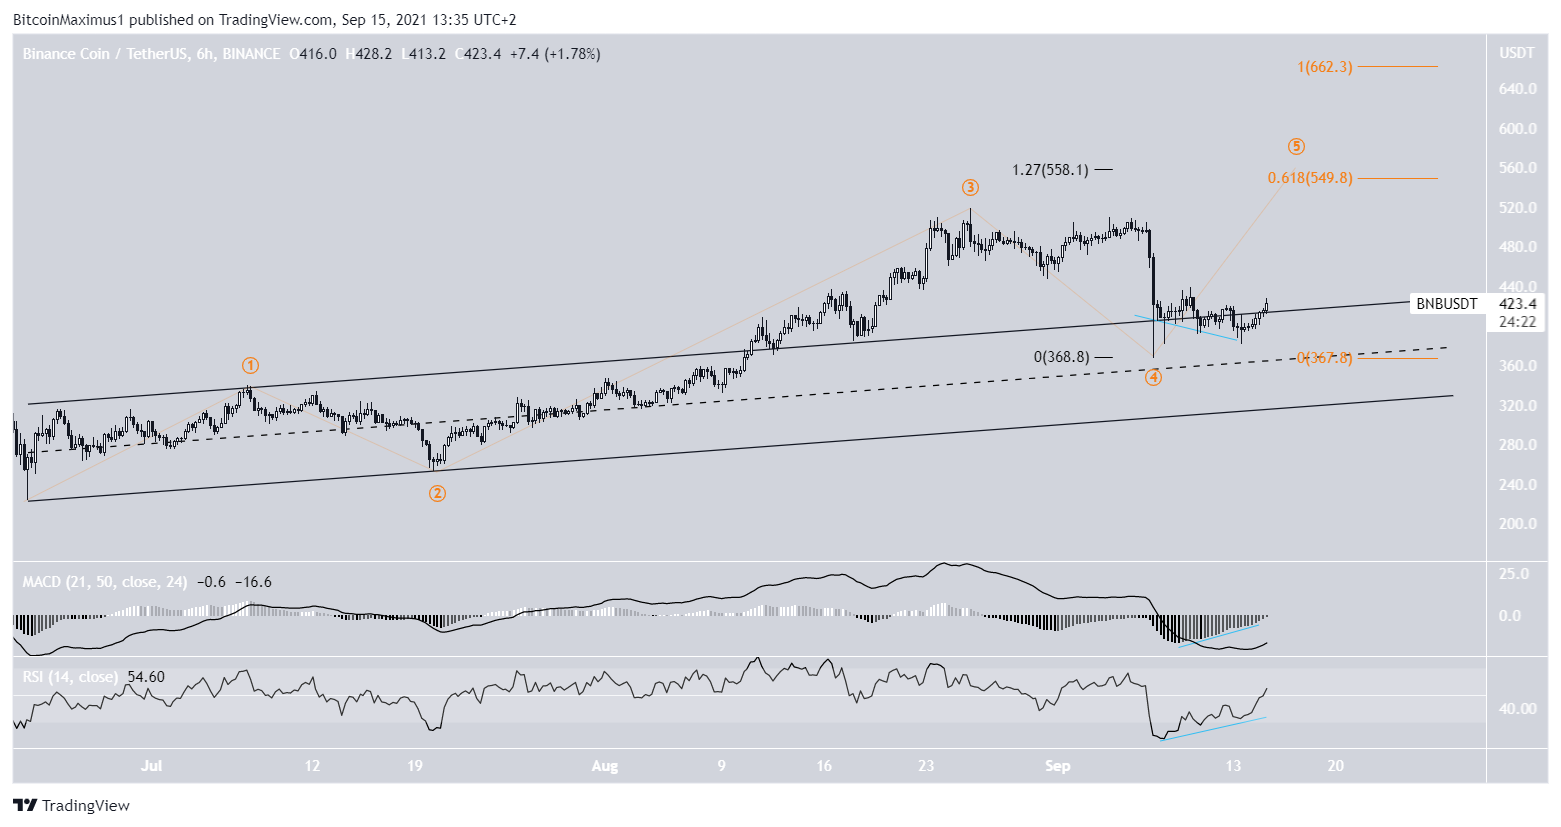
Ongoing bounce
The shorter-term six-hour chart is more bullish. It shows that BNB broke out from a parallel channel on Aug 11 and proceeded to reach the aforementioned high.
Afterwards, the ensuing drop resembles a fourth wave pullback.
If correct, the token will complete another upward movement before correcting.
The two most likely target for the top of the movement is between $550-$558. The target is found using the 1.27 external Fib retracement level (black) and 0.618 length of waves 1-3 (orange).
The next most likely target would be at $662.
For BeInCrypto’s latest Bitcoin (BTC) analysis, click here.


