


The Binance Coin (BNB) price has failed to break out and reach a new yearly high. Instead, the price has broken down from its bullish structure.
It is likely that BNB is in a correction and will decline towards the targets given below.
Failure to Reach All-Time High
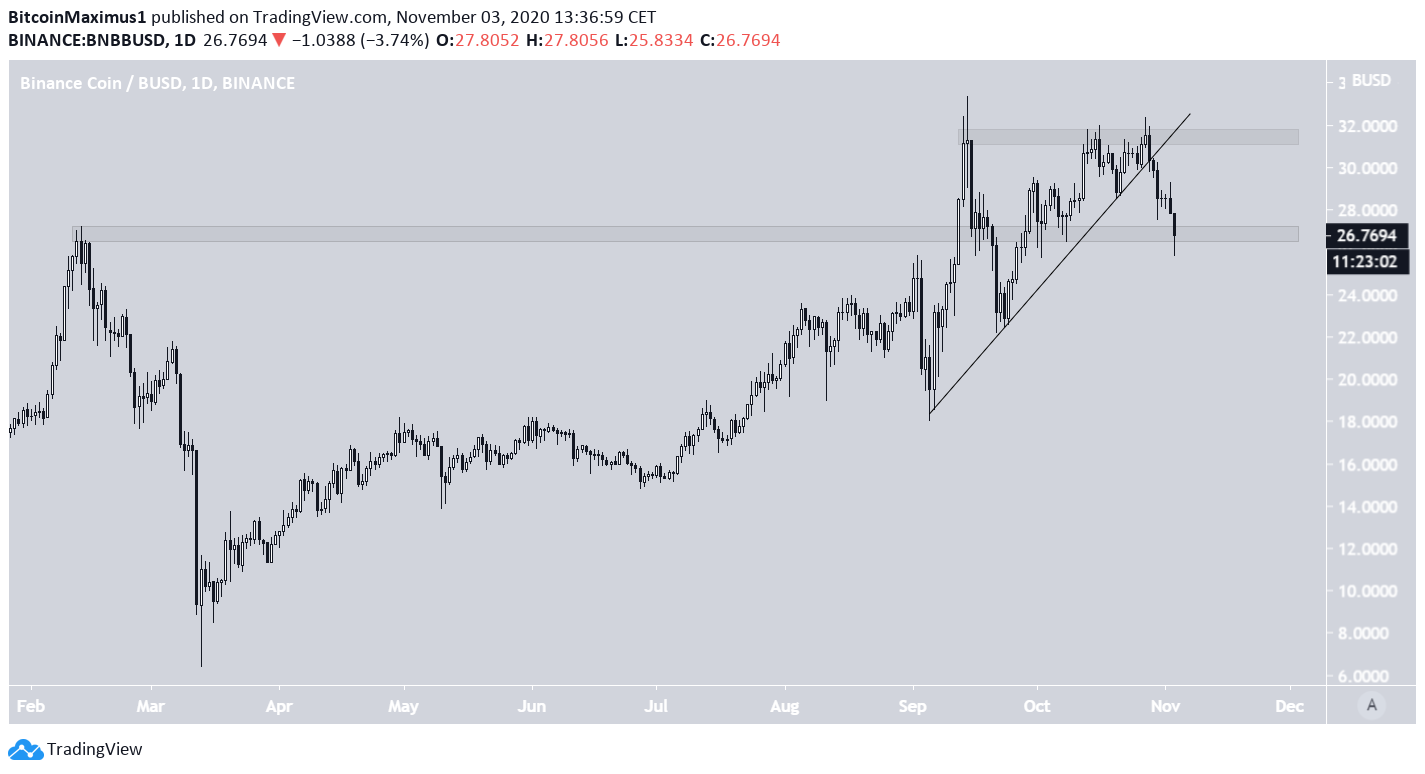
The BNB price has been following an ascending support line since it reached a low of $18.01 on Sept 5. Throughout the time the support line has been in place, the price has made several attempts to break out above the main resistance area found at $32.
However, after a third failed attempt, the price broke down from the support line and is now trading inside the $26.50 support level.
Future Movement
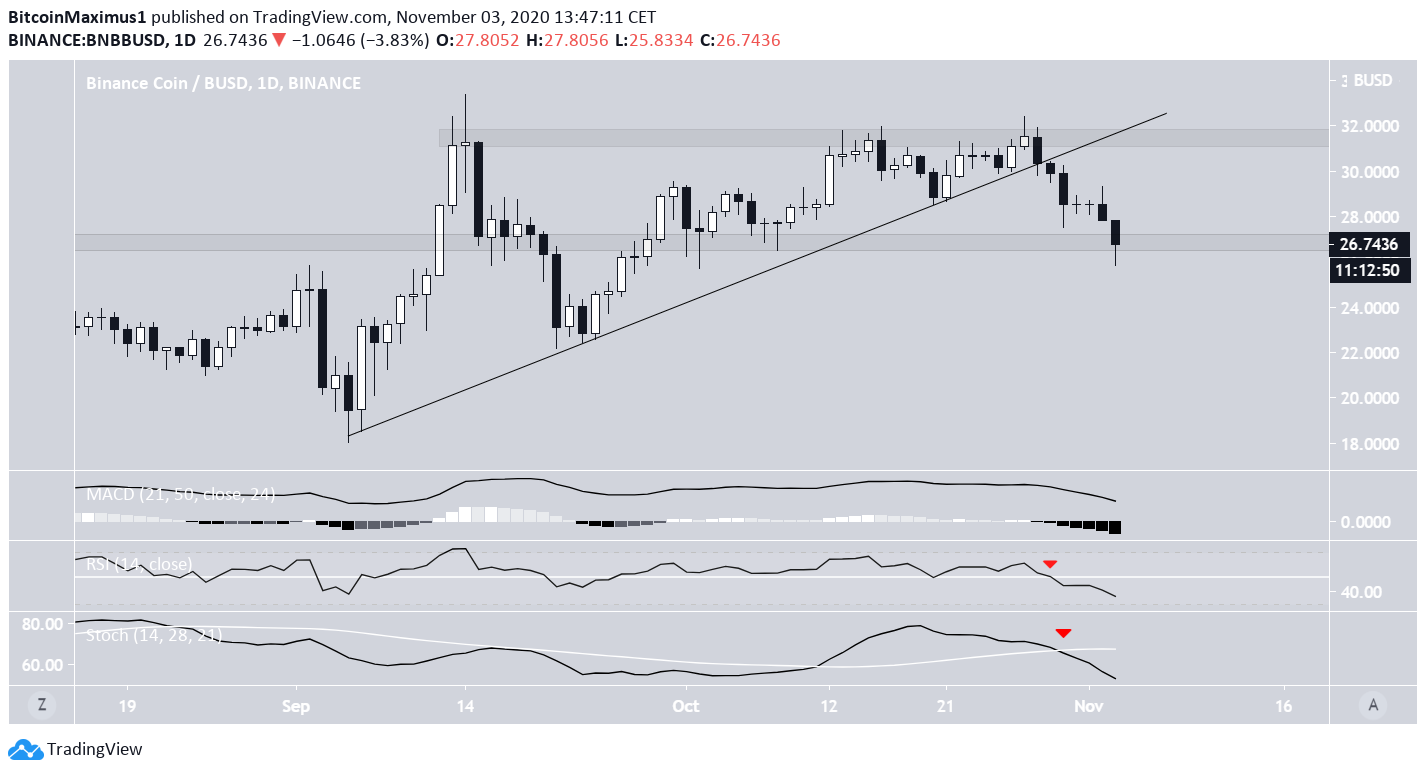
While BNB is trading above support, technical indicators are decisively bearish.
- The Stochastic Oscillator has already made a bearish cross.
- The RSI is below 50 and falling.
- The MACD has crossed into negative territory, even if its signal line is above 0.
Since there is no bullish divergence in place, there are no signs on the daily time-frame that indicate that the price will bounce from the current support area.
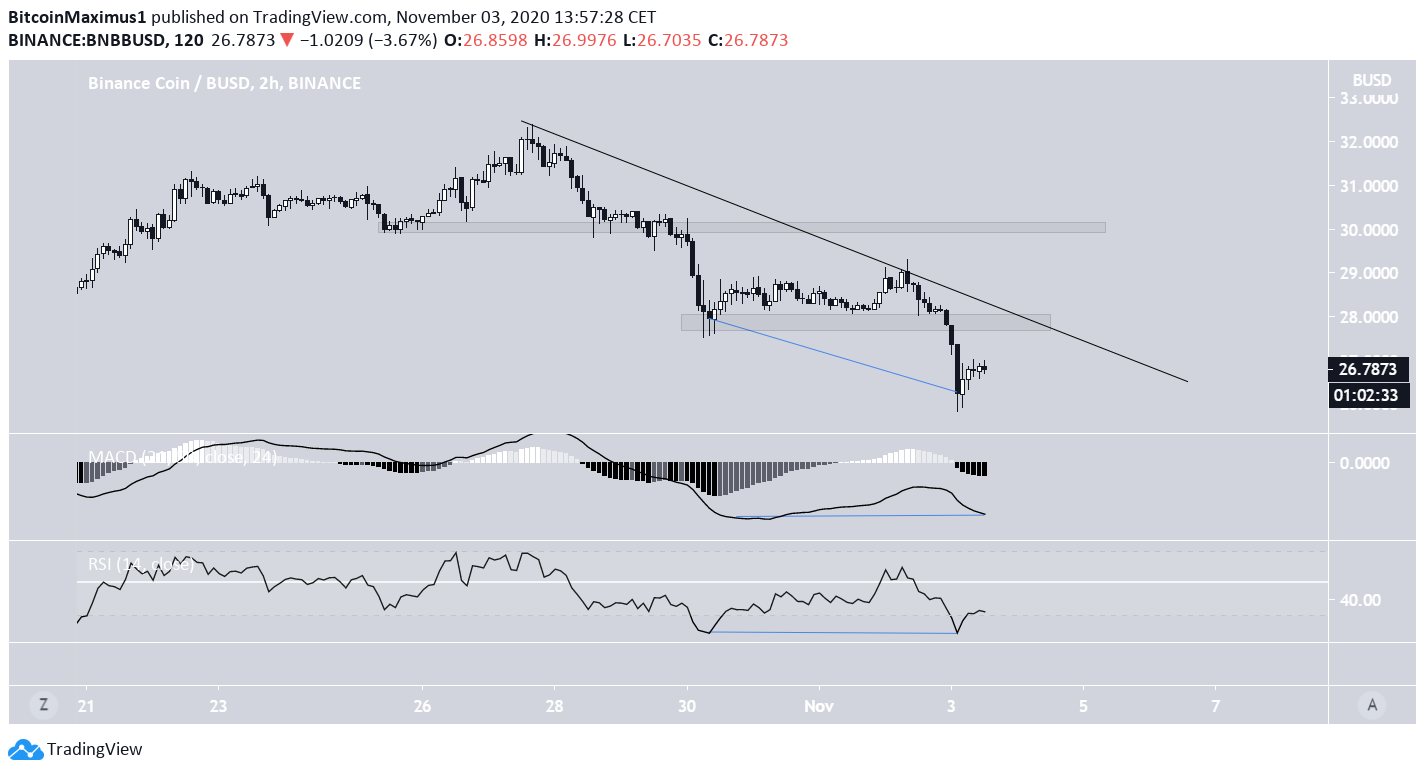
Despite the bearishness from the daily time-frame, the two-hour chart indicates that a short-term bounce could soon occur since both the MACD and RSI have generated bullish divergence.
The bounce would likely end near the descending resistance line and the $28 minor resistance area, but a potential breakout could take it all the way to $32.
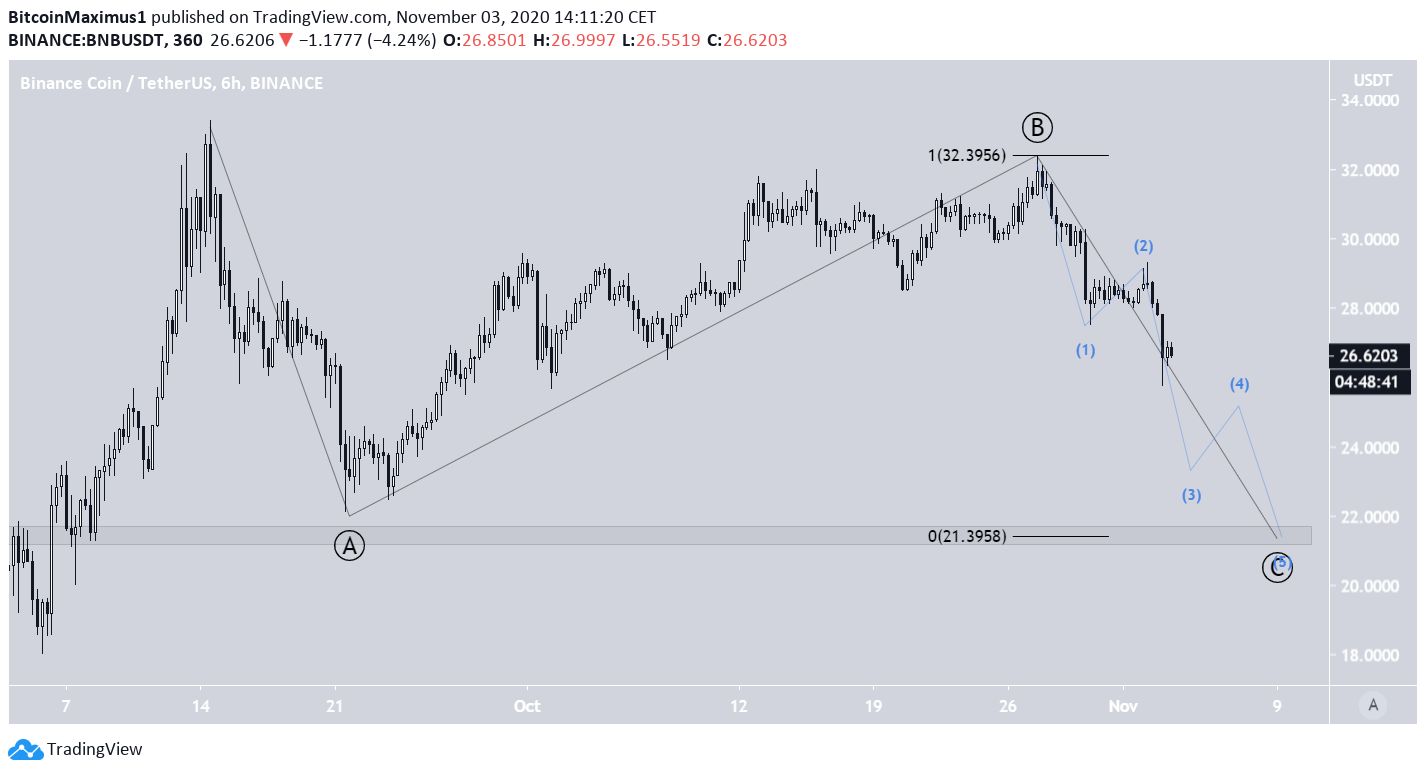
Wave Count
Cryptocurrency trader @TheEWguy stated that BNB has likely completed a short-term correction and could increase all the way to $33.20
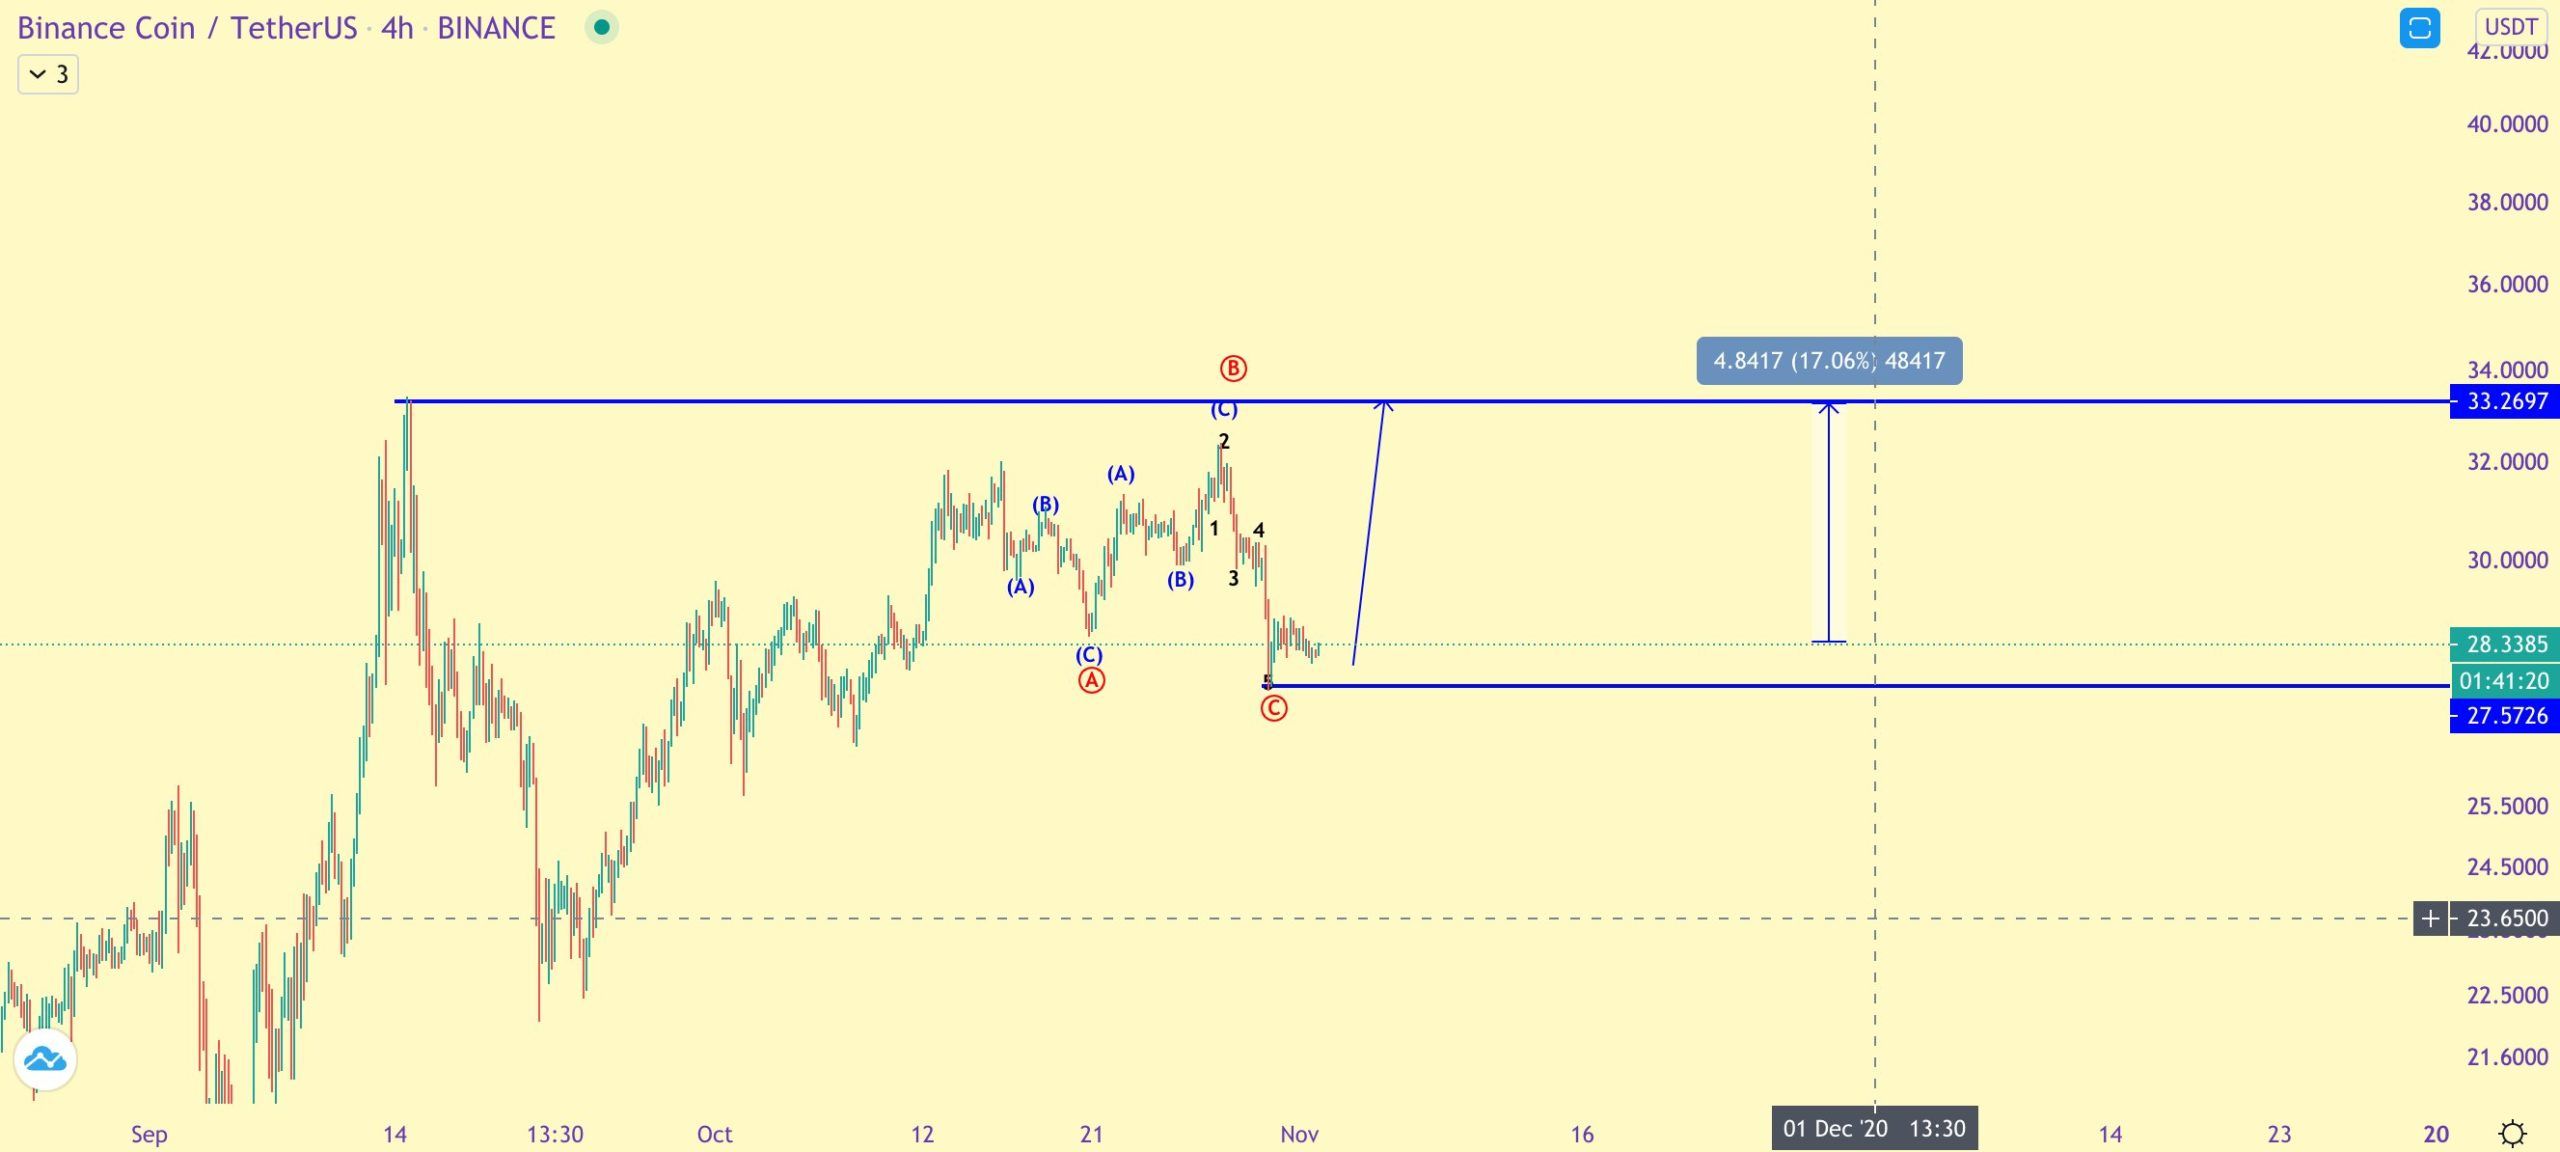
Since the tweet, the price has continued to decline, invalidating the given wave count.
Instead, it seems likely that BNB has completed the A and B waves of an A-B-C correction (shown in black below) and is currently in the C wave, which is taking place inside a five-wave formation (blue).
A likely target for Wave C to end is near $21.40. The target is an area that previously acted as support and is found by projecting wave A’s length to the top of wave B.
Conclusion
To conclude, while the BNB price could initiate short-term rallies, it should eventually break down from the $26 area and head towards the targets given above.
For BeInCrypto’s latest Bitcoin analysis, click here!
Disclaimer: Cryptocurrency trading carries a high level of risk and may not be suitable for all investors. The views expressed in this article do not reflect those of BeInCrypto.


