
Binance Coin (BNB) has been moving upwards since May 23 and has reclaimed the $330 support area.
While the token is expected to increase towards $450, the direction of the longer-term trend is not clear.
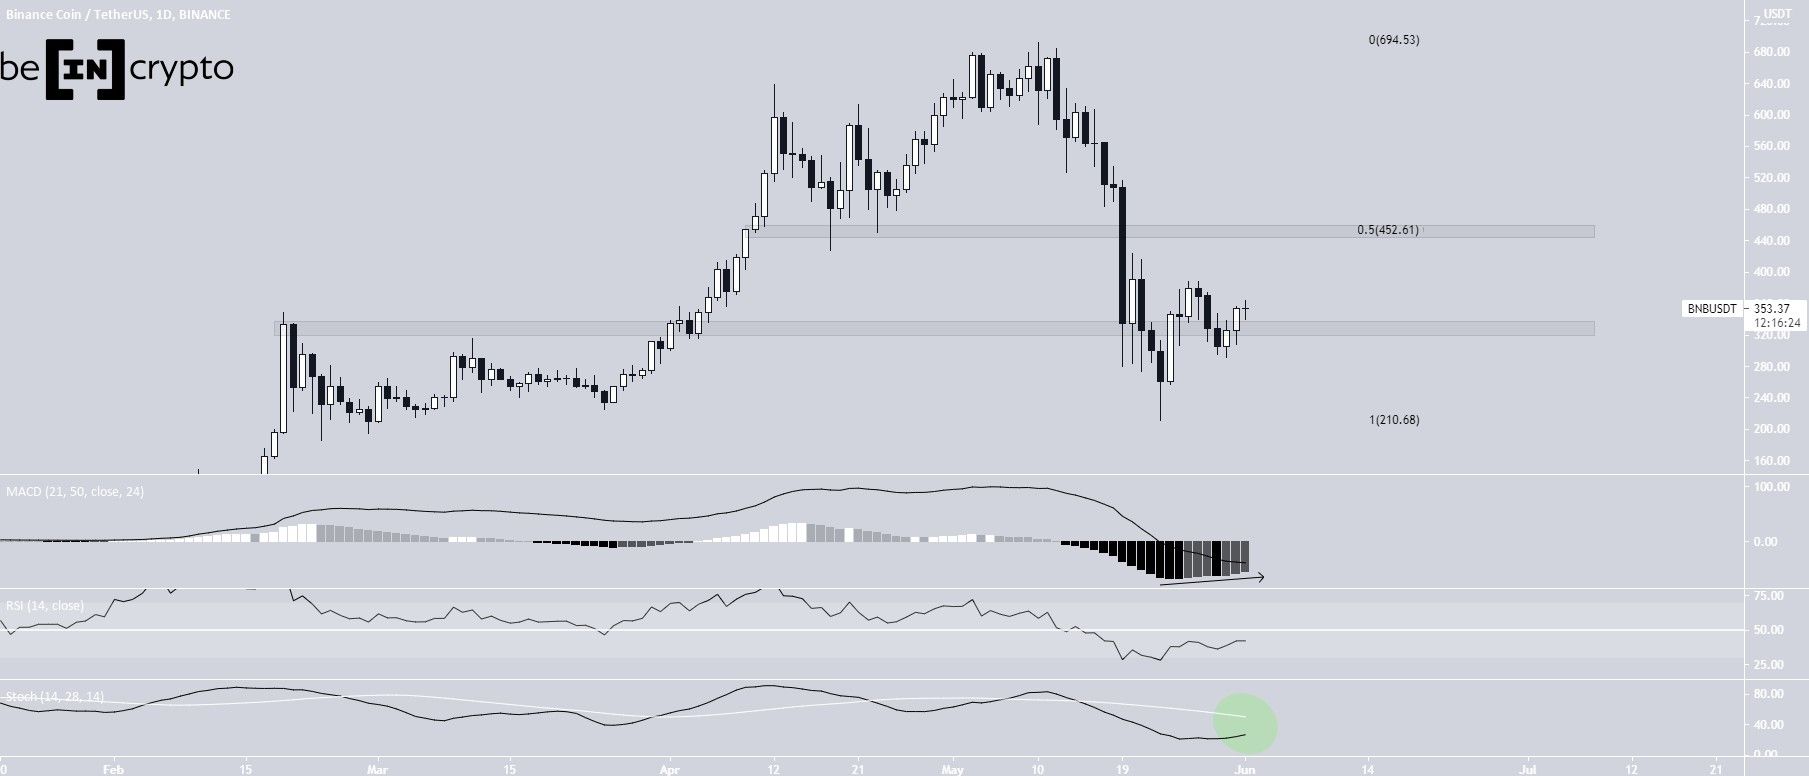
BNB reclaims support
On May 10, BNB reached an all-time high price of $691.77. However, it fell sharply immediately afterward. The downward movement culminated with a low of $211.70, reached on May 23.
The ensuing bounce caused the token to reclaim the $330 area. This is a bullish development that if sustained could lead to an upward movement.
In addition, the MACD is moving upwards and has given a bullish reversal signal. The RSI is below 50 and the Stochastic oscillator has yet to make a bullish cross. Despite this, both are moving upwards.
The next closest resistance area is found at $452. It is possible that BNB will consolidate between these levels before deciding the direction of its next movement.
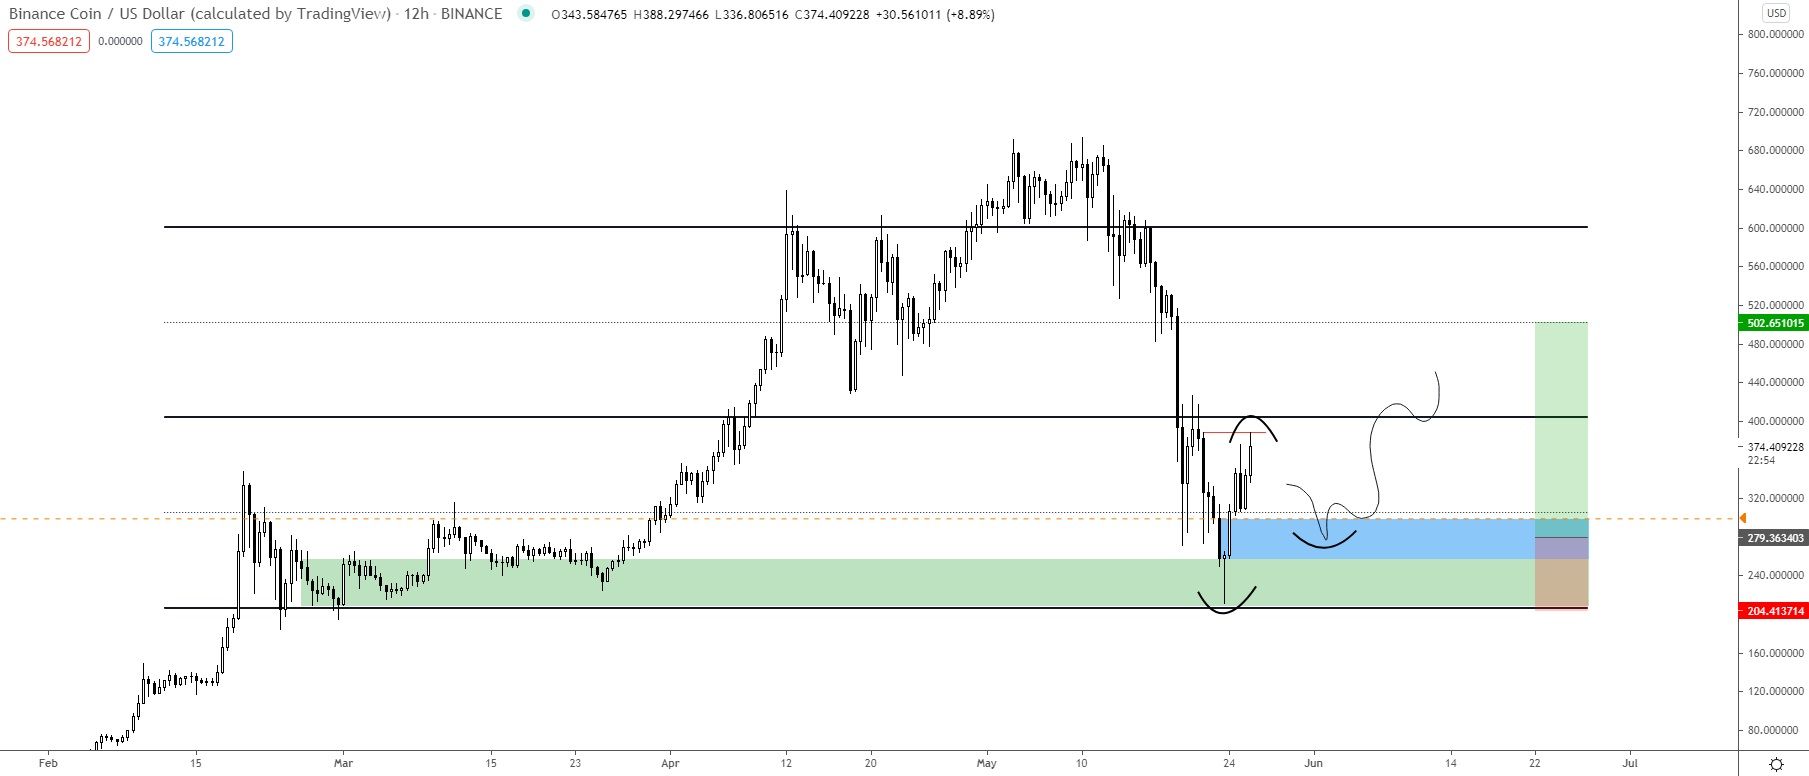
Cryptocurrency trader @TheEurosniper outlined a BNB chart, stating that another decrease towards the range low would present a good entry point. Since the tweet, the token has created a lower high inside the area and began to move upwards.
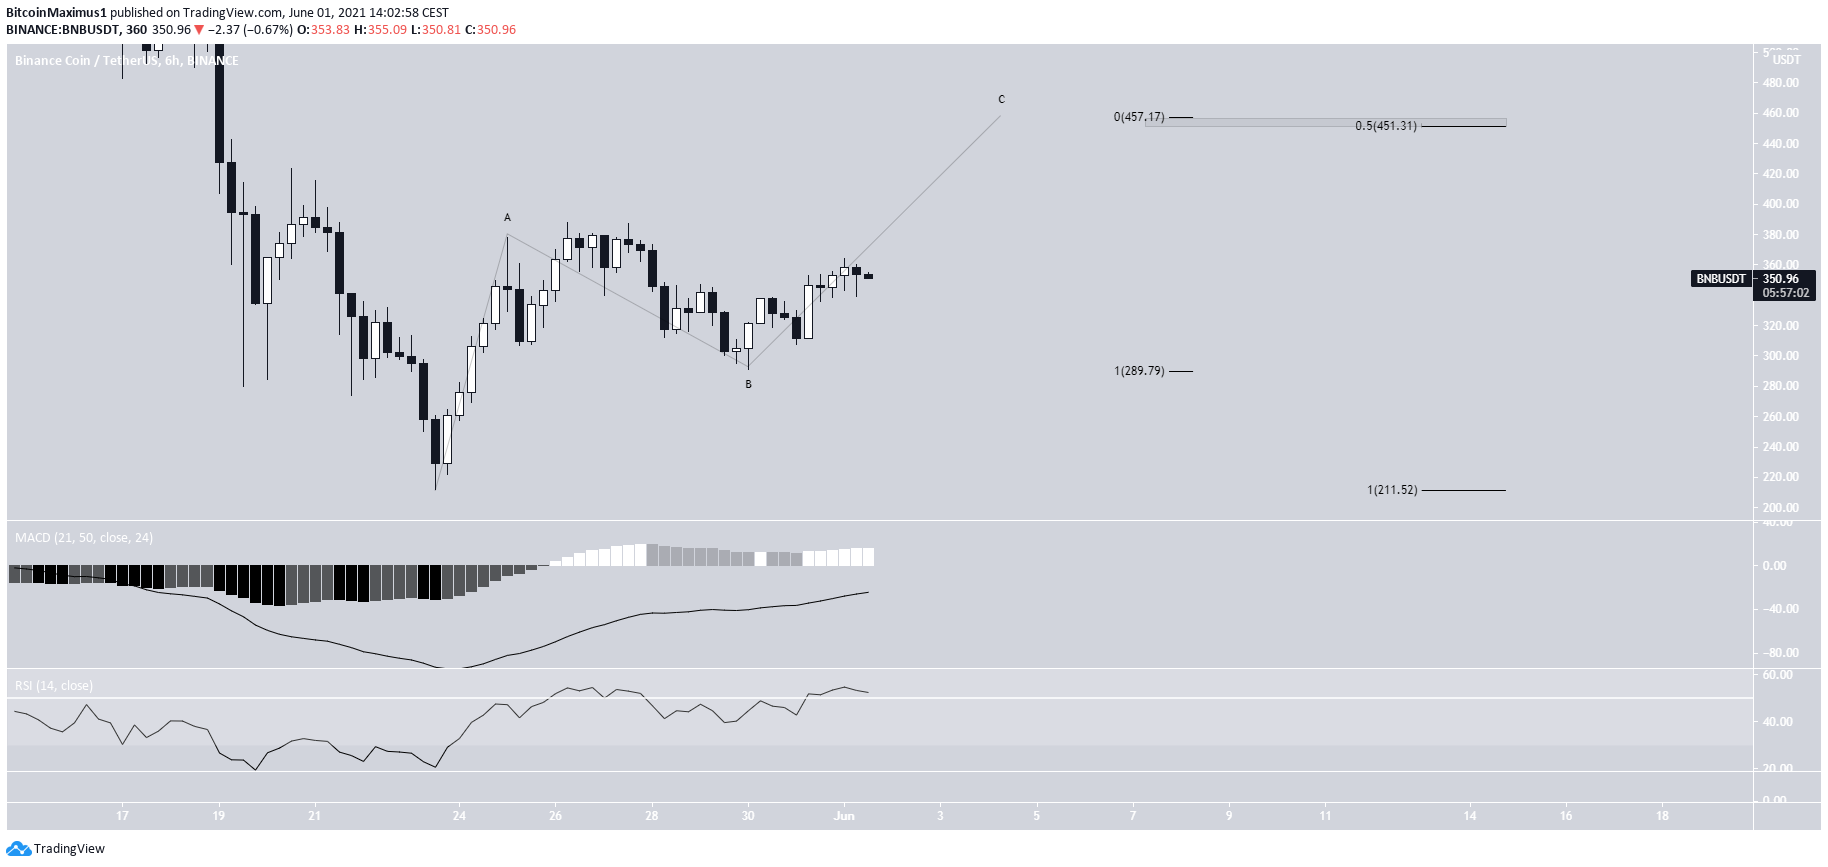
Short-term movement
The shorter-term six-hour chart supports the possibility of an upward movement towards resistance.
Even if the increase is only an A-B-C corrective structure, BNB would be expected to reach $450.
There is a confluence of resistance levels found between $452-$457. This is the 1:1 A: C ratio and the 0.5 Fib retracement level of the previous decrease.
Both the MACD & RSI support this upward movement.
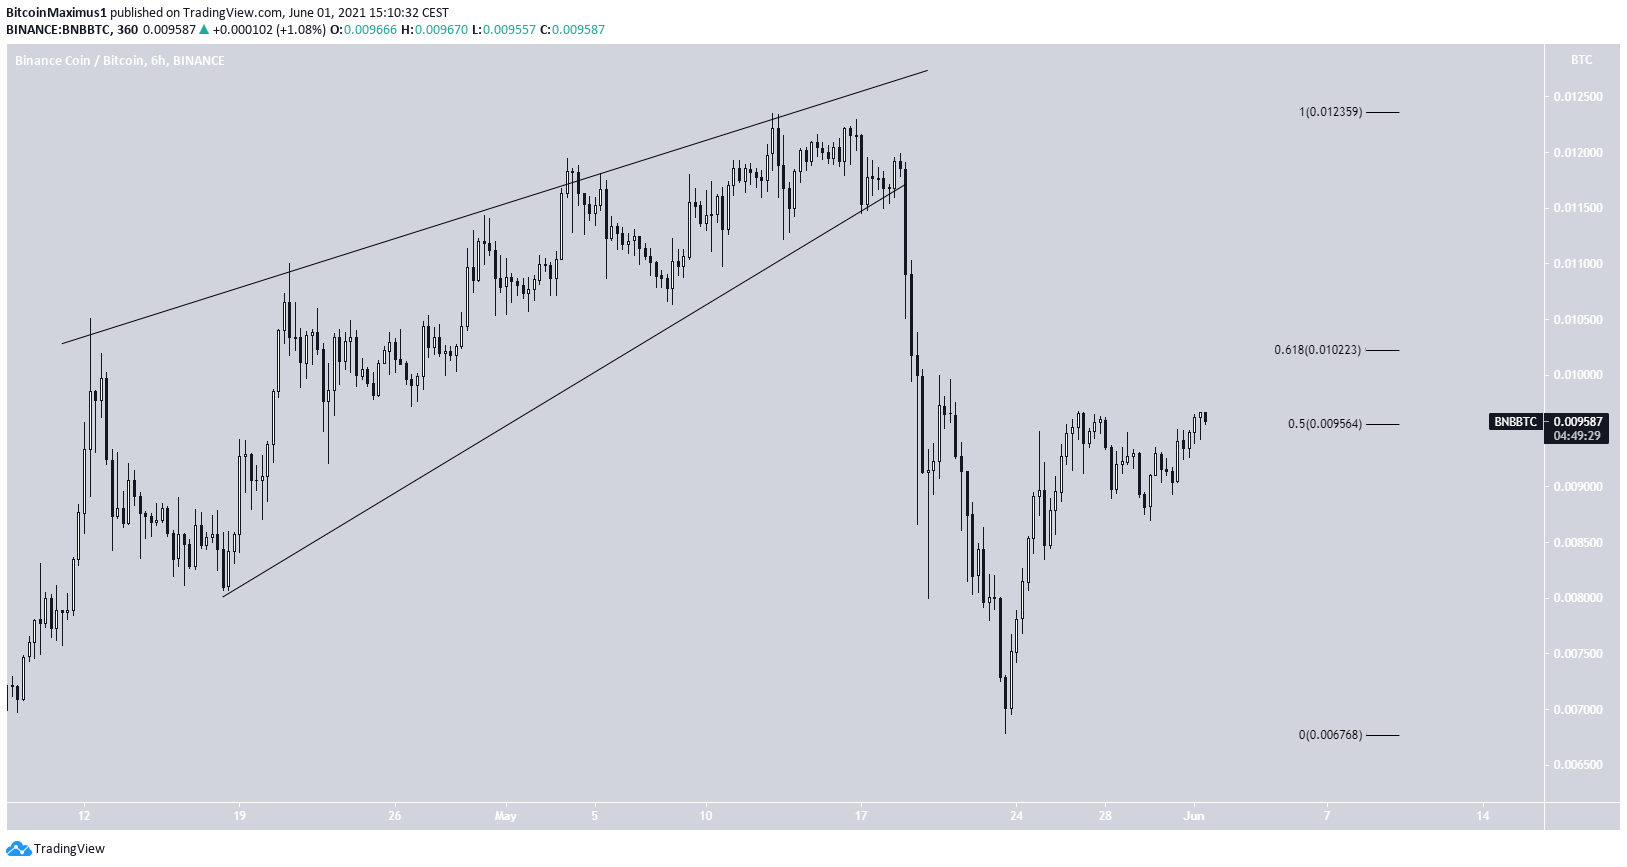
BNB/BTC
Right after reaching its all-time high price on May 12, BNB/BTC broke down from an ascending wedge. It is possible that this was an ending diagonal.
The ensuing decrease looks impulsive, supporting this possibility.
In this case, the token is likely to get rejected near inside the 0.5-0.618 Fib retracement resistance are and resume its downward movement.
For BeInCrypto’s previous bitcoin (BTC) analysis, click here.
