


The price of Binance Coin (BNB) reached a high of nearly $16 on Mar 7, 2019. A sharp drop followed. Binance Coin has been on a gradual uptrend since.
Here is the market outlook from Mar 7 to Mar 15:
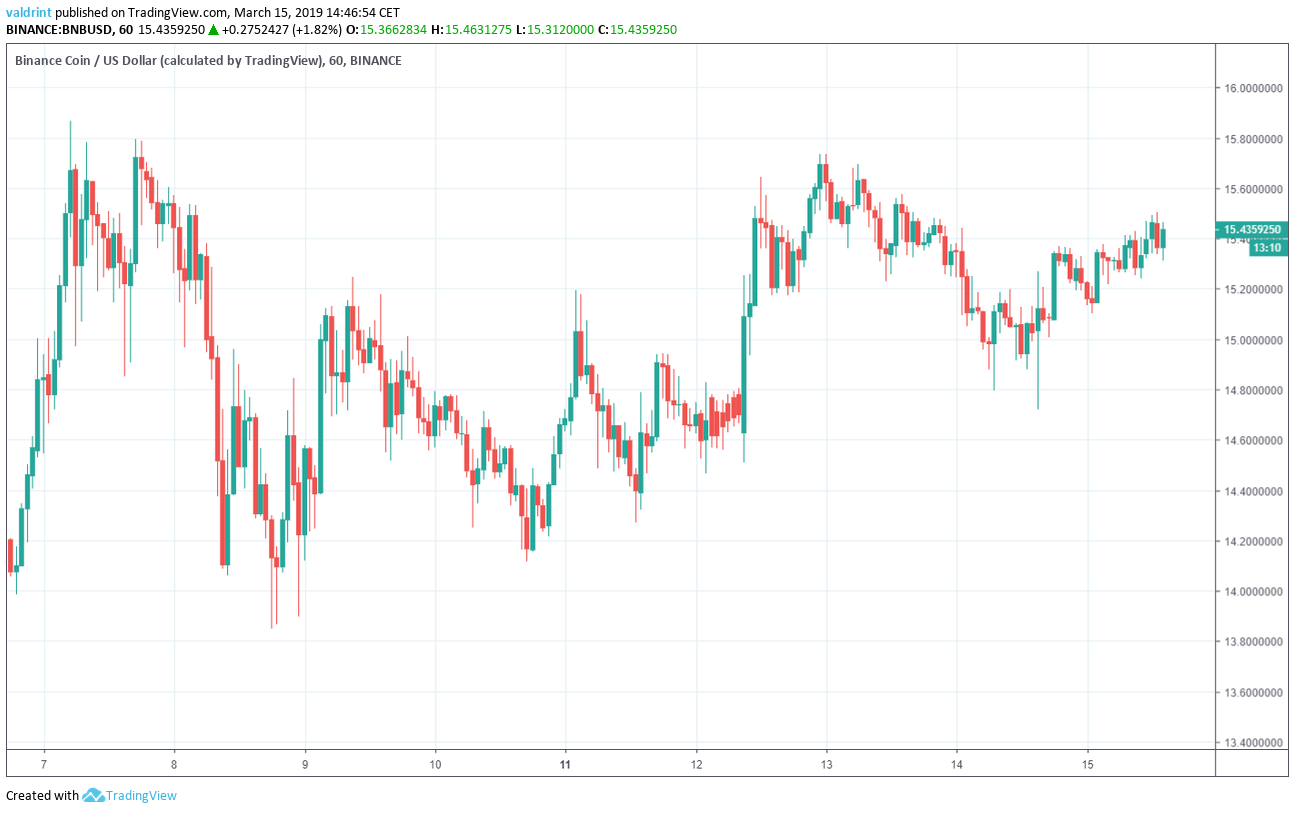
In our Mar 11 analysis of Binance Coin, we predicted that the price would trade within a symmetrical triangle before experiencing a breakdown below support. Our prediction was invalidated the following day when prices broke out above the support. Subsequent price increases followed with a gradual decline on ar 13 and 14. Since that time, prices have rebounded and are currently increasing at the time of writing.
Based on today’s analysis, we predict that the price of BNB is likely to experience slow growth during the coming days, before eventually making a decisive move. We believe that an upward move is more likely to occur.
Key Highlights For March 15
- The price of Binance Coin has been on a gradual uptrend since Mar 8.
- It is trading inside an ascending triangle.
- The MACD and SMAs have triggered a buy signal.
- There is resistance near $15.5 and $17.
- There is support near $11 and $9.5.
Ascending Support
The price of BNB on Binance is analyzed at one-hour intervals from Mar 7 to Mar 15.
The price made a low of $13.84 on Mar 8. It has been on a gradual uptrend since, with each low being higher than the previous one. Tracing these lows gives us an ascending support line.
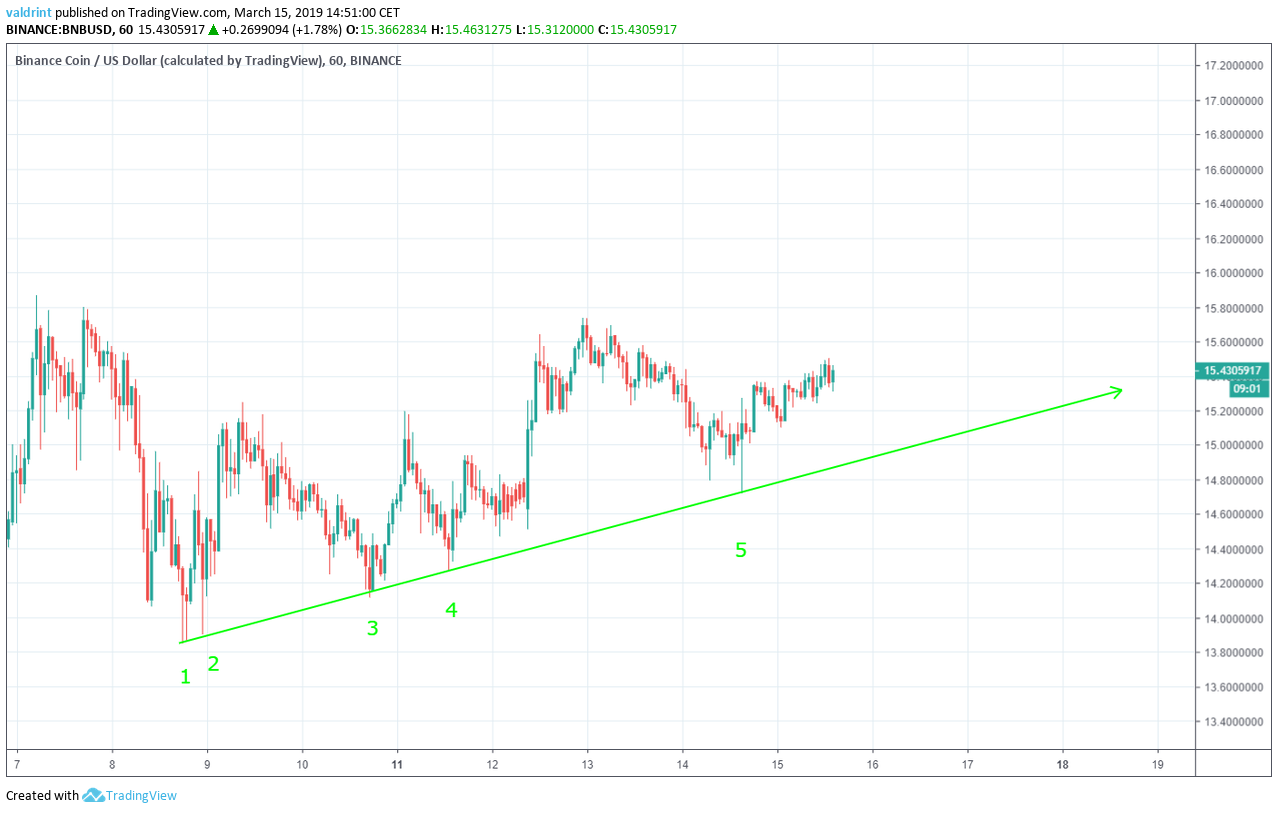
The support line acts as a floor to price, preventing further downward movement. It traces the theoretical lower limits of the price. It also measures the rate of increase.
The price has increased at the same rate as predicted by the support line.
It is likely that the price will keep increasing at the same rate as predicted by the line until a breakout occurs. The support line alone is not sufficient in determining when a breakout will occur.
Ascending Triangle
Binance Coin made a high of $15.86 on Mar 7. A rapid drop ensued. Since then, the price revisited the same level three times. Tracing these highs gives us the horizontal support line.
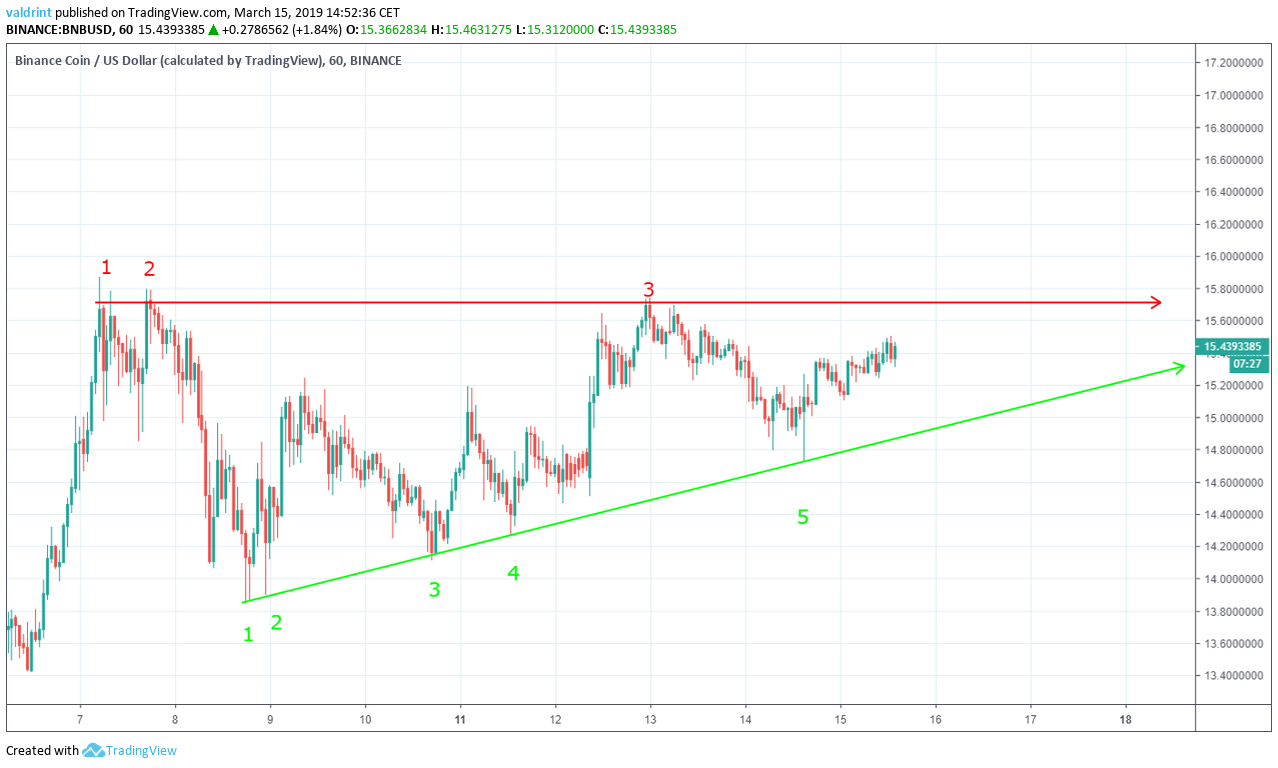
Similar to the support line, the horizontal line acts as a ceiling to price, preventing further upward movement.
The support and resistance lines combine to create an ascending triangle, which is a bullish pattern, making price increase more likely.
It is likely that BNB trades within the confines of this triangle until a point of convergence occurs. At that time a breakout is more likely.
Signal Triggered
The moving average convergence divergence (MACD) is a trend indicator that shows the relationship between two moving averages (long and short-term) and the price. It is used to measure the strength of a move.
Combined with simple moving averages (SMA), MACD can be used as a trigger for buy and sell signals. Signals are triggered whenever the MACD line is above 0 and the price is above the 21 (red) and 50-period (green) SMAs.
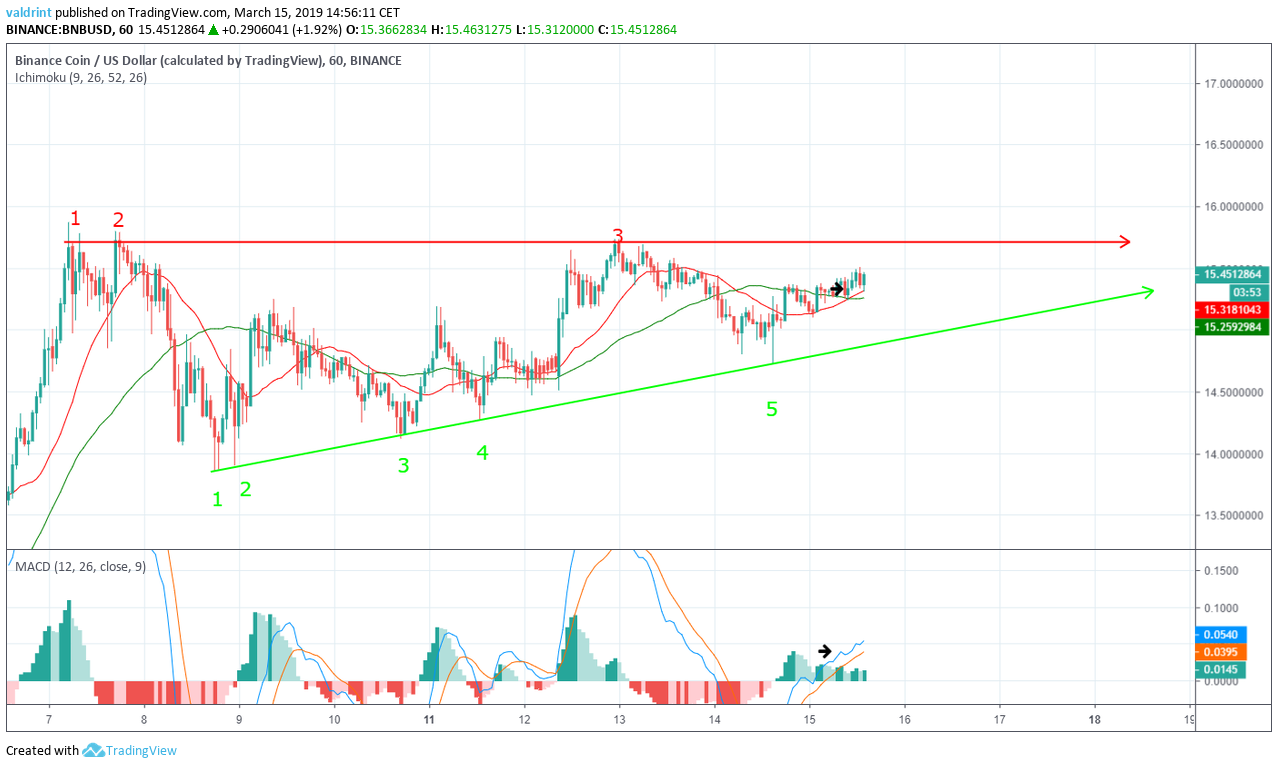
On Mar 15, the price initiated a gradual upward move which took it above the 21 and 50-period moving averages.
During the same interval, the MACD line crossed above 0. This would have triggered a buy signal, indicating that the current trend may be over and a new uptrend may begin.
This would be invalidated by a price movement below the 21 and 50-period SMAs and a MACD line cross below 0.
Using these indicators, it is likely that when a convergence point is reached, the price of BNB will break out of the resistance.
Future Movements
The price of BNB on Binance is analyzed at 12-hour intervals from Jun 1, 2018 to Mar 15, 2019 in order to better visualize possible reversal areas.
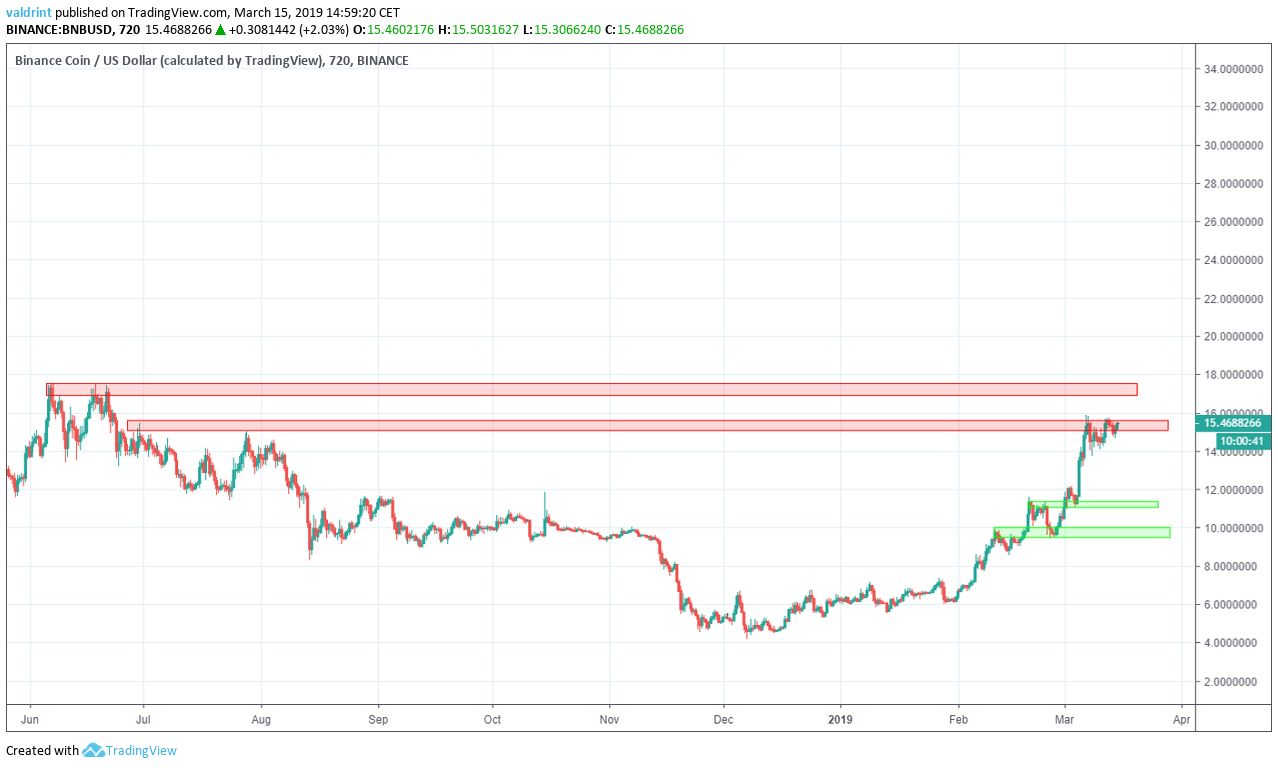
Resistance and support lines are created when the price visits the same level several times and are helpful in locating potential reversal areas.
The first resistance area is found near $15.5, where price is currently trading at. The second one is found near $17.5. If the price were to break out of the ascending triangle, it would provide a likely reversal area.
The first support area is found near $11, while the second one is found near $9.5. If the price were to break down from the triangle, these two would provide likely reversal areas.
Summary of Analysis
Based on this analysis, the price is likely to touch the horizontal resistance line before eventually breaking out. If it touches the resistance line, this prediction will be partially validated. If it eventually breaks out, it will be fully validated.
Do you think we’ll see a break out for Binance Coin or are price decreases soon to come? Let us know your thoughts in the comments below.
Disclaimer: This article is not trading advice and should not be construed as such. Always consult a trained financial professional before investing in cryptocurrencies, as the market is particularly volatile.


