


Binance coin (BNB) has been increasing since April 18 and managed to reach a new all-time high price on May 3.
While the BNB/USD trend is still bullish, BNB/BTC is showing signs of weakness.
BNB all-time high
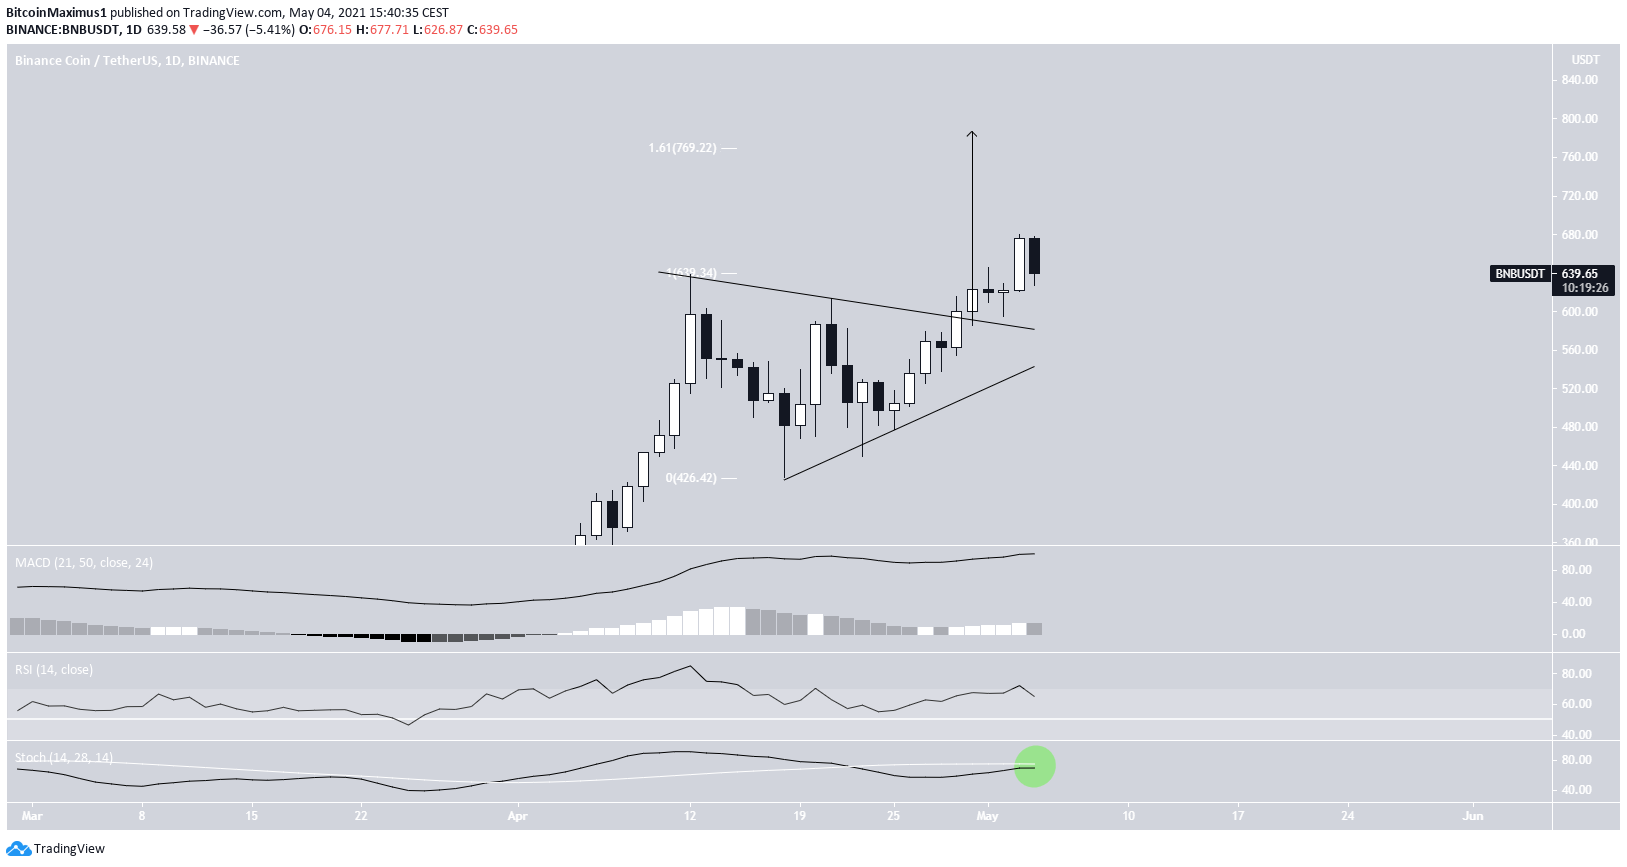
BNB was trading in a symmetrical triangle since reaching a then all-time high price of $638 on April 12. On April 29, it broke out and has been moving upwards since.
So far, it has reached a new all-time high price of $680, doing so on May 3. This caused it to become the third cryptocurrency with a market capitalization above $100 billion.
Technical indicators are bullish, supporting the continuation of the upward movement. The RSI is moving upwards, being close to the 70 line. Furthermore, the Stochastic Oscillator is close to making a bullish cross.
A likely target for the top of the movement is found near $770. This is both the 1.61 external Fib retracement of the most recent downward movement, and the height of the triangle projected to the level of the breakout.
Re-test of support?
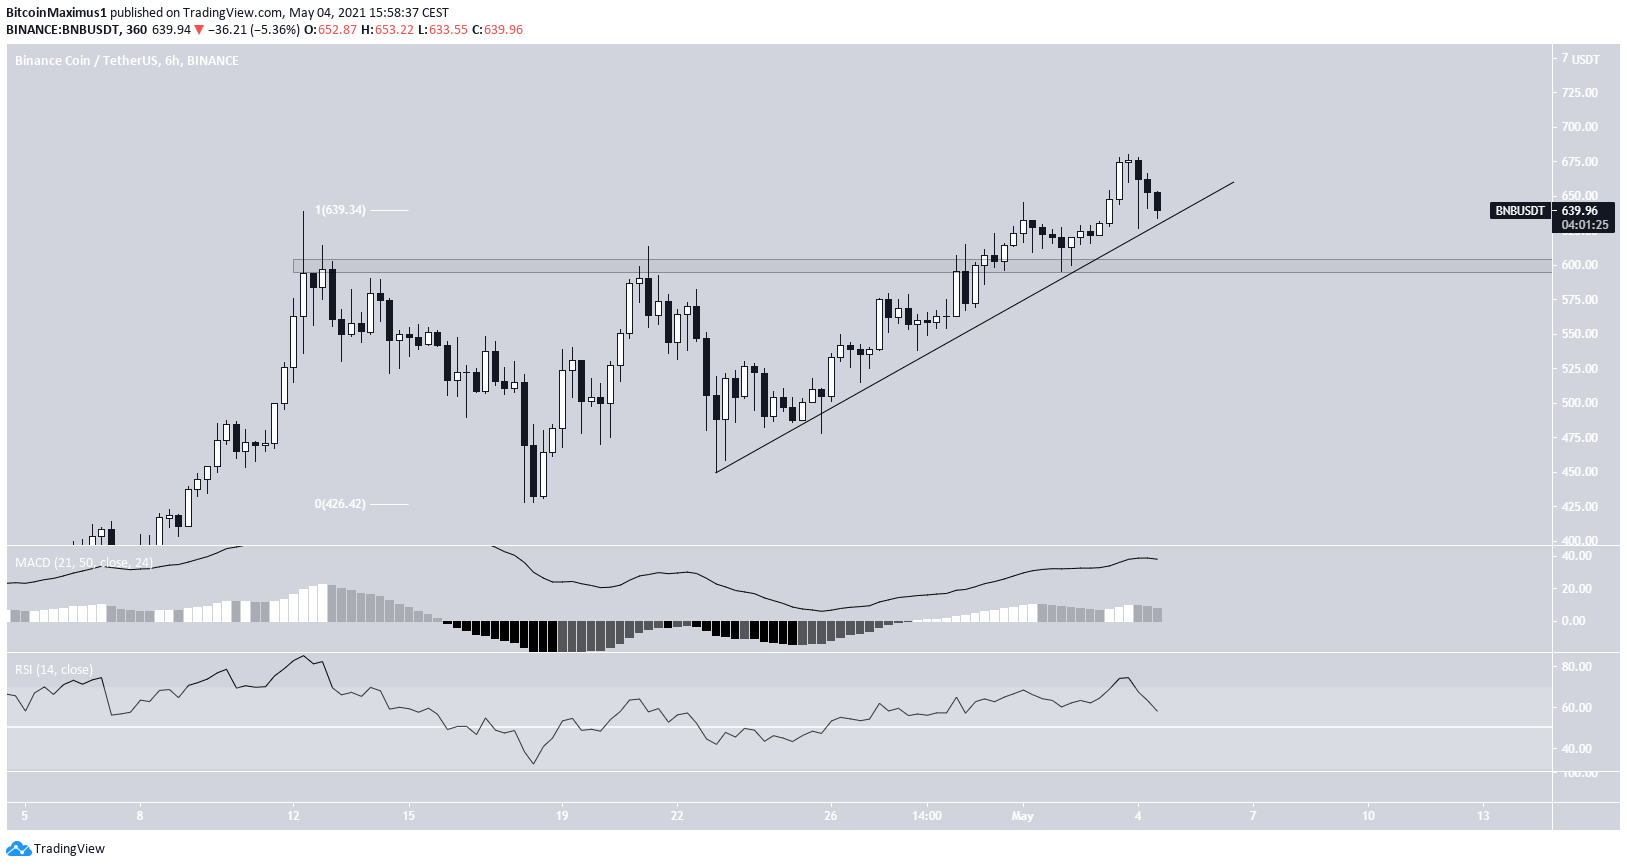
The shorter-term six-hour chart shows that the main support area is found at $600. This area previously acted as resistance, but BNB returned in order to validate it as support on May 2.
Furthermore, the token is following an ascending support line, in place since April 23. As long as it is trading above it, the trend is considered bullish. Even if BNB were to break down, it would likely re-test $600 before moving upwards.
Therefore, as long as the price is trading above $600, the trend is considered bullish.
BNB/BTC
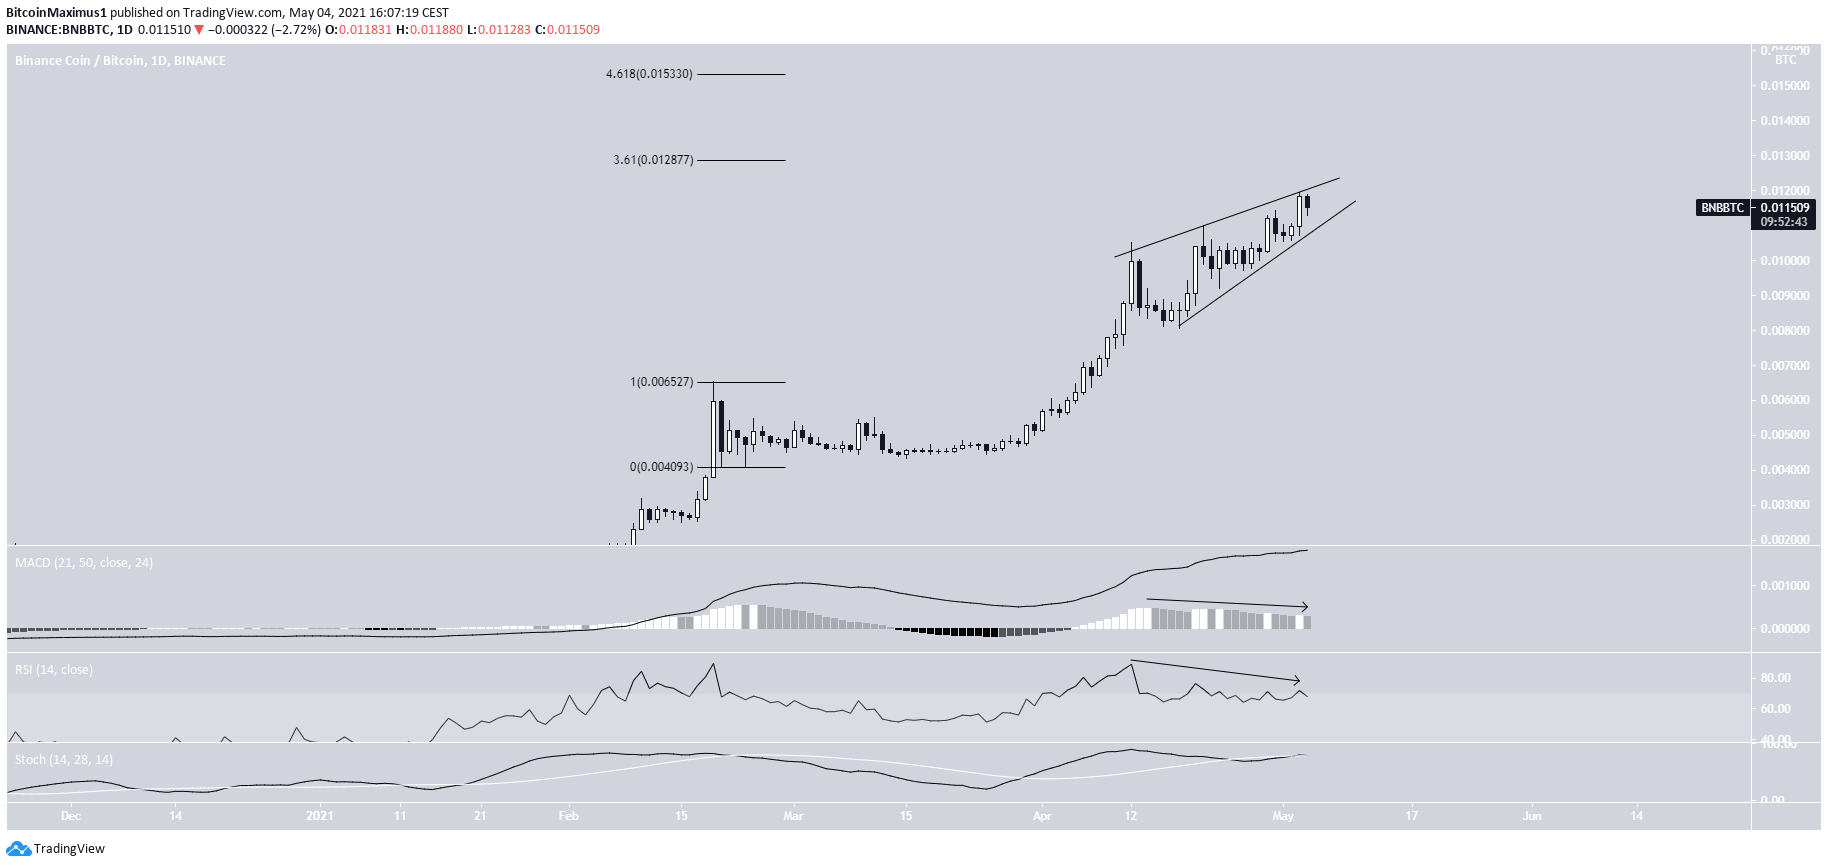
The BNB/BTC pair is not as bullish as its USD counterpart. While it has also been increasing in April, it is potentially trading inside an ascending wedge, which is considered a bearish pattern.
Furthermore, the pattern is combined with bearish divergence in both the RSI & MACD. Also, it is approaching a crucial resistance level at ₿0.0128.
Therefore, it is possible that the upward movement is coming to an end.
For BeInCrypto’s latest bitcoin (BTC) analysis, click here.


