


BitTorrent is the world’s largest peer-to-peer (P2P) filesharing network. It was acquired by the TRON Foundation in July 2018.
On 2019, an ICO for TRON’s BitTorrent Token (BTT) was hosted on Binance Launchpad on Jan 28, 2019.
Monthly airdrops of BTT occur on the 11th of every month until Feb 11, 2025. The first airdrop occurred on Mar 11, 2019. Anyone who owned BTT prior to this date received free tokens.
These airdrops are scheduled to continue on the 11th of every month until Feb 11, 2025. The next airdrop is scheduled to be on Apr 11.
To learn more about BitTorrent airdrops, click on the green button below:
BiTTorrent Tokens Monthly Airdrops Info
Now let’s compare the prices of TRON and its pet project. We’ll start with BitTorrent Token:
BitTorrent Token (BTT) Technical Analysis
BitTorrent Token (BTT): Trends And Highlights for April 10.
- BitTorrent Token has been on a gradual downtrend since Apr 2.
- BTT is trading inside a symmetrical triangle and below the 20- and 50-period moving averages.
- There is resistance near $0.00081 and support near $0.000725.
About the Current Trading Pattern
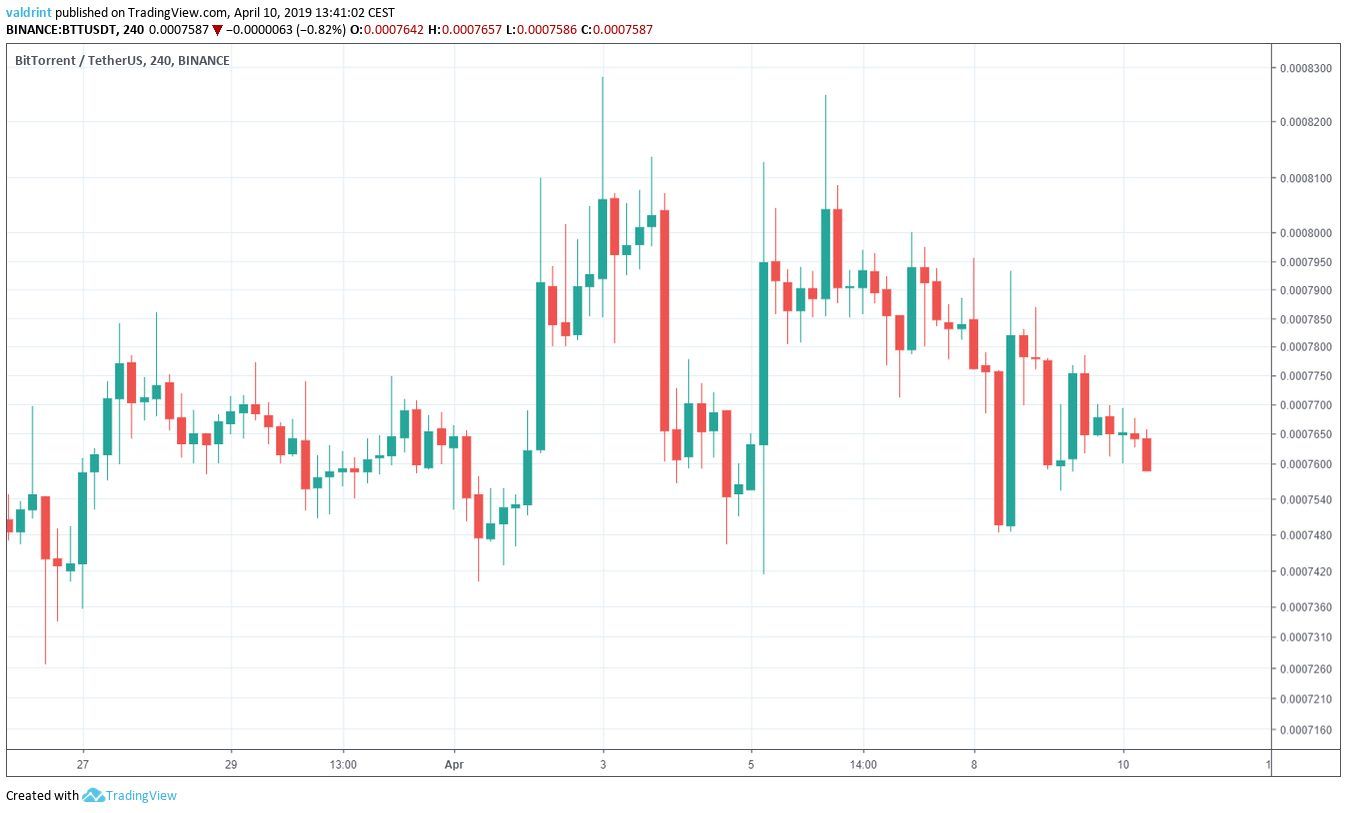
The price of BitTorrent (BTT) on Binance is analyzed at four-hour intervals from Mar 25 to Apr 10 to define its current trading pattern.
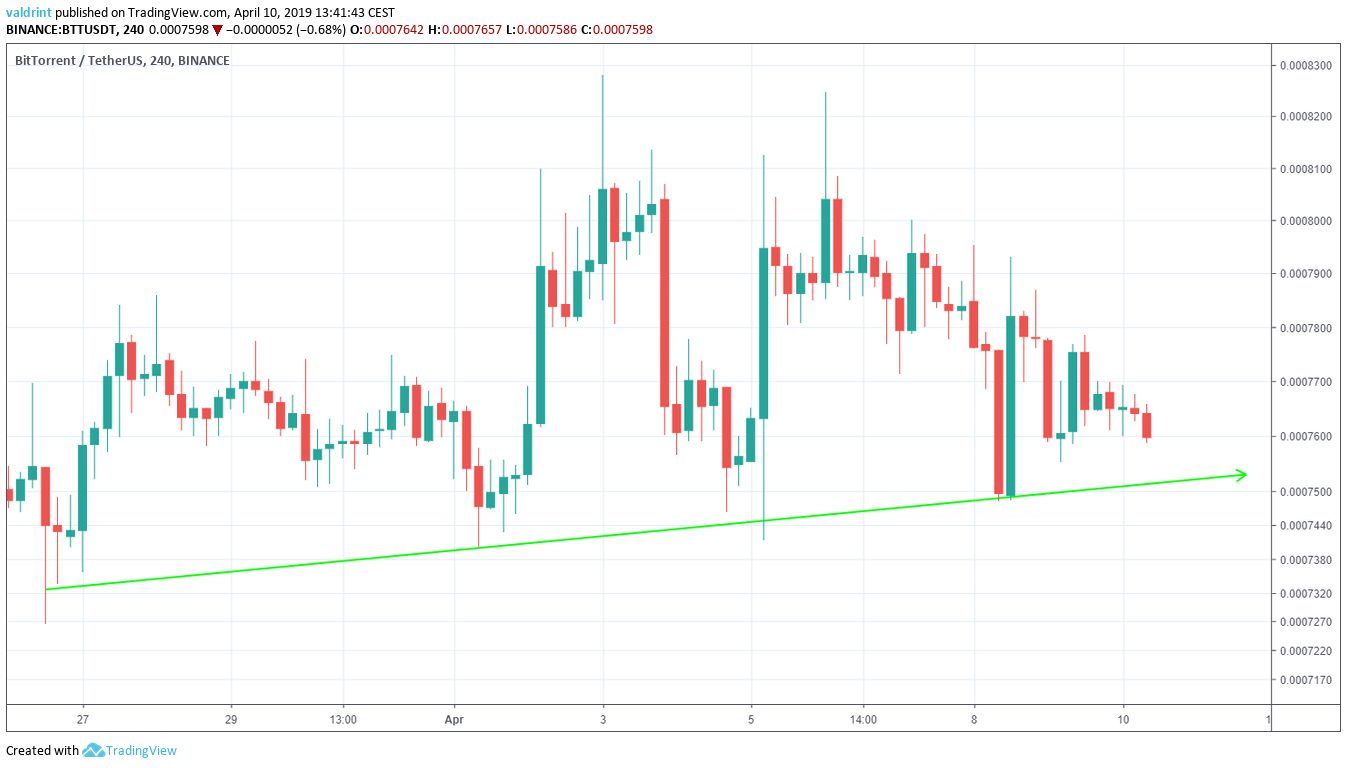
On Mar 26, the price made a low of $0.00072. Several market cycles have been completed and the price has made higher lows each time.
Tracing these lows gives us an ascending support line:
The price of BitTorrent reached a high of $0.00082 on Apr 3. A sharp decrease was followed by a gradual increase. The price has made several lower highs.
Tracing these highs gives us a descending resistance line.
These resistance and support lines combine to create a symmetrical triangle:
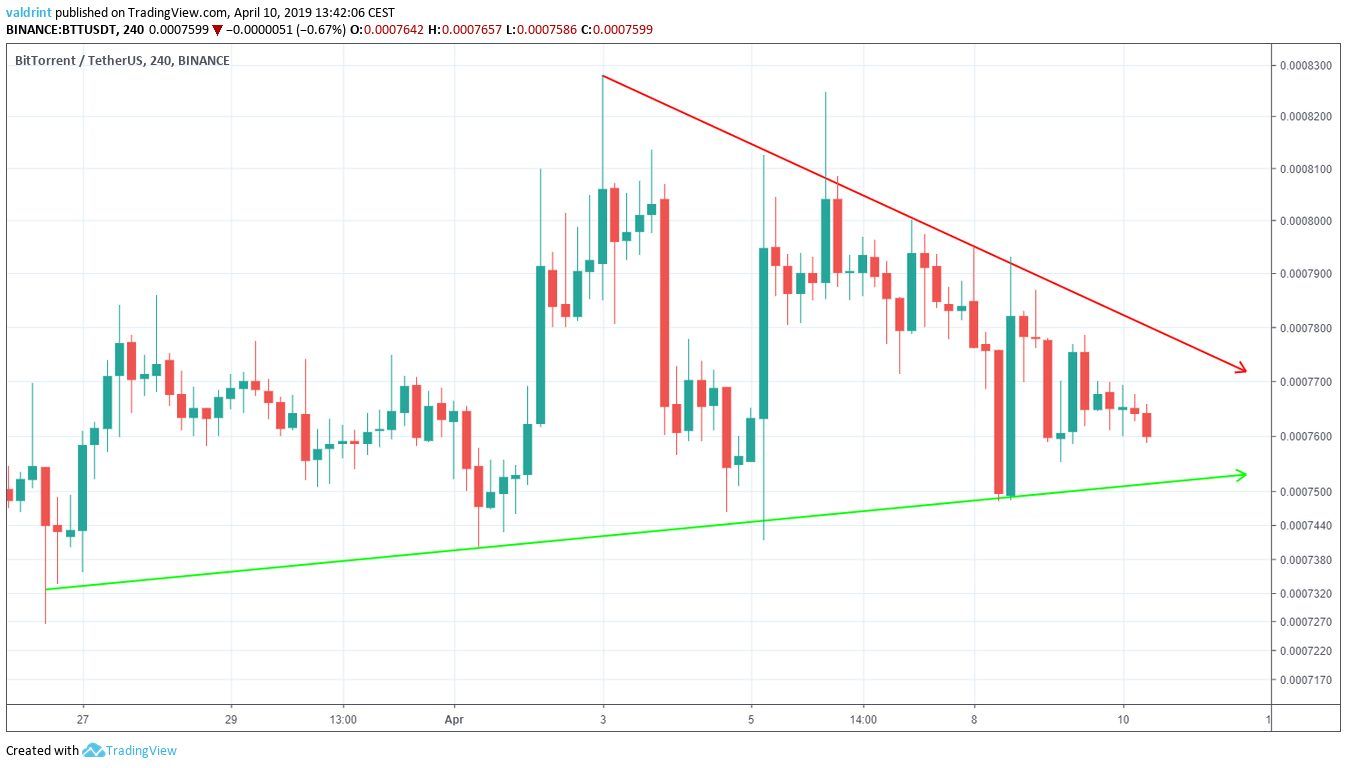
The price is likely to move inside the confines of this triangle until a decisive move occurs.
In order to figure out the direction of this move, we need to take a look at some technical indicators.
Moving Averages

We can see that the price is trading below both of them MAs. Furthermore, on Apr 9, the 20-period crossed below the 50-period MA.
This is known as a bearish cross and often indicates that a new downtrend may have begun.
This confirms that BTT is currently in a downtrend and that price losses are likely forthcoming in the short-term. However, this loss may be postponed because of Apr 11’s airdrop.
Postponed Losses?
During the airdrop on Mar 11, the price of BTT skyrocketed and then plummeted near prior trading levels. Thus, we may see a rapid spike followed by a plummet to current levels.
Then, longer-term losses are likely to be expected along this downtrend.
Another analysis of BTT will be performed on Apr 12 to assess whether the airdrops are beginning to correlate with a regular pump and dump. If such a correlation exists, we’ll continue analyzing monthly airdrops to see if a regular pattern emerges.
Future Movement
We do not believe the airdrop will cause significant deviations from the current trading pattern. Thus, resistance and support areas are incorporated into this analysis based on the symmetrical triangle defined above.
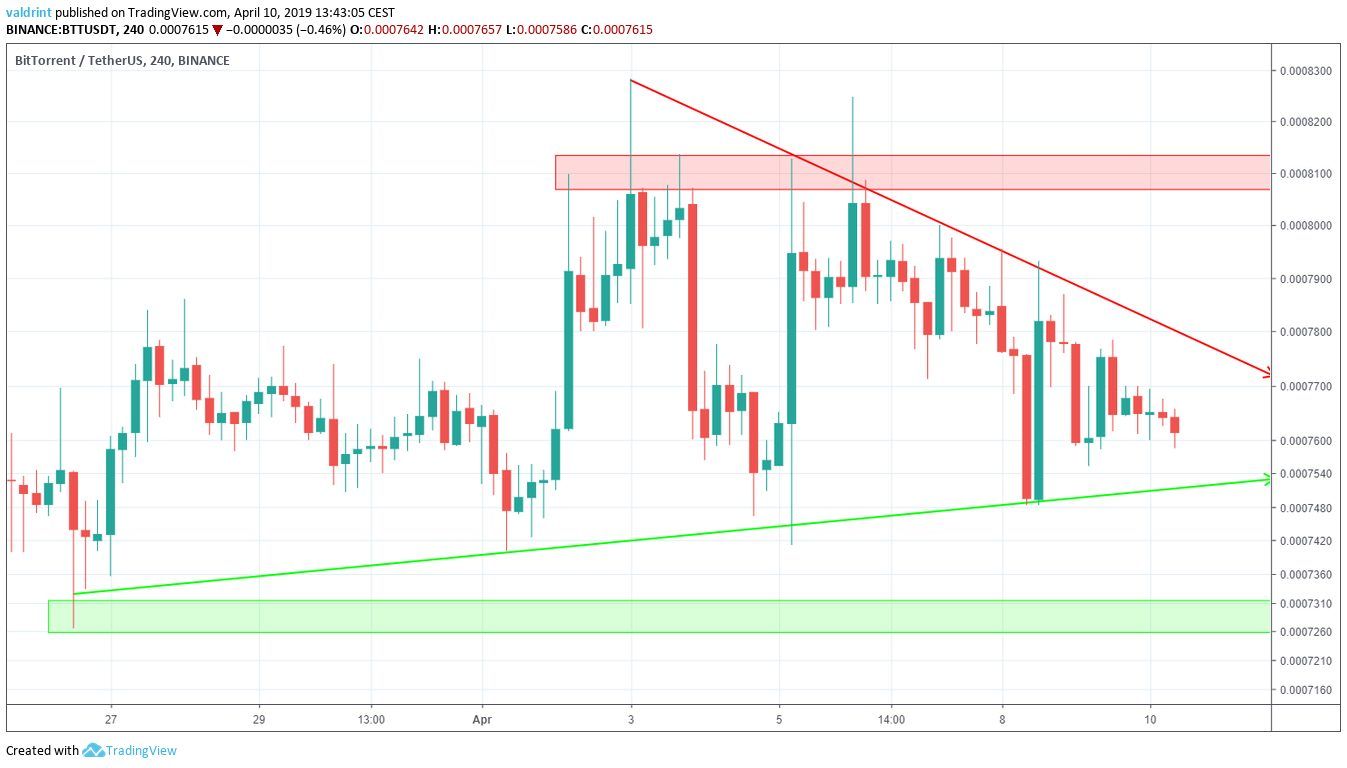
The closest support area is found near $0.000725. If the price breaks down from the triangle, it is likely to provide an area of reversal.
The closest resistance area is found near $0.00081. If the price breaks out of the triangle, it is likely to reach this area.
If the correlation we suggested in the previous section proves valid, the price of BitTorrent Token may spike to or above the resistance level. However, prices would then drop to their current levels within a very short period.
Thus, while the resistance may be met, it is unlikely to be sustained.
Prices are likely to fall toward the support whether or not this spike occurs.
Summary of Analysis
Based on this analysis, it is likely that the price keeps trading inside the confines of the triangle and possibly breaks down following a massive price spike. This could cause a false breakout. Any rapid gains around the time of the airdrop are not expected to be maintained.
Do you think the price of BTT will keep trading inside the triangle? Let us know your thoughts in the comments below.
Tron (TRX) Technical Analysis
On Apr 1, the price began a rapid upward movement. It eventually reached a high of $0.32 on Apr 8. It has been decreasing since.
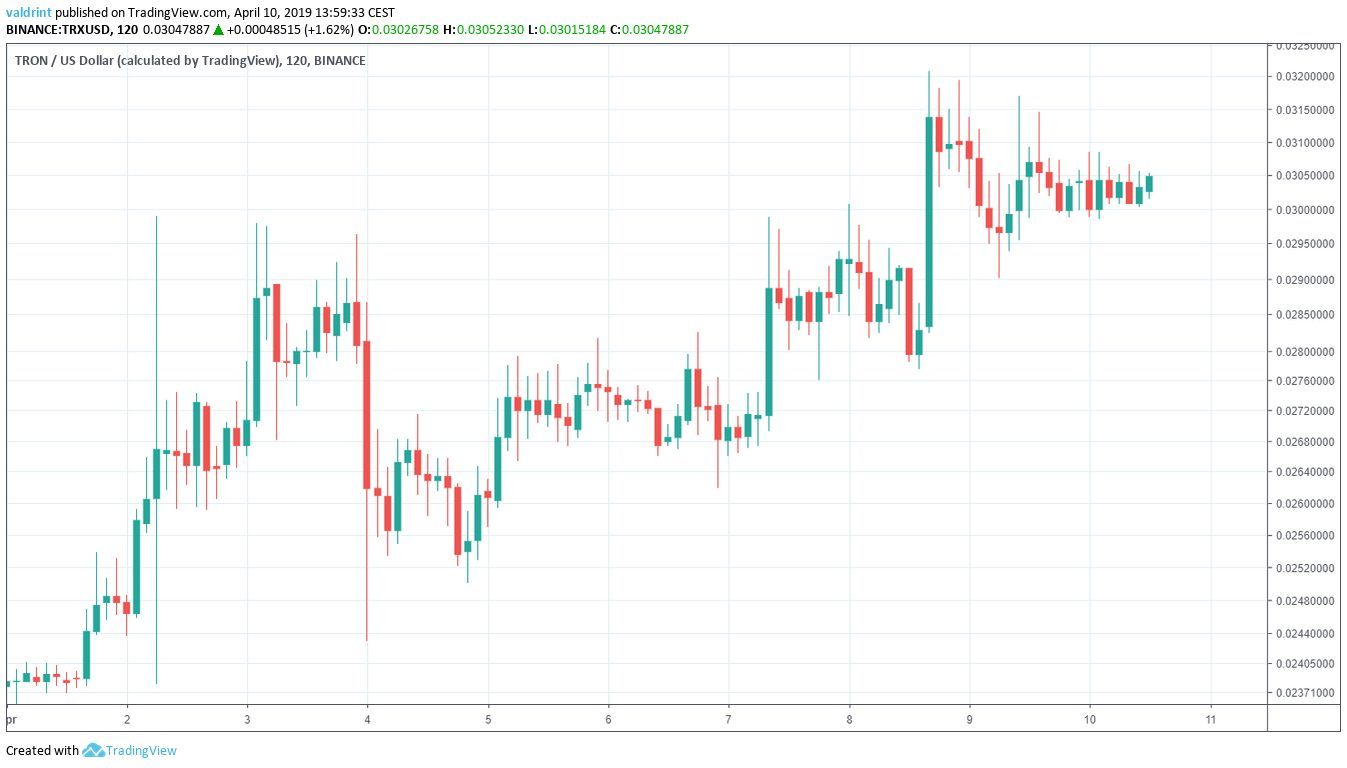
Will the price trade above the highs reached on Apr 8? Let’s find out
Tronix (TRX): Trends And Highlights For April 10, 2019
- The price of Tronix—often referred to as simply Tron or TRX—is trading inside an ascending channel.
- TRX is following a longer-term ascending support line.
- Bearish divergence is developing in the RSI.
- There are resistance areas near $0.031 and $0.035 while the closest support area is found near $0.027.
Horizontal Channel
We begin our analysis by defining Tron’s current trading pattern. We do this by analyzing the price of TRX on Binance at two-hour intervals from Apr 2 to Apr 10.
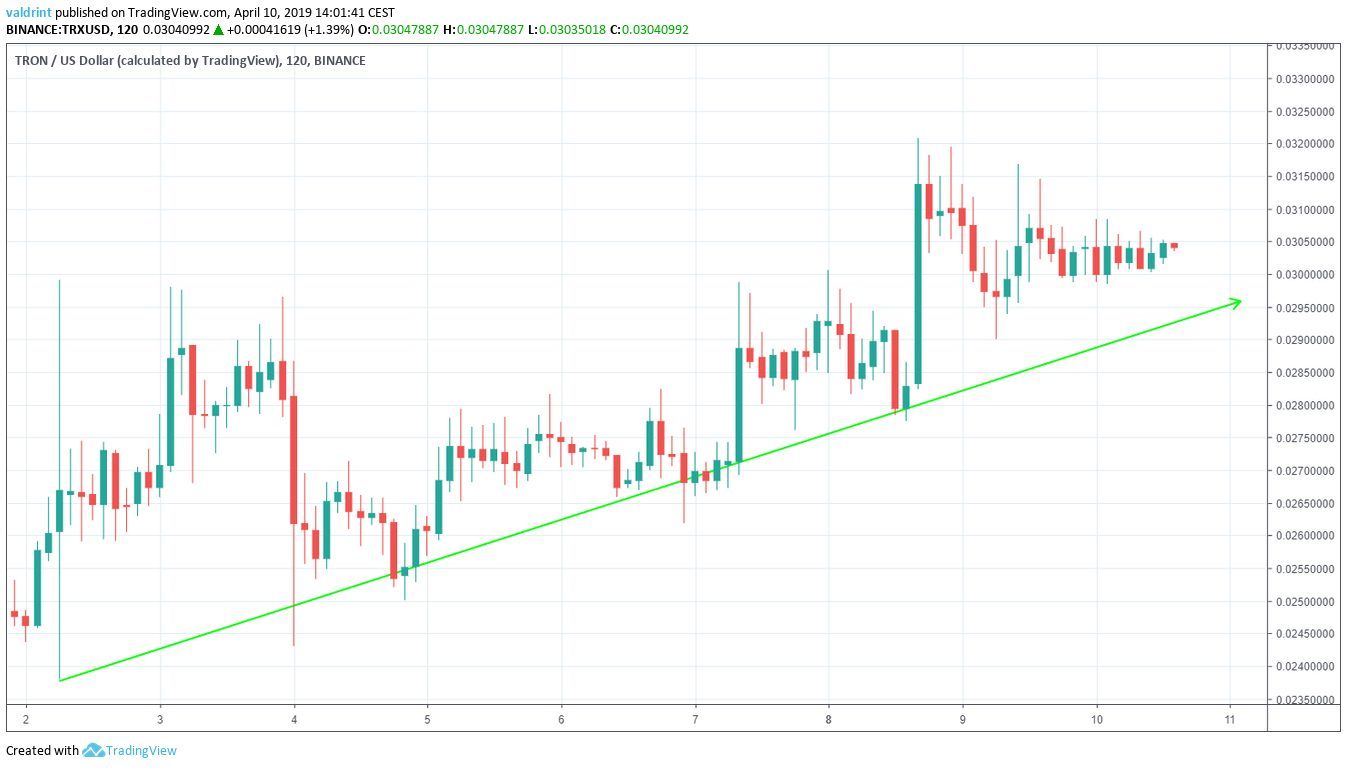
Tron reached a low of $0.023 on Apr 2. A gradual increase in price ensued. Several market cycles were completed with each low being higher than the previous one.
Tracing these lows gives us an ascending support line:
The price of Tron reached a high of $0.028 on Apr 2. It has been increasing, creating several higher highs.
Tracing these highs gives us an ascending resistance line.
Furthermore, the resistance and support lines combine to create an ascending channel:
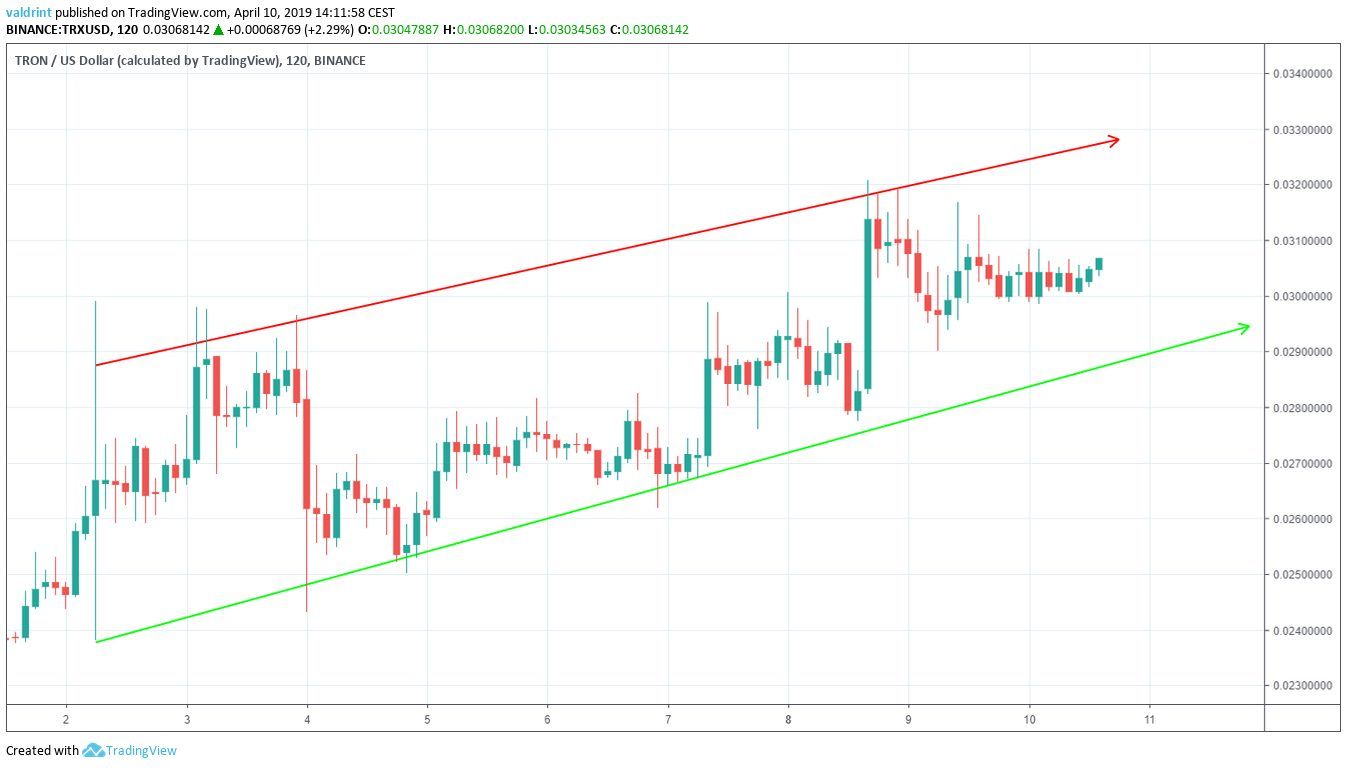
This channel is a generally neutral trading pattern. Price is expected to rise and fall between support and resistance.
Bearish Divergence
To better determine the future movement of Tron, we analyze its price at 12-hour intervals from Nov 2018 to Apr 2019 alongside the relative strength index (RSI).
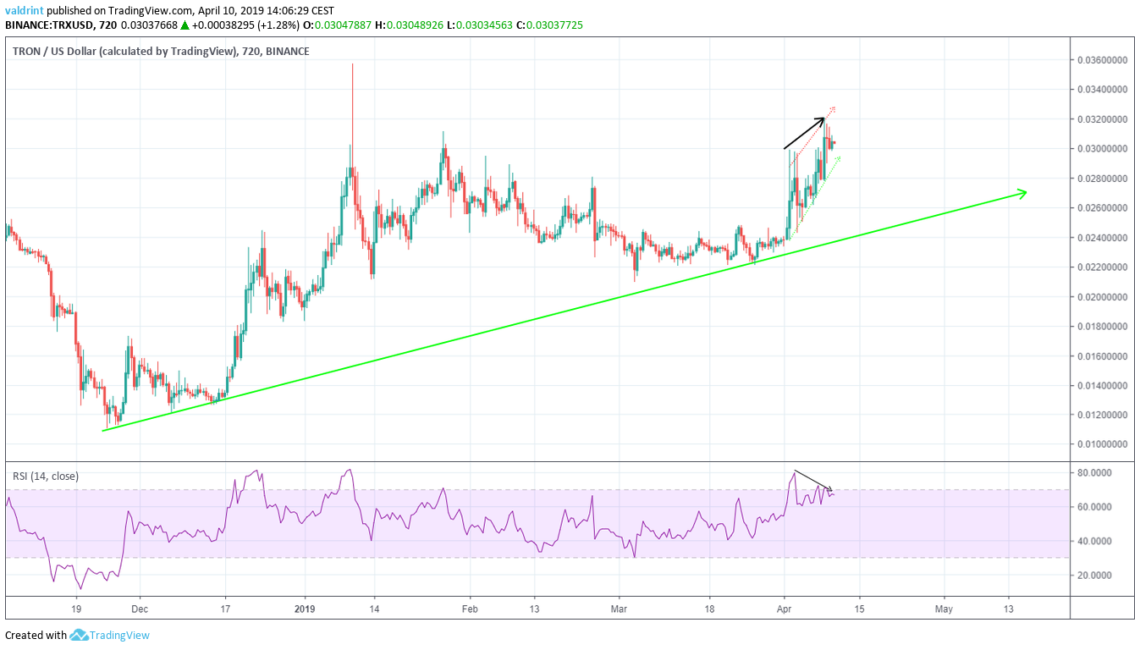
The price has been on an uptrend since Nov 21, 2018.
The channel we have outlined in the section above is drawn in dotted lines.
The price made a high of $0.028 on Apr 2. It reached a higher high of $0.032 on Apr 8.
Similarly, the RSI made the first high on Apr 2. However, it has generated lower values since.
This is known as bearish divergence and often precedes price decreases.
This suggests that TRX may drop toward the support line of the channel. However, it is also possible that the BitTorrent airdrop may lead to noticeable short-term rises before continued losses.
Reversal Areas
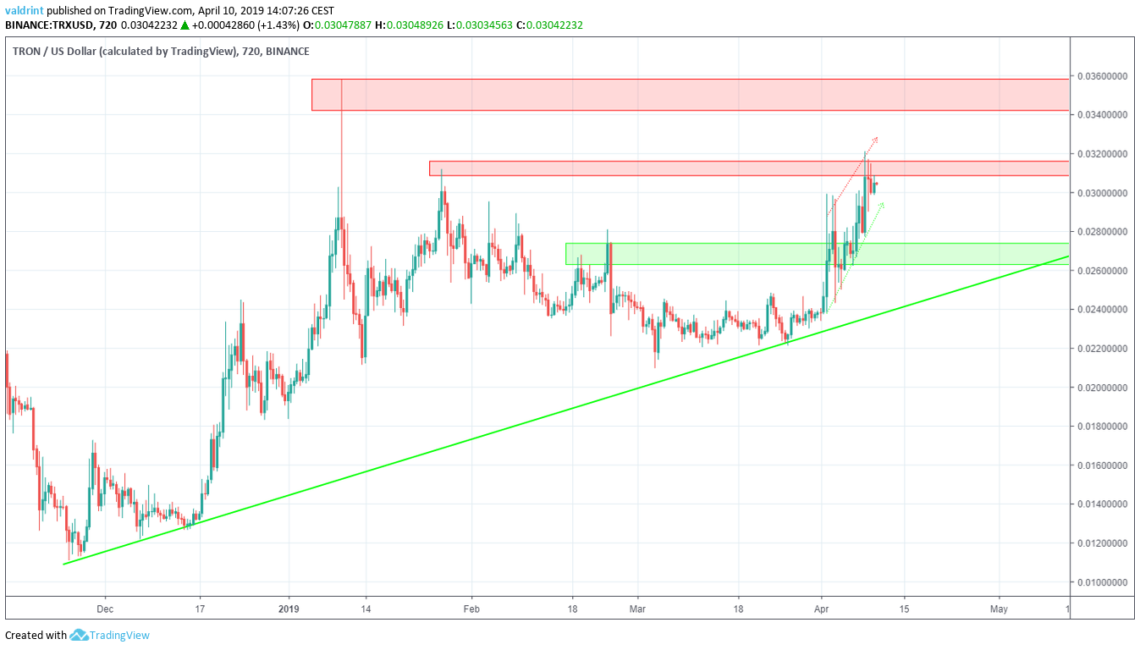
The closest resistance area is found near $0.031. It is very close to where the price is currently trading. If the price breaks out of this area, the second resistance area can be found near $0.035. We do not believe the price will reach this area.
The closest support area is found near $0.027, coinciding with the long-term support line. We believe the price will eventually reach this area.
Summary of Analysis
Based on this analysis, it is likely that the price will break down from the channel and drop to the long-term support line.
Do you think TRON will break down from this channel? Let us know your thoughts in the comments below!
Disclaimer: This article is not trading advice and should not be construed as such. Always consult a trained financial professional before investing in cryptocurrencies, as the market is particularly volatile.


