
The Bitcoin (BTC) price is likely nearing the top of a five-wave upward move that began on March 13. While the price is likely in the final wave, the price action has not shown any weakness.
In this article, waves will be labeled as follows:
- Cycle Wave – White
- Wave – Orange
- Sub-wave – Blue
- Minor sub-wave – black
Bitcoin’s Long-Term Count
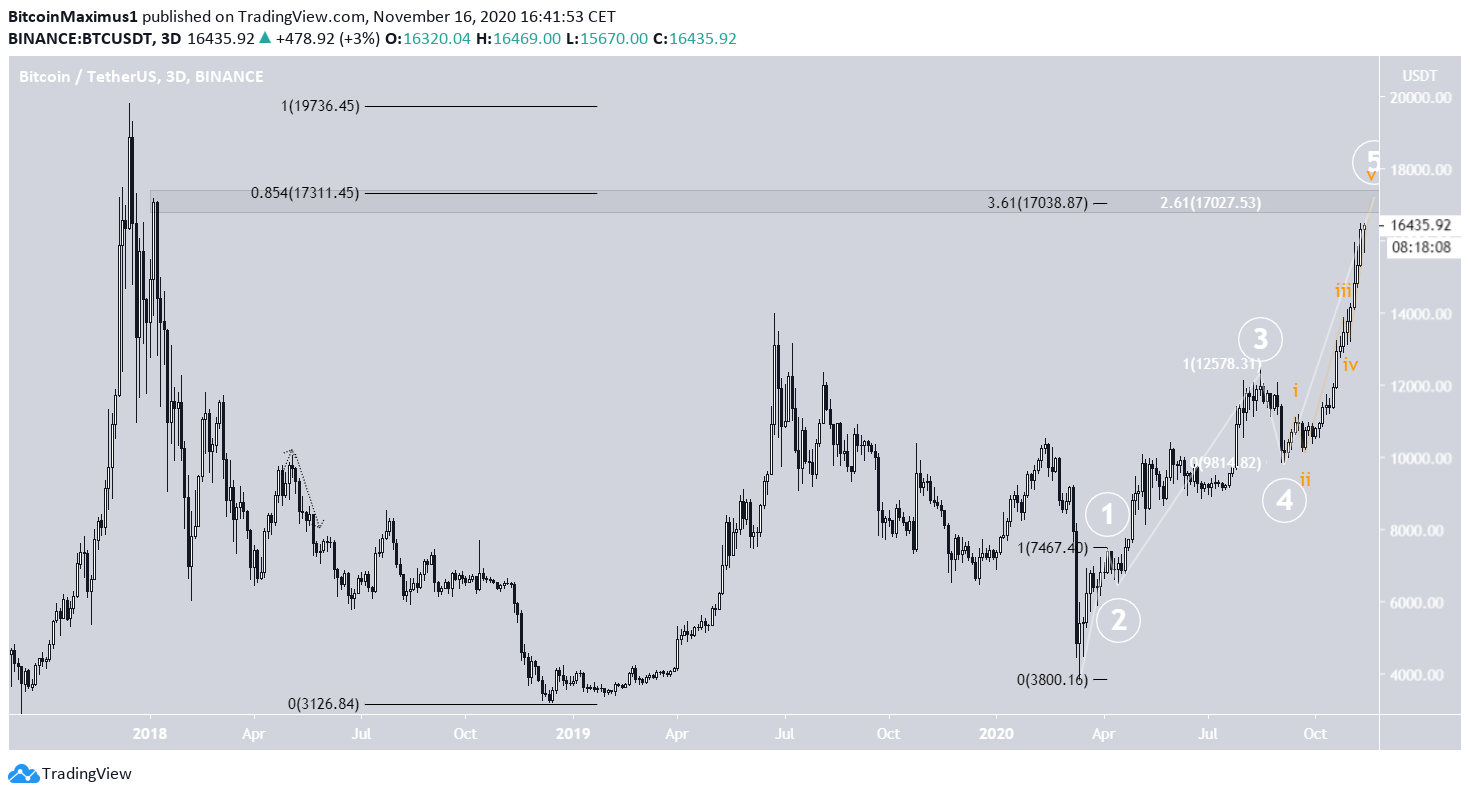
The long-term count for Bitcoin (shown in white below) indicates that the price is in the fifth and final cycle wave of a bullish impulse that began with the March 13 low. Furthermore, the price seems to be in the fifth and final wave (orange) of the previous fifth cycle wave.
The most likely target for the top of the move is between $17,040 and $17,311. The Fib retracement tool outlines three potential targets:
- The 0.854 Fib retracement level of the entire decline from Dec 2017 (also a horizontal resistance level).
- The 3.61 Fib extension of wave 1 (shown in black below).
- The 2.61 external retracement of wave 4 (shown in white below).
Therefore, the area is very likely to act as the top once the price reaches it.
Main Short-Term Count
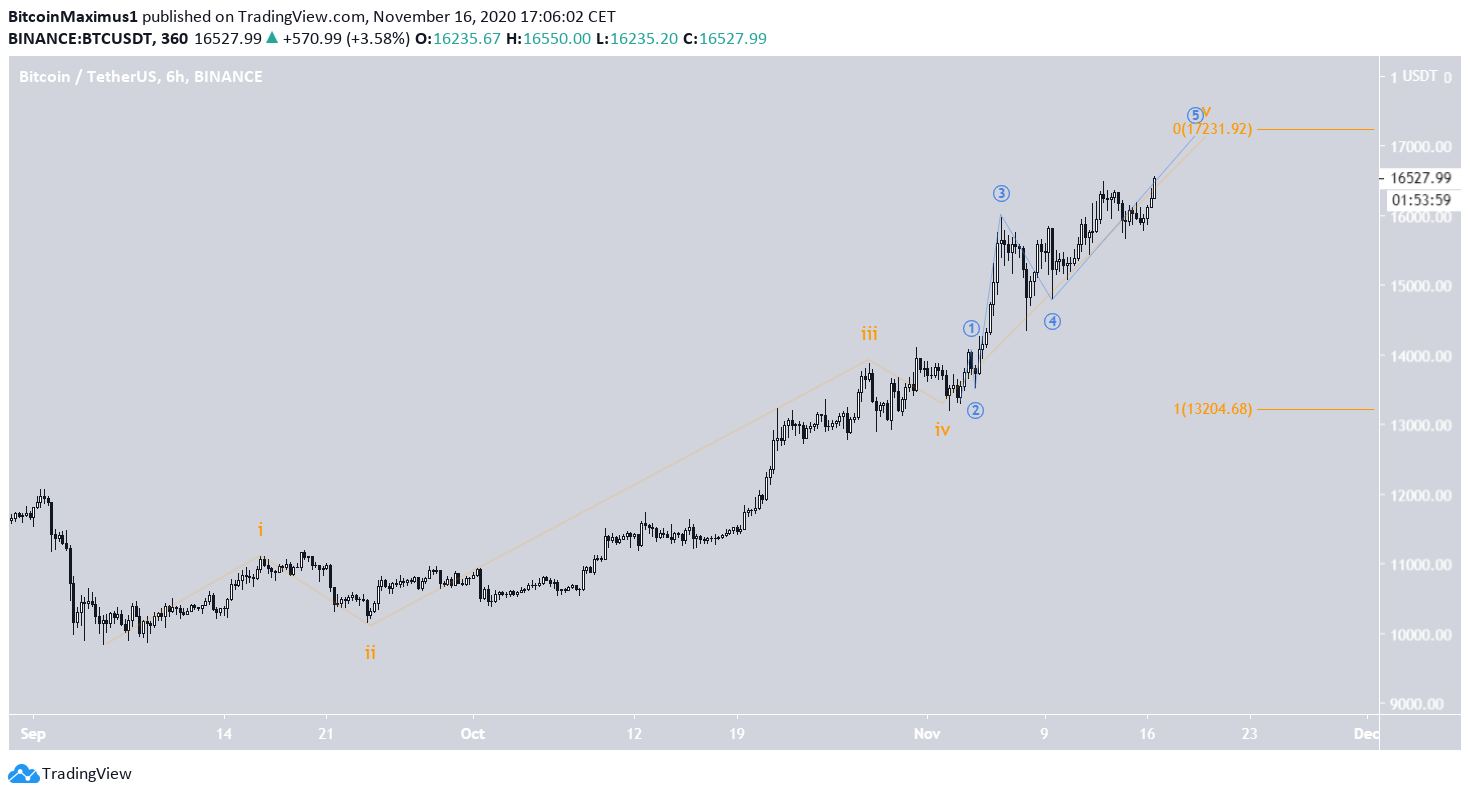
The main bullish count suggests that the price is in an extended fifth wave (orange), currently trading in the fifth and final sub-wave (blue).
Another fib projection (projecting the length of sub-waves 1-3 to 4) gives a target near $17,231, fitting with the previously given targets and supporting their legitimacy.
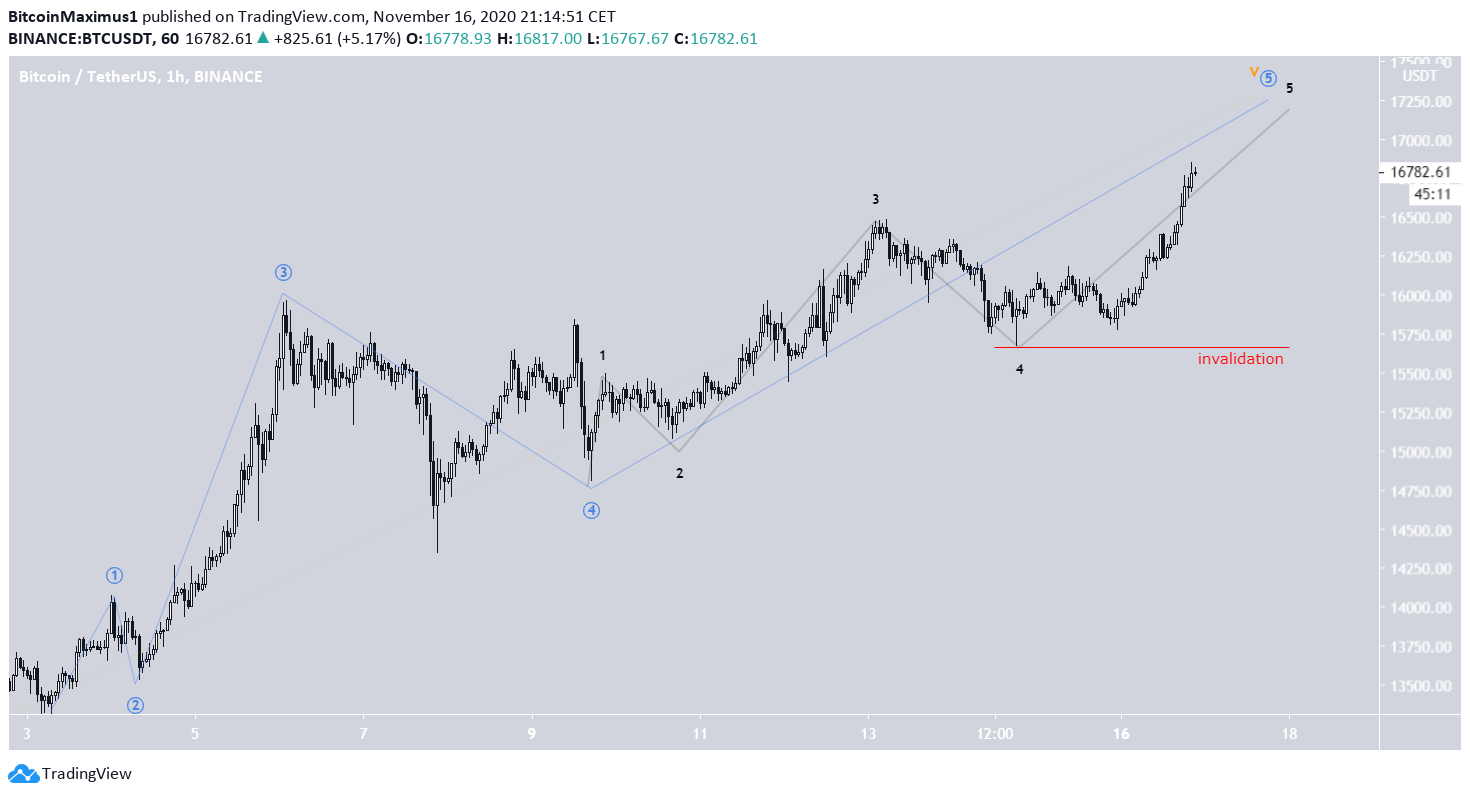
Cryptocurrency trader @TheTradinghubb outlined several Bitcoin counts, suggesting that once BTC makes its next move, the majority will be invalidated, leaving only the right one.
The most likely count suggests that the final sub-wave (blue) is currently taking place, and the price is in the fifth and final minor sub-wave (black).
The wave count would be invalidated by a decline below $15,670 (red line).
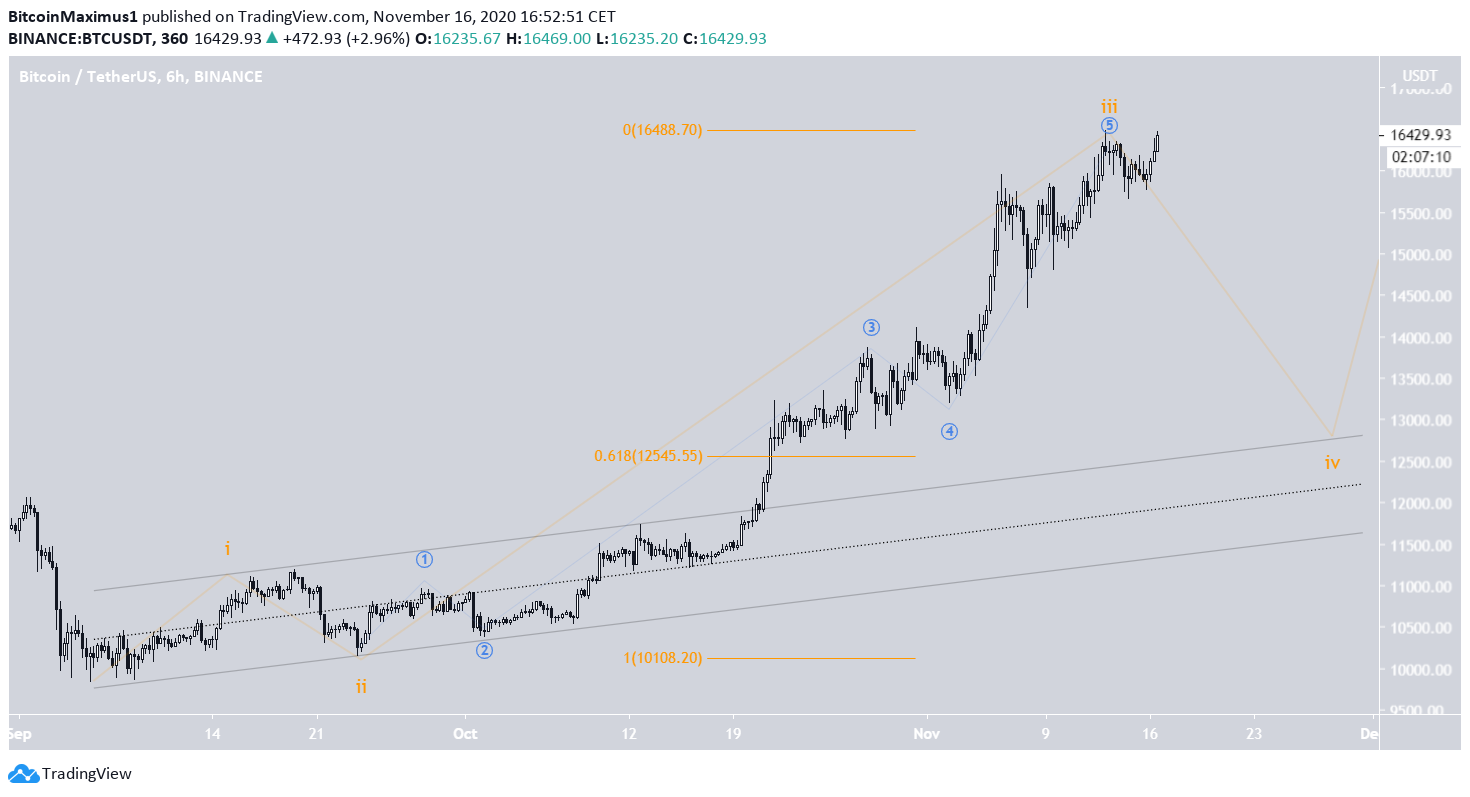
Alternative Short-Term Count
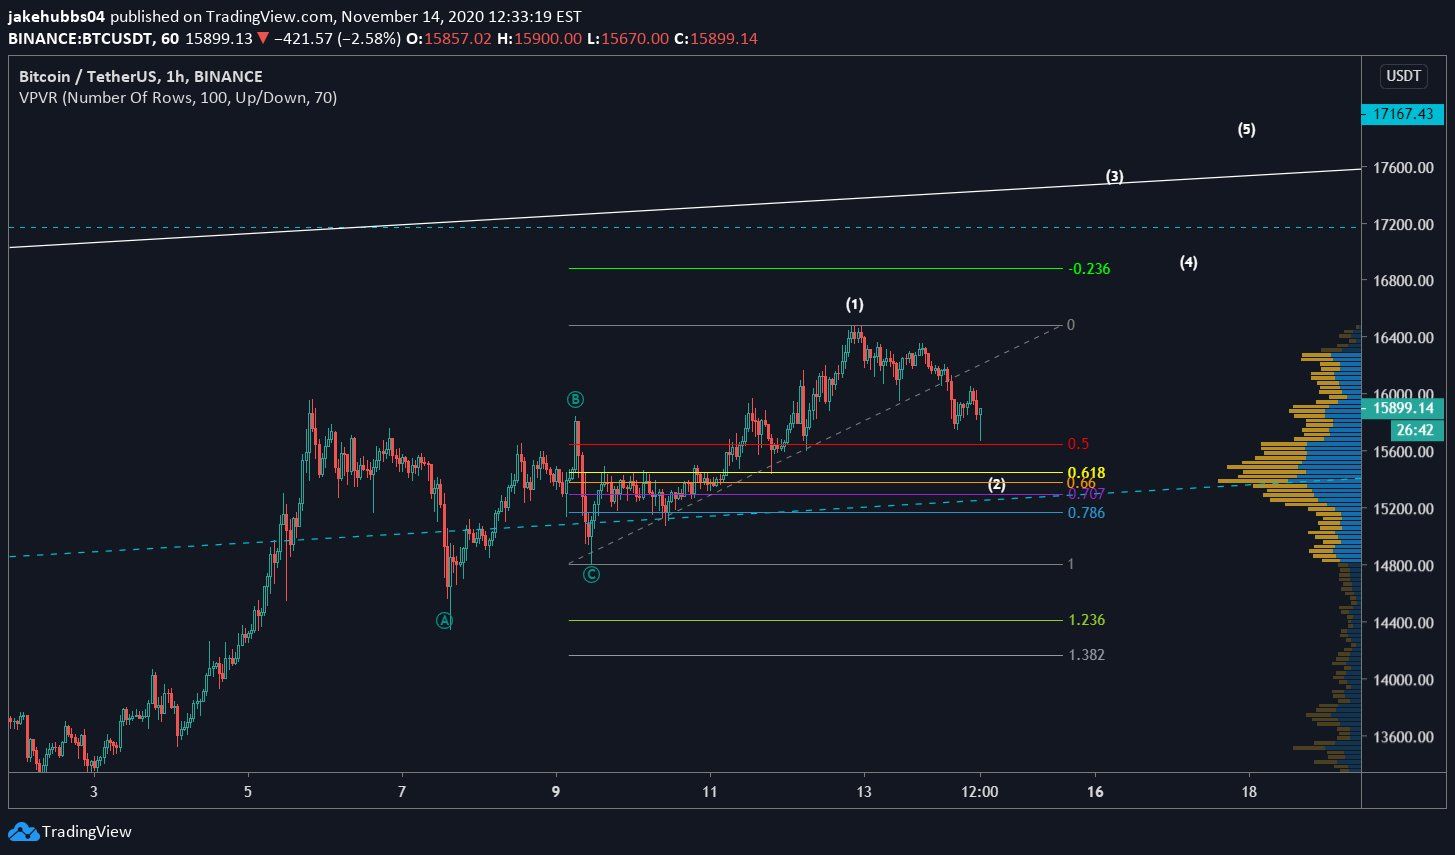
The alternative count suggests that the price has just completed sub-wave 3, which was extended, and will now fall, possibly all the way to $12,545.
While this is technically valid, it doesn’t fit with the current movement nor technical indicators. Therefore it’s unlikely to be the correct one.
Conclusion
To conclude, the BTC price should rally towards $17,200 to complete its bullish impulse.
For BeInCrypto’s previous Bitcoin analysis, click here!
Disclaimer: Cryptocurrency trading carries a high level of risk and may not be suitable for all investors. The views expressed in this article do not reflect those of BeInCrypto
