
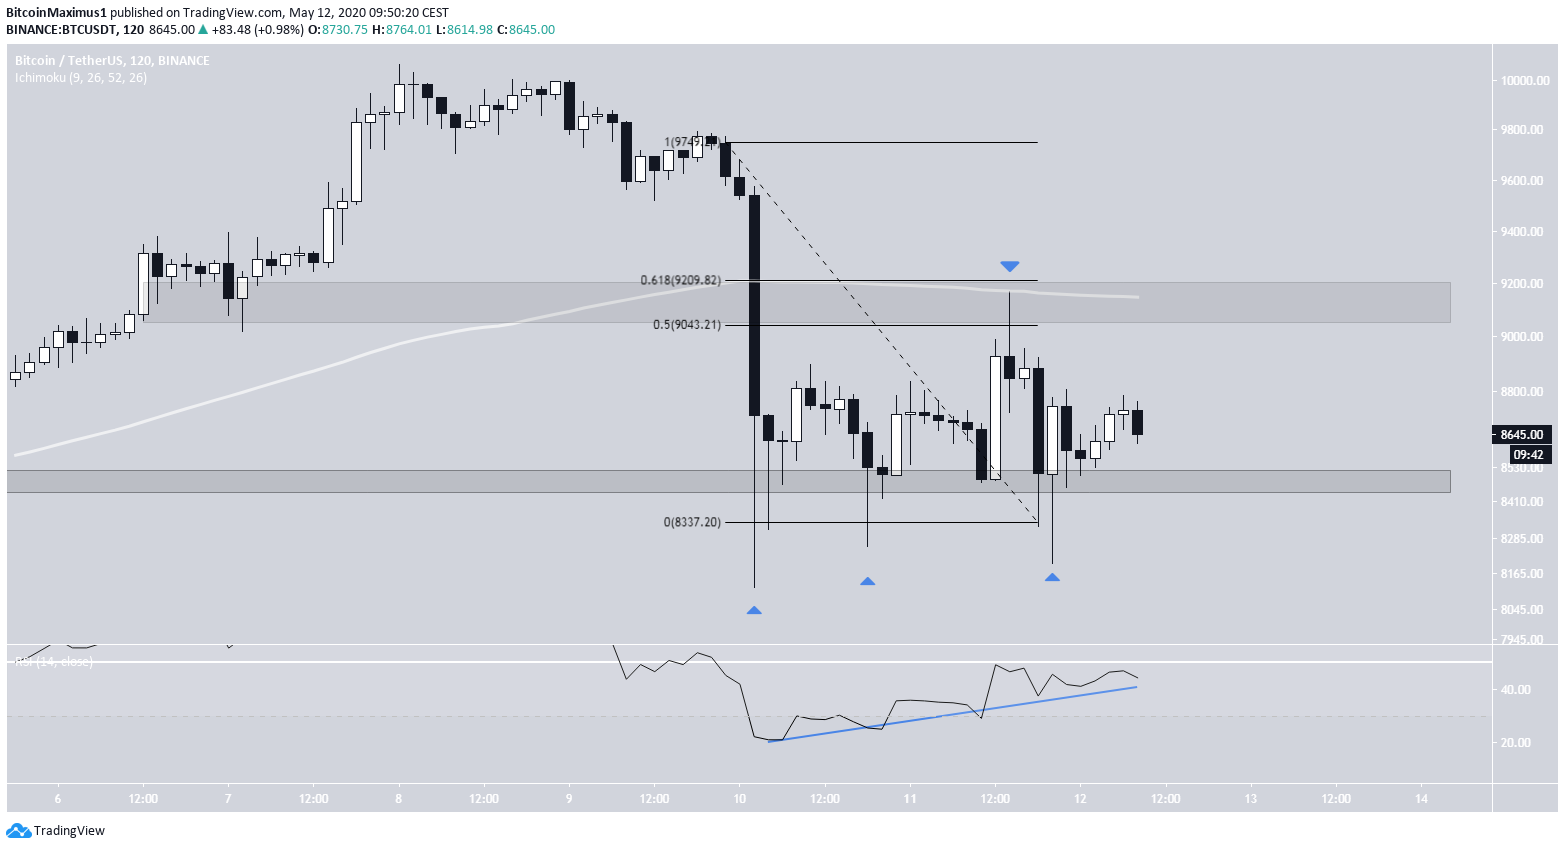
On May 12, the Bitcoin price mostly consolidated between $8200-$9200. The price made an attempt at moving above $9200 but was swiftly rejected and dropped sharply — reaching a low of $8200 before bouncing upward.
The rejection occurred right between the 0.5-0.618 fib levels and was strengthened by the presence of the 200-day moving average (MA). This left a long upper wick in place — a sign of selling pressure.
However, the Bitcoin price is trading very close to the minor $8450 support area. While the price risked falling below it several times, it has bounced upward each time. This has effectively created a triple bottom pattern inside this area, which is also combined with a bullish divergence in the RSI. This suggests that the price is likely to move upwards towards $9200 once more.
Ascending Support Line
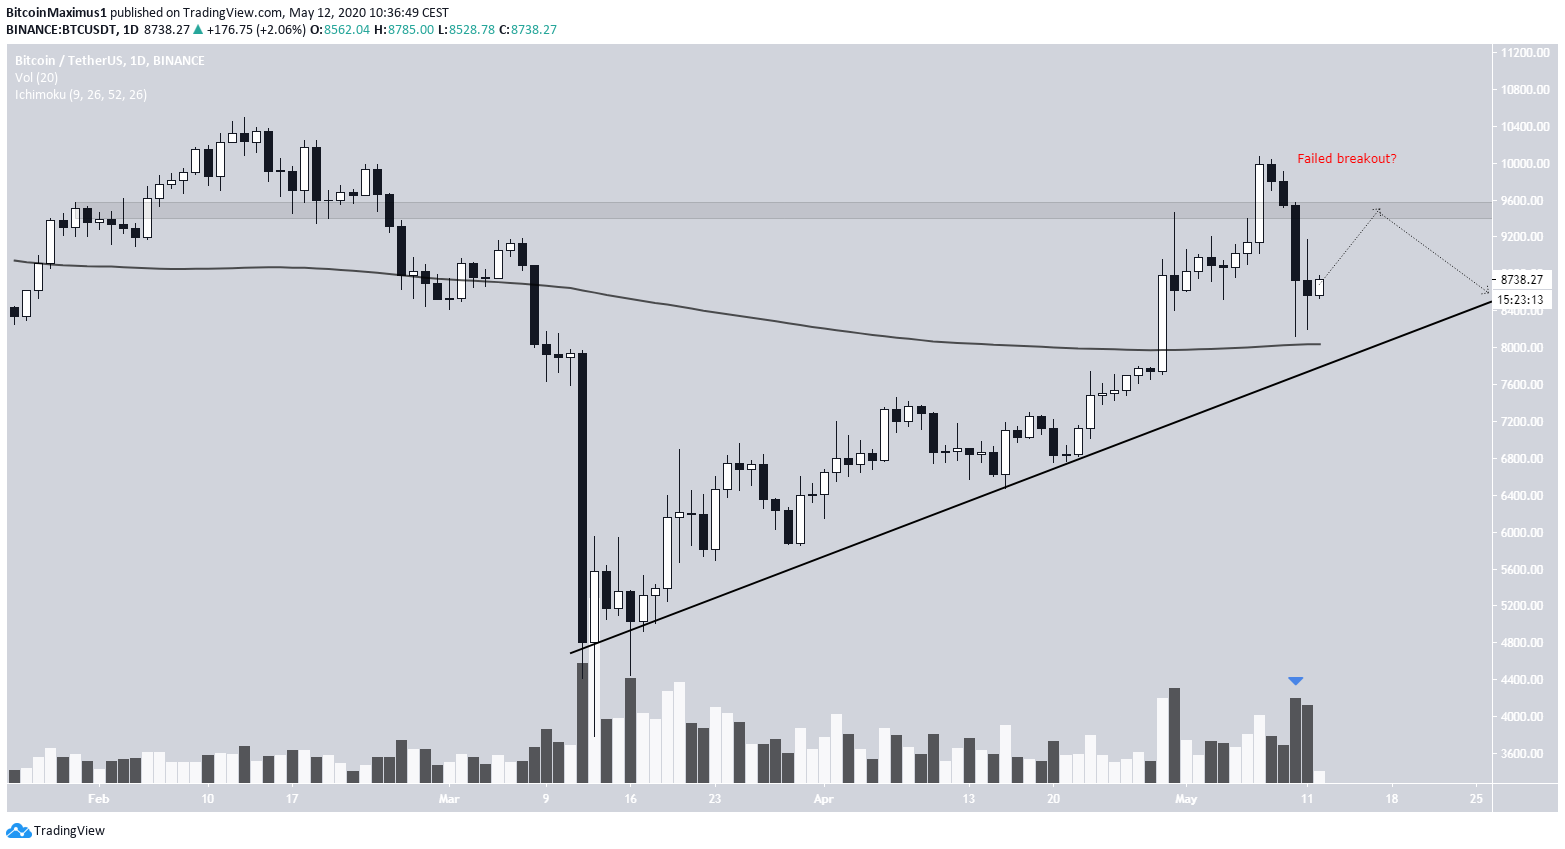
In the longer-term, we can see that the Bitcoin price is following an ascending support line and has been doing so since the March 13 bottom. However, the slope of the line is not entirely clear, since it differs slightly due to the presence of several wicks. Therefore, we have used the closing prices instead.
This ascending support line is currently near $8000 and is also strengthened by the 200-day MA. Therefore, this would be a very likely place for the initiation of a reversal.
The $9500 area is extremely important in the daily time-frame and can tell us a lot about the future price. While the price moved above it on May 7, possibly signaling a new bullish trend, it decreased with a very high volume a few days later. Therefore, this looks like a failed breakout attempt that possibly signals the top.
So, unless the price successfully flips this area as support, further downside is expected — with the price being very likely to reach the ascending support line after possibly another validation of the $9200 resistance.
A successful flip of the $9500 area would indicate that the price is heading towards new highs.
To conclude, the Bitcoin price was rejected by the $9200 area and dropped sharply. Unless the price is able to successfully flip this level to support, it is expected to go down towards the ascending support line outlined above.
For those interested in BeInCrypto’s previous Bitcoin analysis, click here.
