
Bitcoin appears to have started April on a less bearish note as the broader crypto market continues to recover.
On-chain data now indicates that the selloff pressure among BTC holders may be easing, potentially paving the way for a price surge in the coming weeks.
Bitcoin Short-Term Holders Show Confidence
Key on-chain metrics, including the coin’s Short-Term Holder Spent Output Profit Ratio (STH-SOPR), suggest that fewer coins are being sold in the market. This metric stands at 0.9 at press time, falling steadily over the past week.
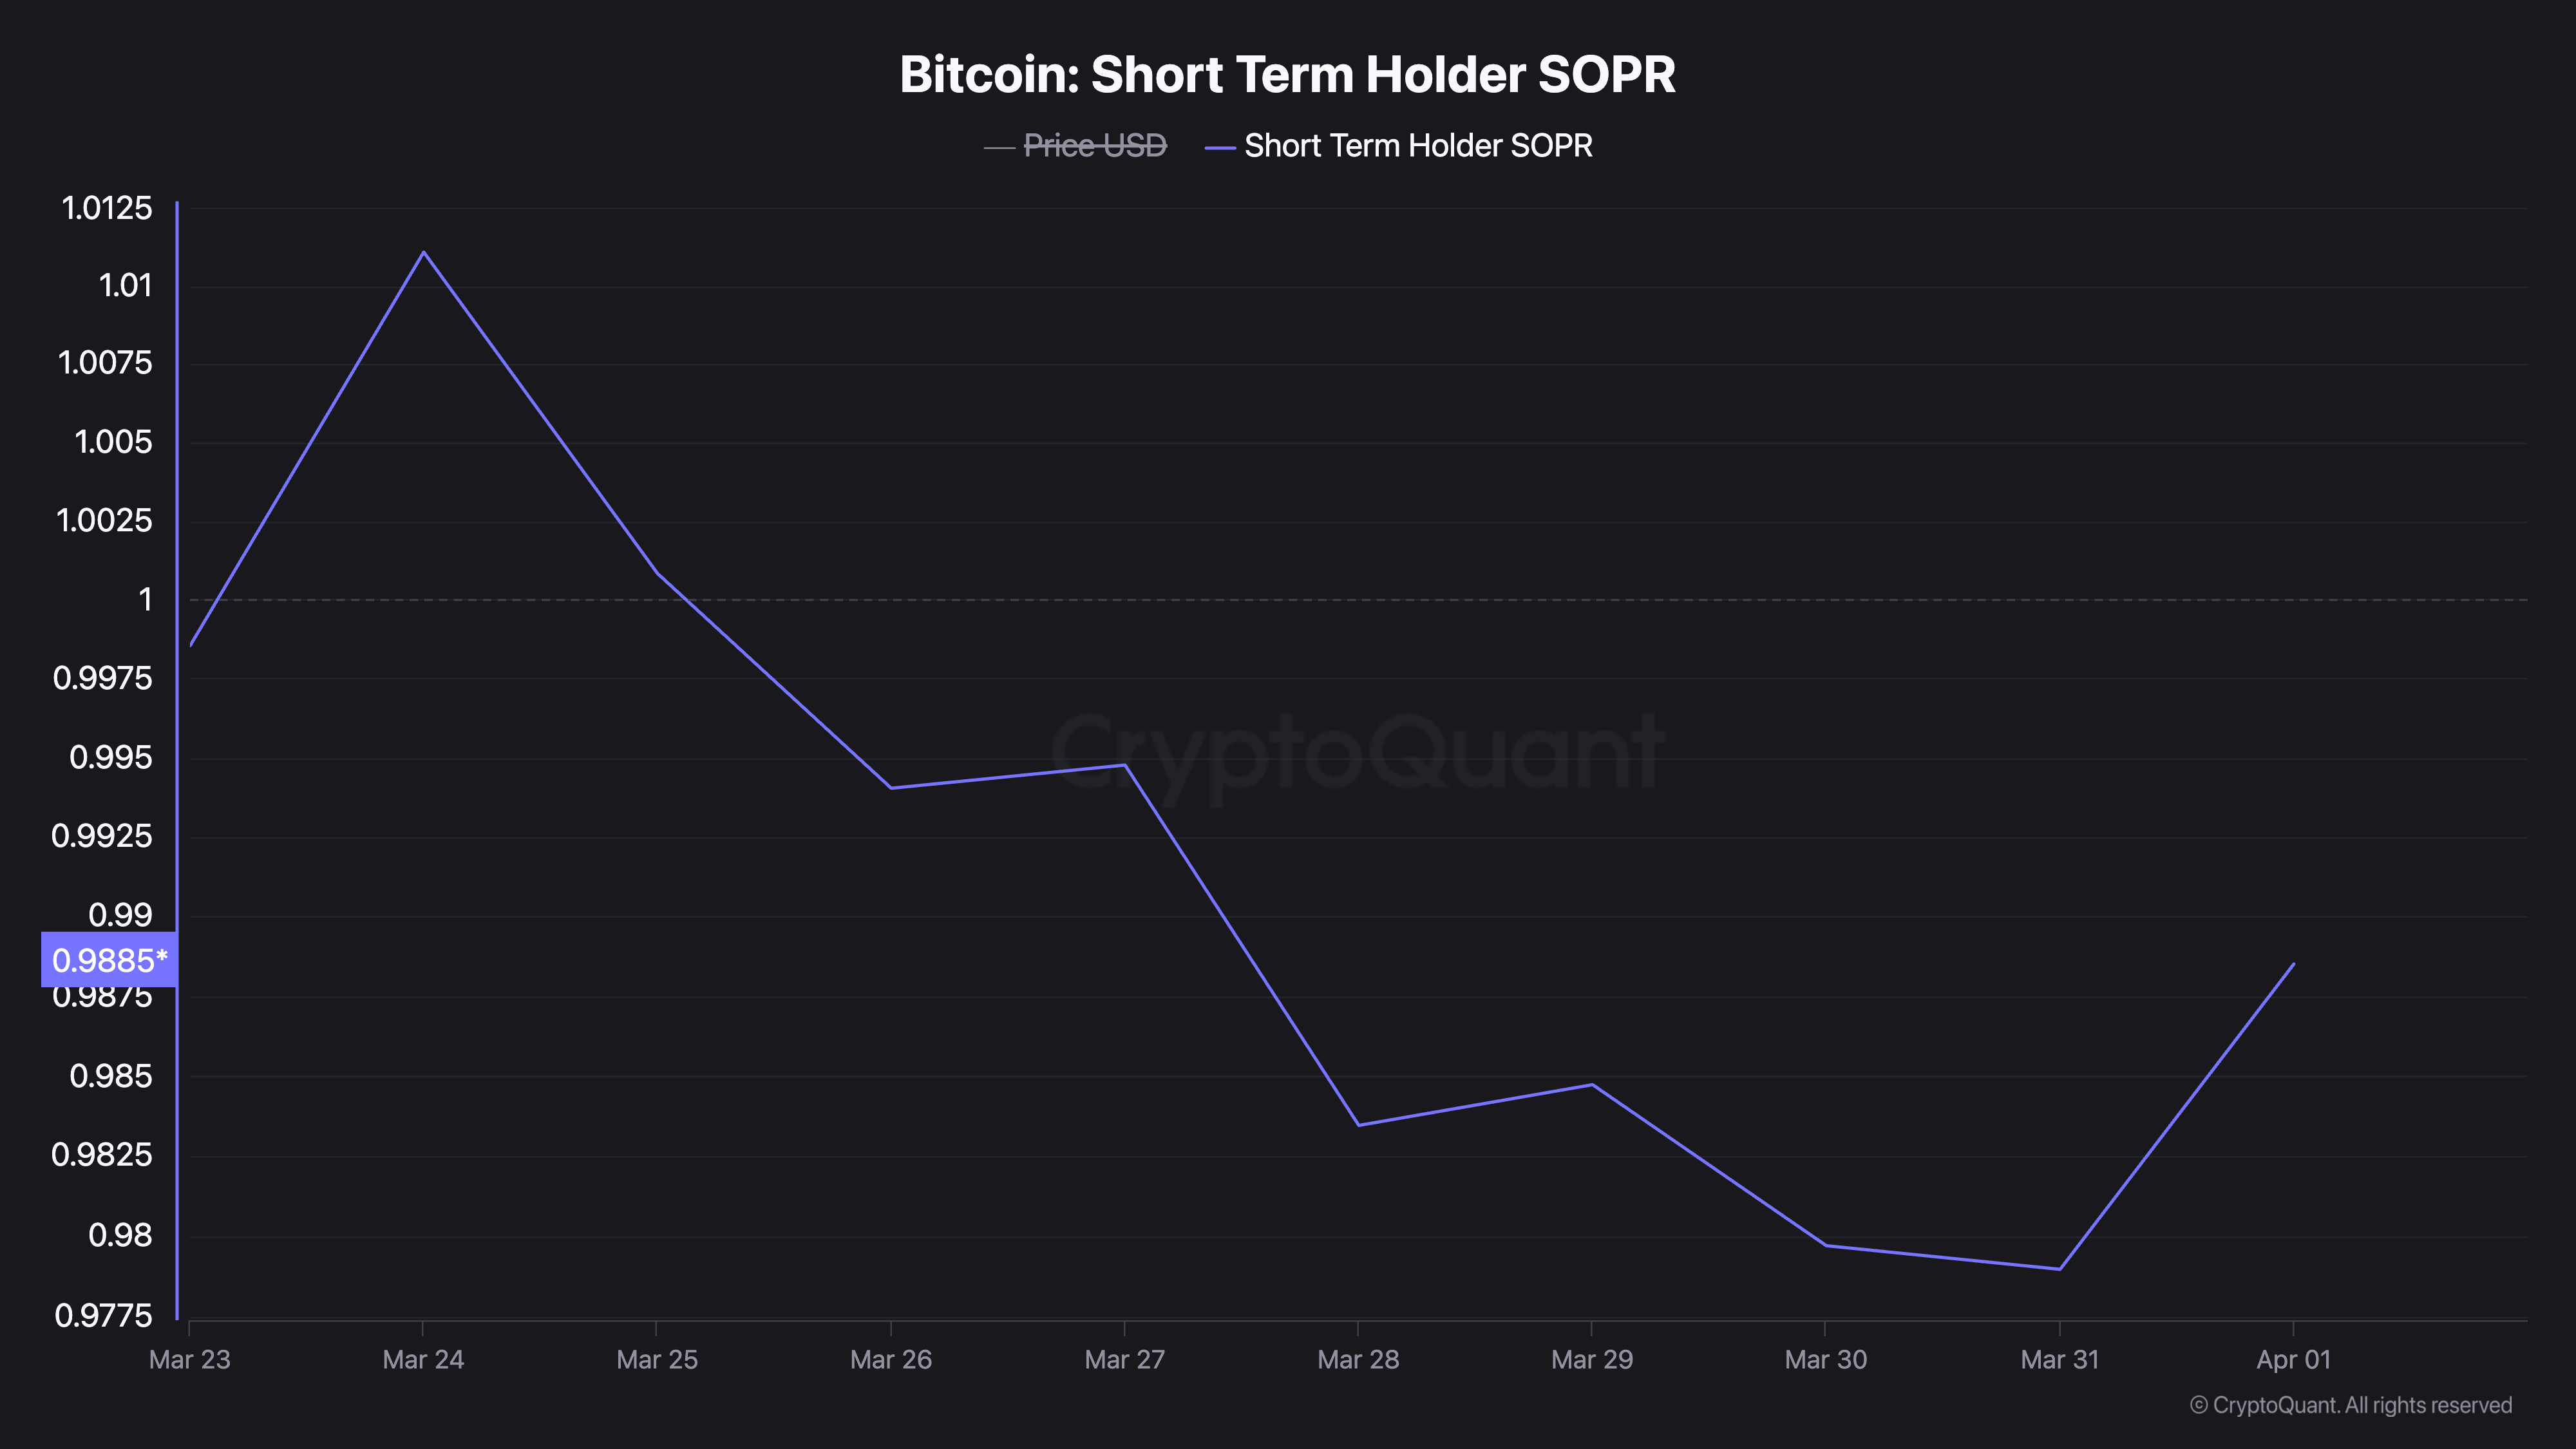
BTC’s STH-SOPR gauges the profitability of its short-term holders (those who have held their coins for three to six months) and provides insights into whether these investors are profitable or unprofitable.
When the STH-SOPR is above 1, it indicates that these holders are, on average, selling their coins at a profit. Conversely, if the STH-SOPR is below 1, it suggests that these holders are at a loss.
With coin holders sitting on unrealized losses, they are unmotivated to sell their holdings. This reduces the Bitcoin selling pressure in the market and can drive up its value as bullish sentiment makes a comeback.
Long-Term Holders Reduce Selloffs
In addition, the decline in BTC’s Value Days Destroyed (VDD) confirms this gradual shift in bullish sentiment toward the king coin. In a recent report, pseudonymous CryptoQuant analyst Banker found that this metric plummeted in March, signaling a decline in selloffs among BTC long-term holders.
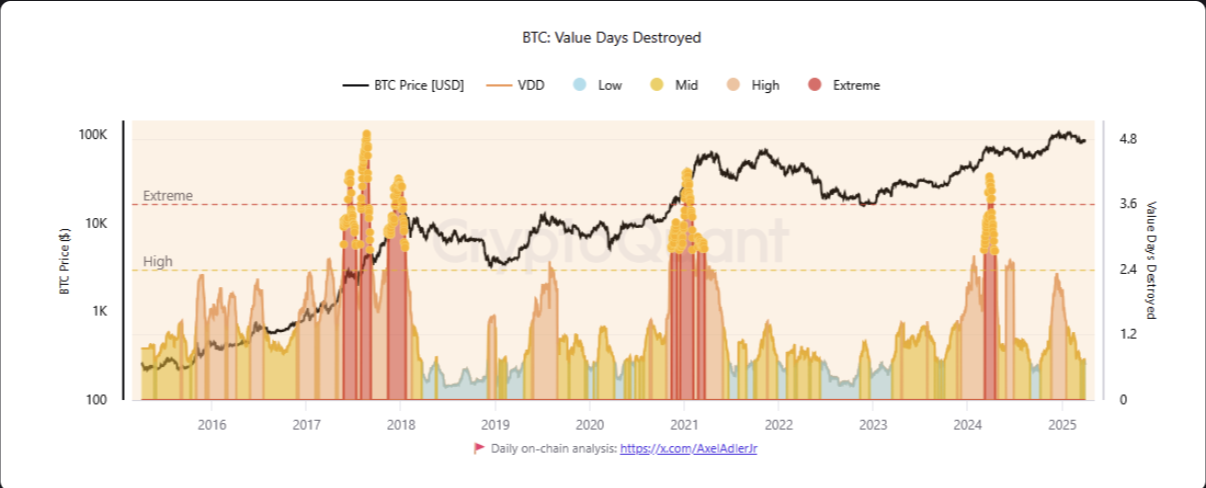
Bitcoin’s VDD tracks the accumulation and distribution pattern among the coin’s long-term holders. When it climbs, it indicates that older coins are being moved, suggesting that long-term holders are selling or taking profits.
On the other hand, a decline in BTC’s VDD suggests that these holders are holding onto their coins, indicating strong conviction and a belief in future price appreciation.
According to Banker, BTC’s VDD spiked to 2.27 on December 12, signaling that “long-term holders were aggressively taking profits – a classic warning sign of potential market overheating.” However, by March, the metric had fallen to 0.65, indicating that the intense profit-taking phase had passed, with these holders now exercising more restraint.
“The subsequent decline to 0.65 by March 2025 tells a revealing story. This steady three-month descent suggests the most intense phase of profit-taking has passed, with long-term holders now showing more restraint. While this reduces immediate selling pressure, it also indicates the market has entered a new phase of its cycle,” Banker noted.
As highlighted by these metrics, the increased holder confidence could push BTC to new highs. This will further solidify its position in the market as investor sentiment gradually turns bullish.
BTC’s RSI Breakout Could Push Prices Past $87,000 to $91,000
On the daily chart, BTC attempts to breach the neutral line of its Relative Strength Index, reflecting the surging buying activity. At press time, this key momentum indicator is at 47.10.
The RSI measures an asset’s overbought and oversold market conditions. It ranges between 0 and 100, with values above 70 indicating that the asset is overbought and due for a decline. On the other hand, values under 30 suggest that the asset is oversold and could witness a rebound.
BTC’s RSI attempt to break above the 50-neutral line signals that bullish momentum is gaining strength as more buying pressure enters the market. This potential crossover could indicate the start of an upward trend or a shift toward positive price action for the leading coin.
In this scenario, its value could rocket past the resistance at $87,775 and climb to $91,531.
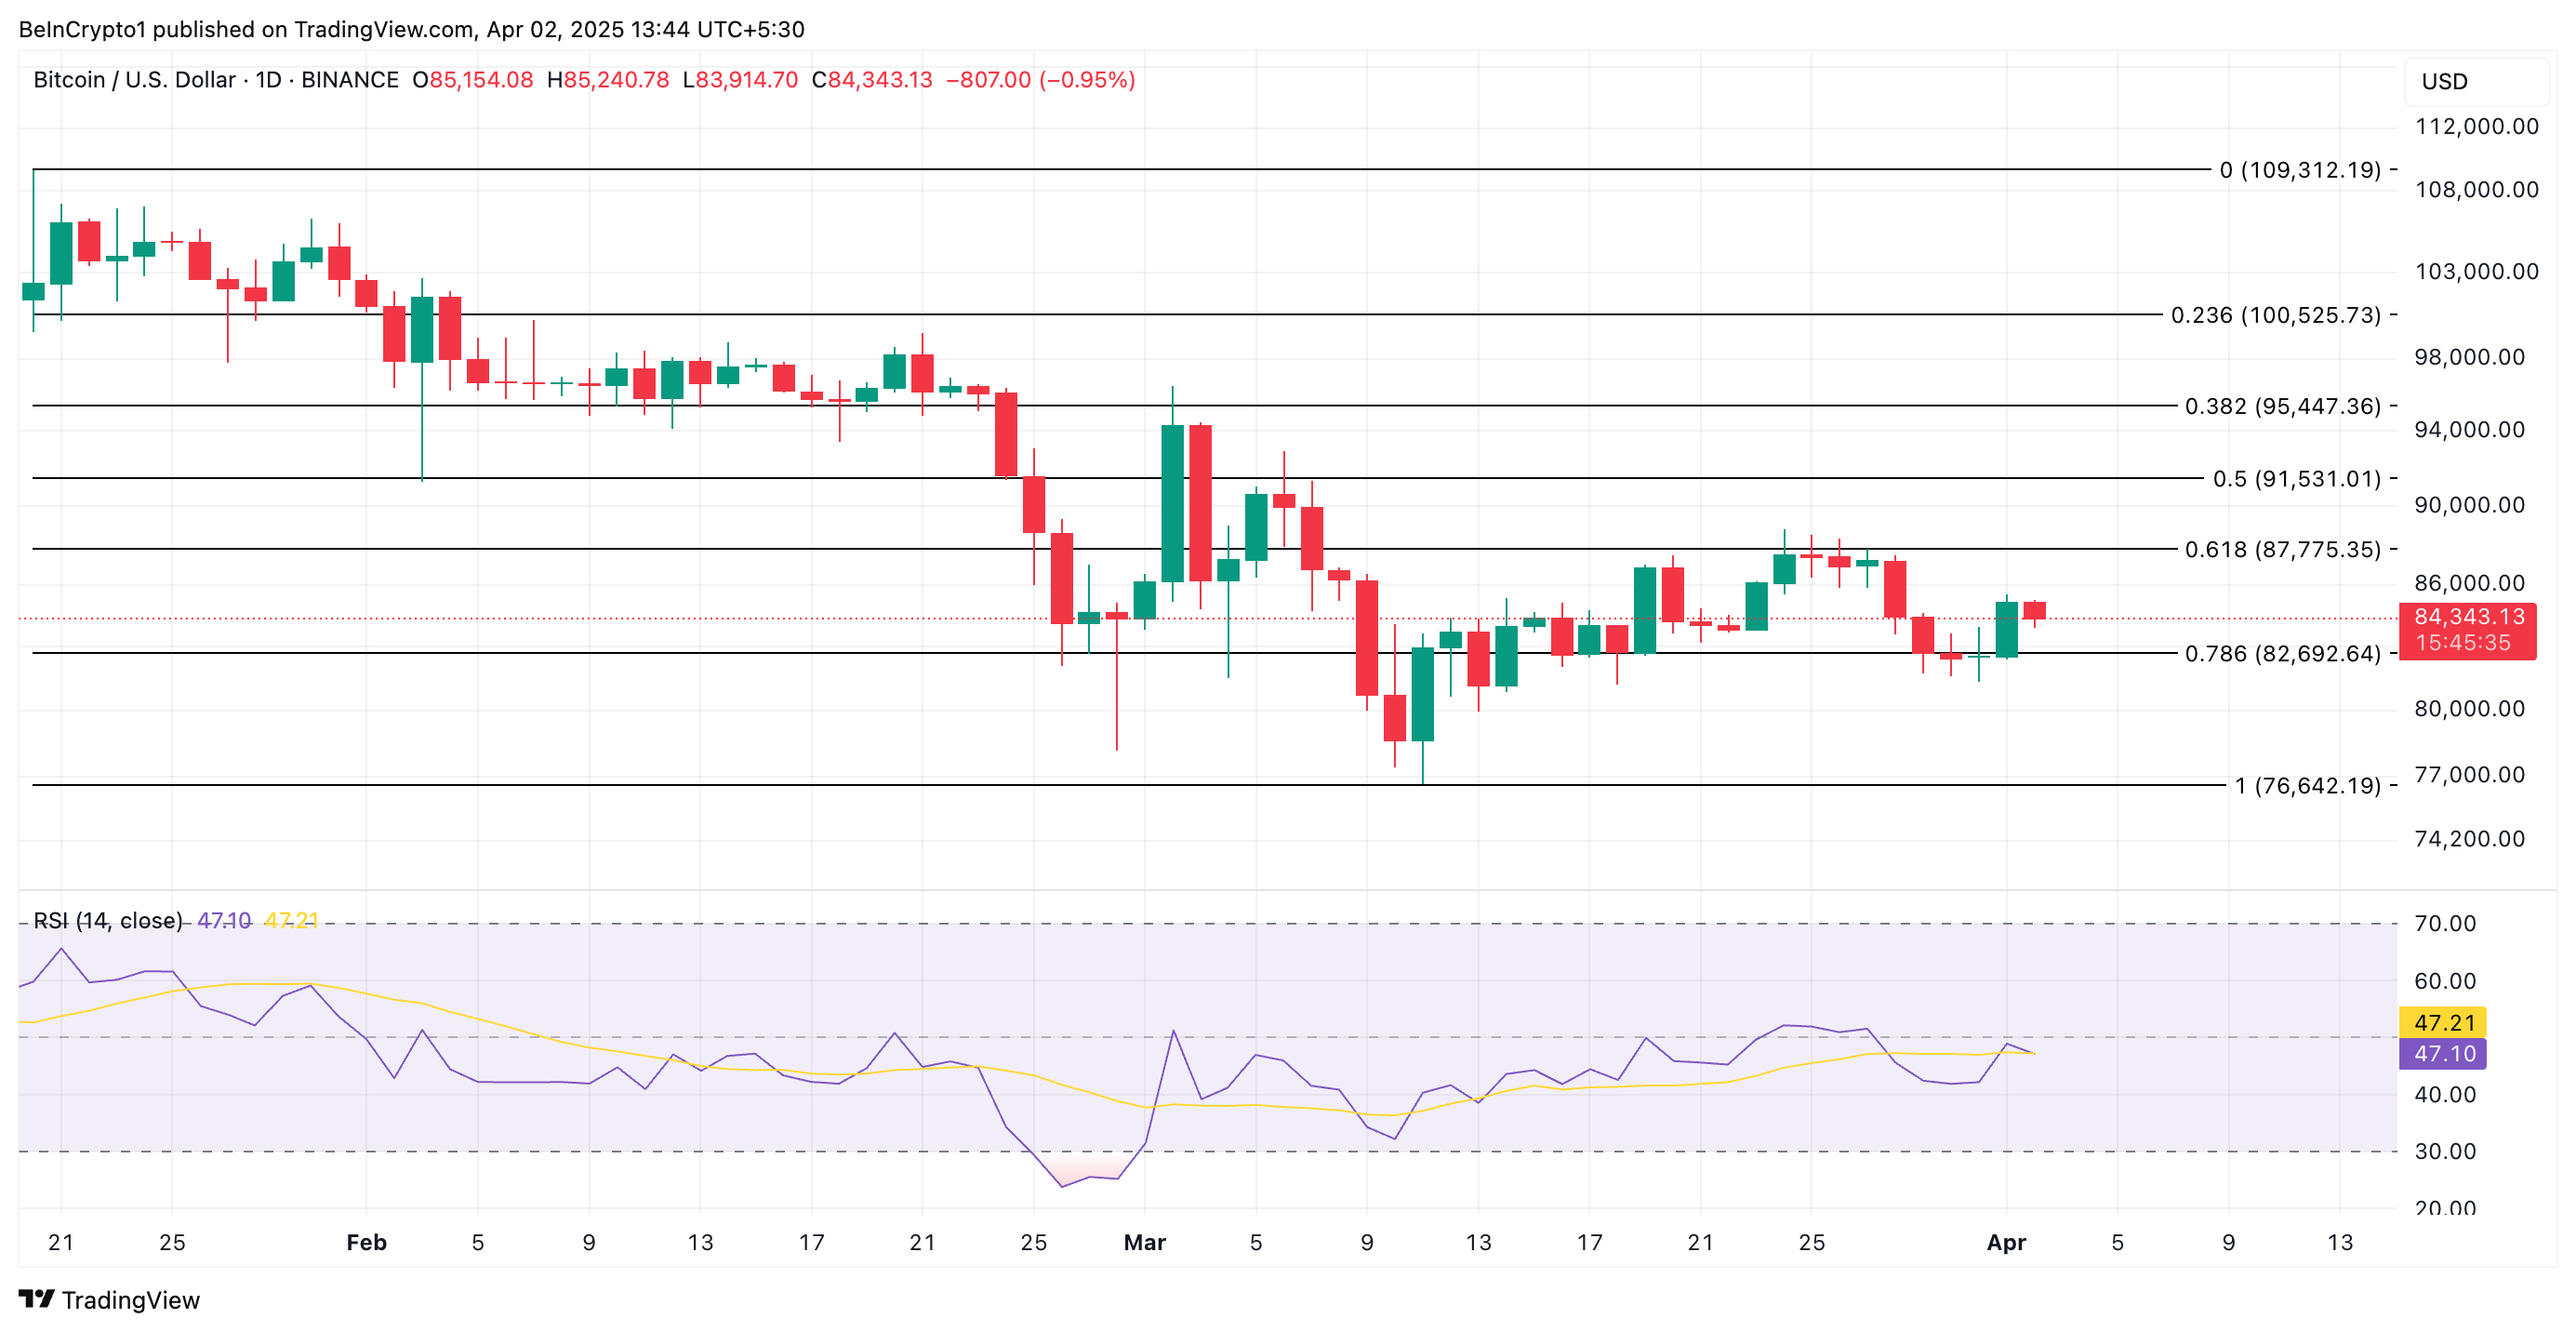
Conversely, if bearish dominance resurfaces, the coin’s price could resume its decline and drop to $82,692.
