The Bitcoin price has been gradually decreasing since May 14 and has reached an important support level at $8,400.
A breakdown below it would confirm the bearish trend and make the movement until now a part of a bearish Wyckoff distribution.
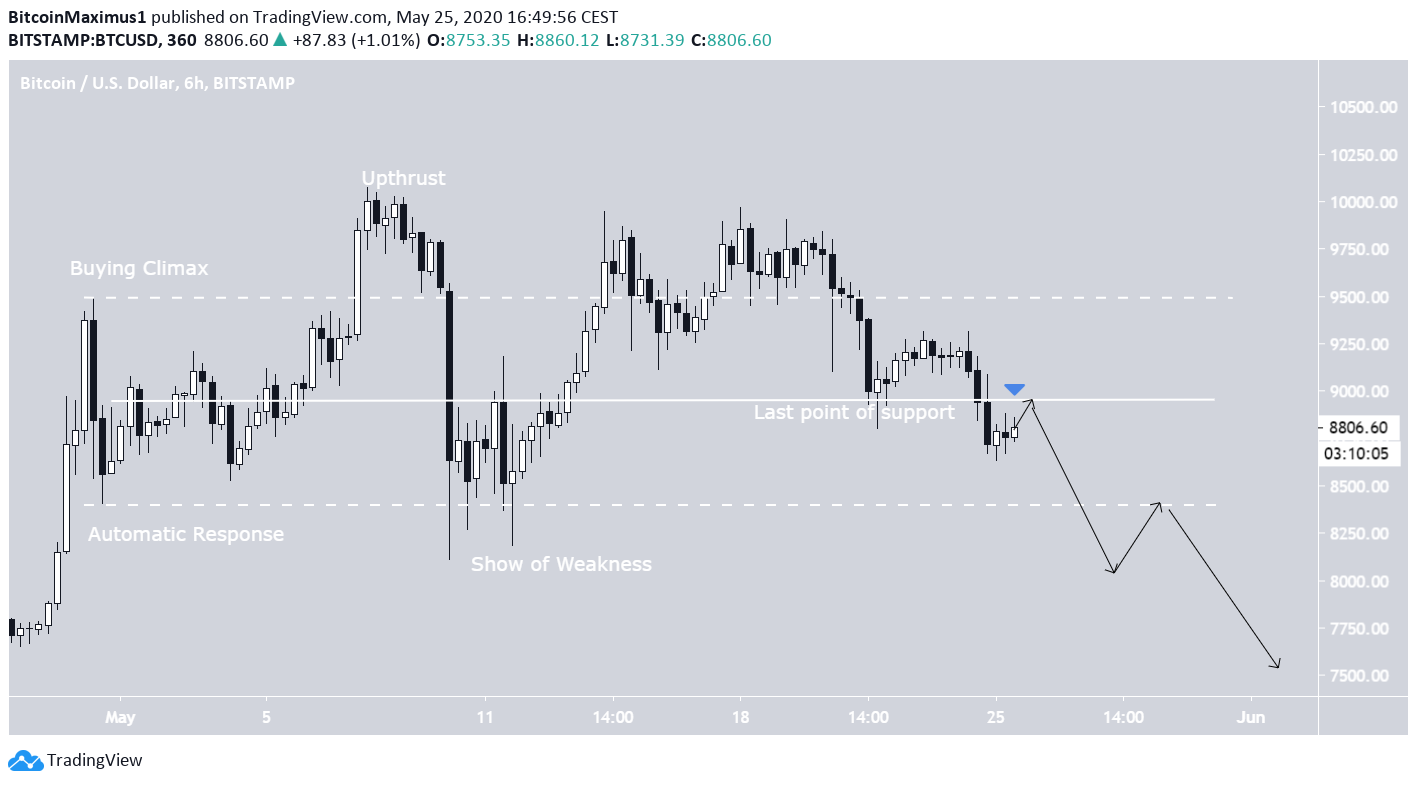
Wyckoff Distribution
If the Wyckoff distribution possibility is correct, then the trading range for Bitcoin since the beginning of May is outlined between $8,400-$9,500.
The $9,500 resistance is created by the ”Buying Climax”, reached at the end of April. While the price has moved above this area twice, these are considered ”Upthrusts”, since the price proceeded to decrease shortly afterwards.
After the price reached $9,500 for the first time, it followed that up with a sharp drop, creating the $8,400 support level in what is known as the ”Automatic Response”. The movement below this level on May 10 is considered the ”Show of Weakness”.
At the time of writing, the price was trading below the middle of this trading range and is possibly in the process of validating it as resistance. If so, the price would soon decrease towards the $8,400 support level and eventually break down.
A successful reclaim of the middle of the range would reduce the chance of this formation being correct, while a successful flip of the $9,500 level as support would confirm that the Wyckoff distribution is incorrect.
Cryptocurrency trader @CryptoCapo_ outlined a BTC chart in which the price is following the Wyckoff distribution.
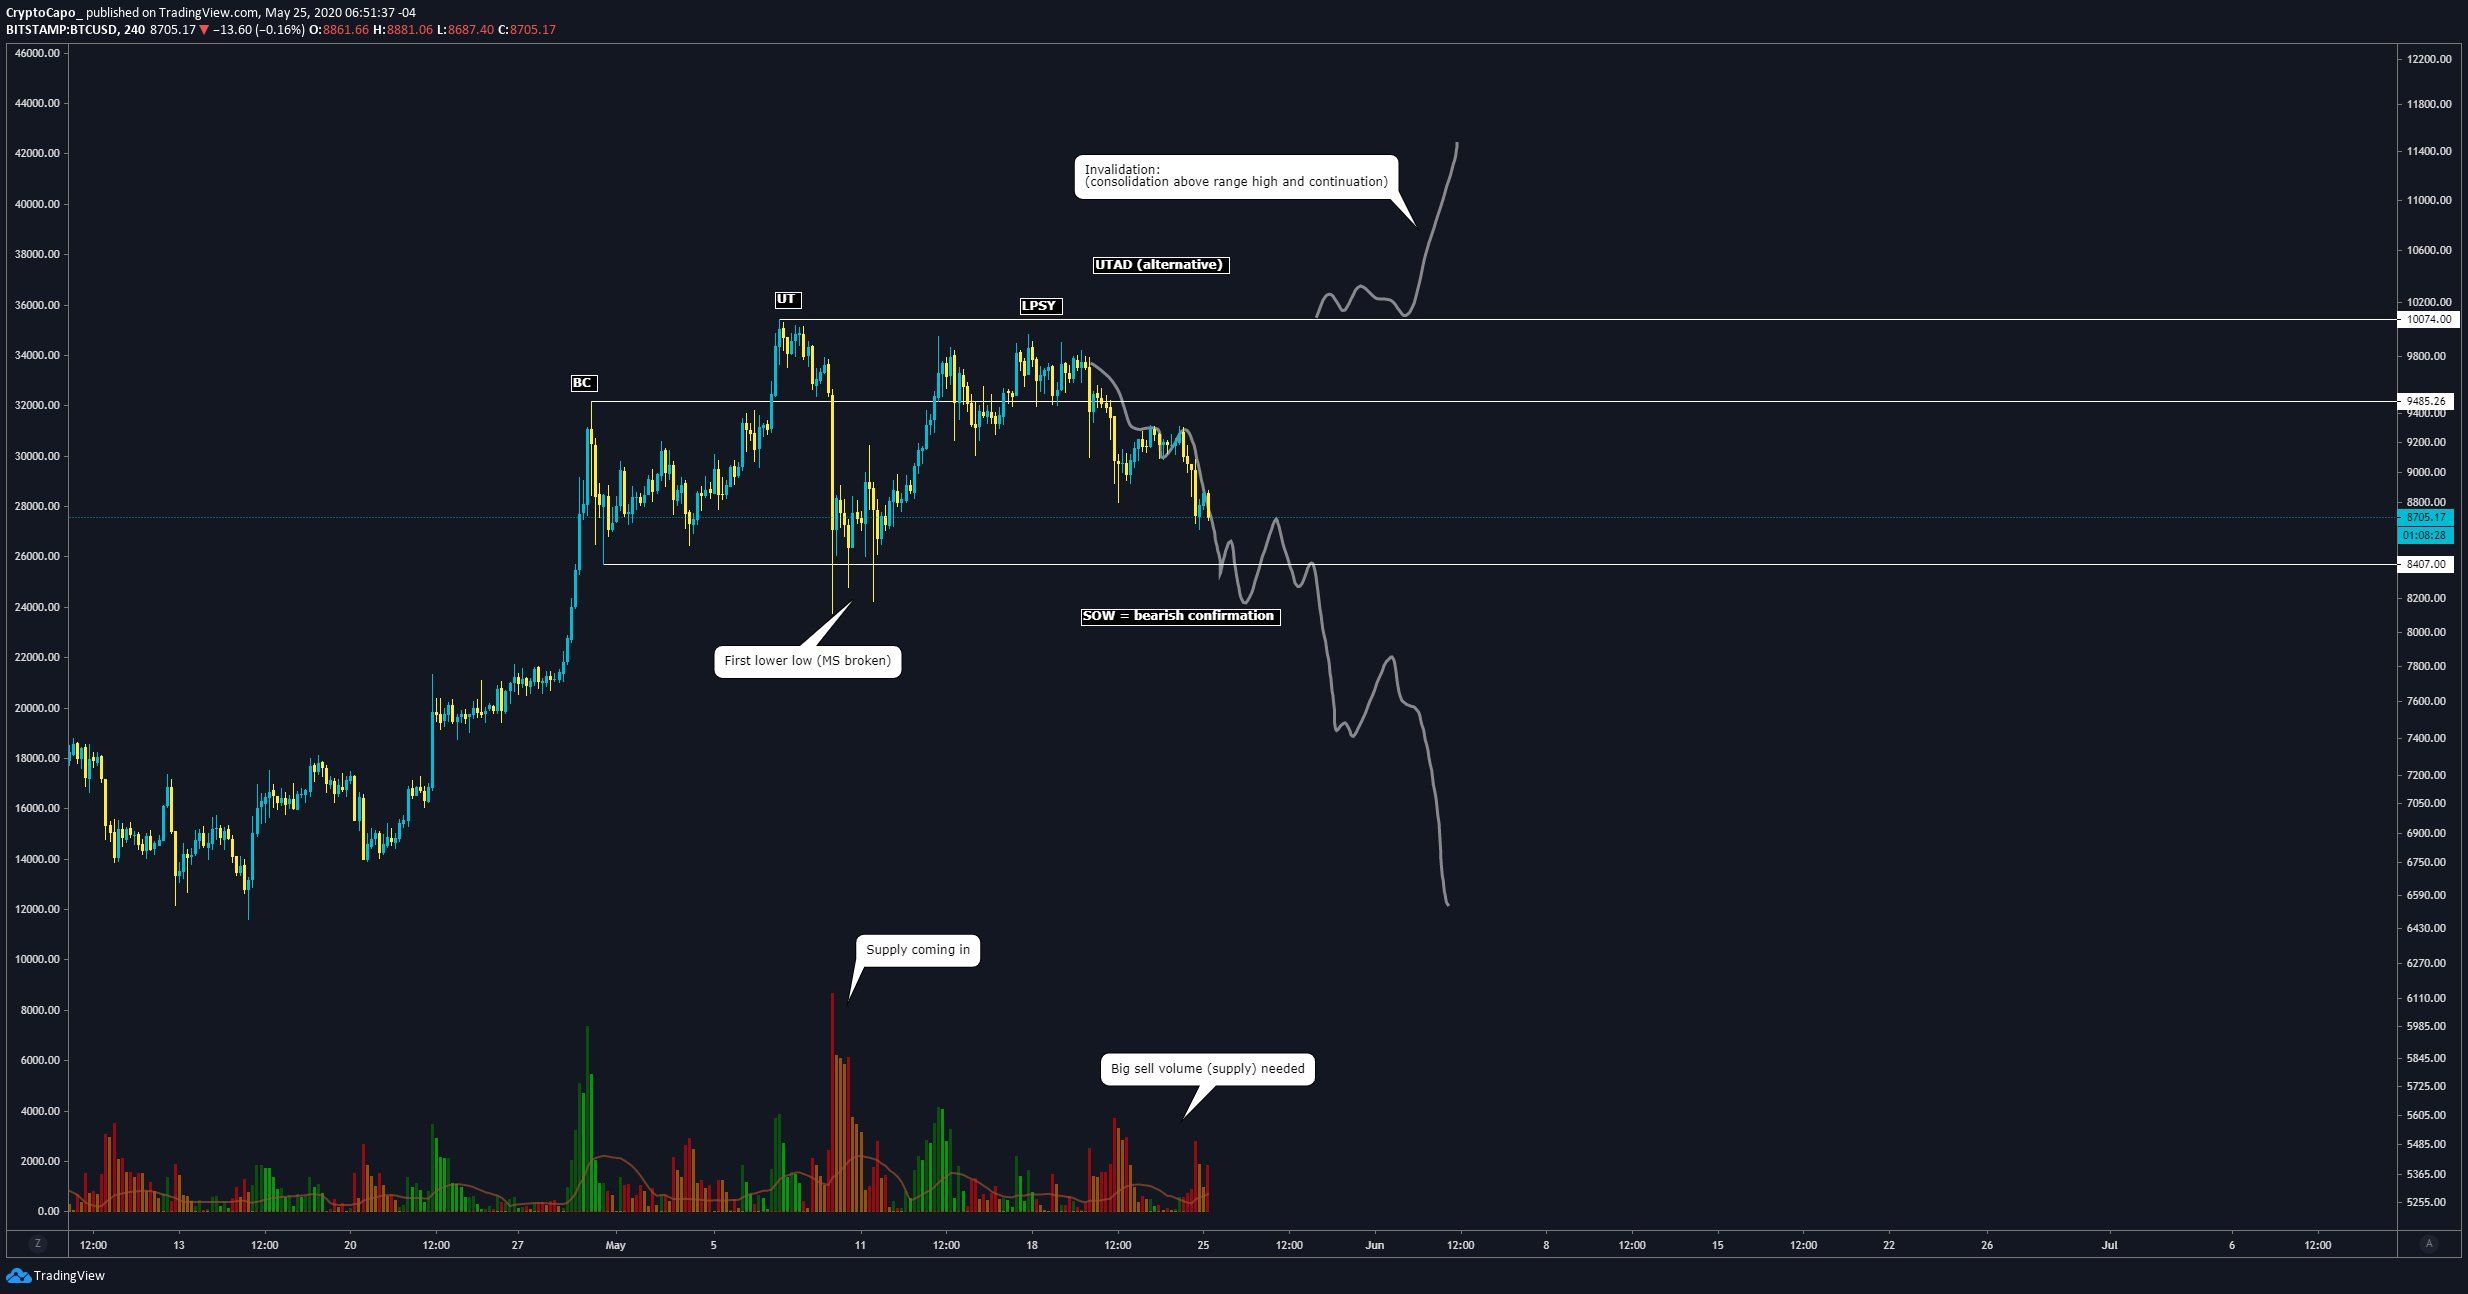
He noted the importance of the $8400 level by saying that
$BTC – Distribution idea update playing out perfectly. $8.5k is the key level. A deviation below this level and price re-entering the range would be bullish. A clean break and retest of this level as resistance would be bearish.
Therefore, a decrease below the support line of this range would be a major bearish development.
After The Breakdown
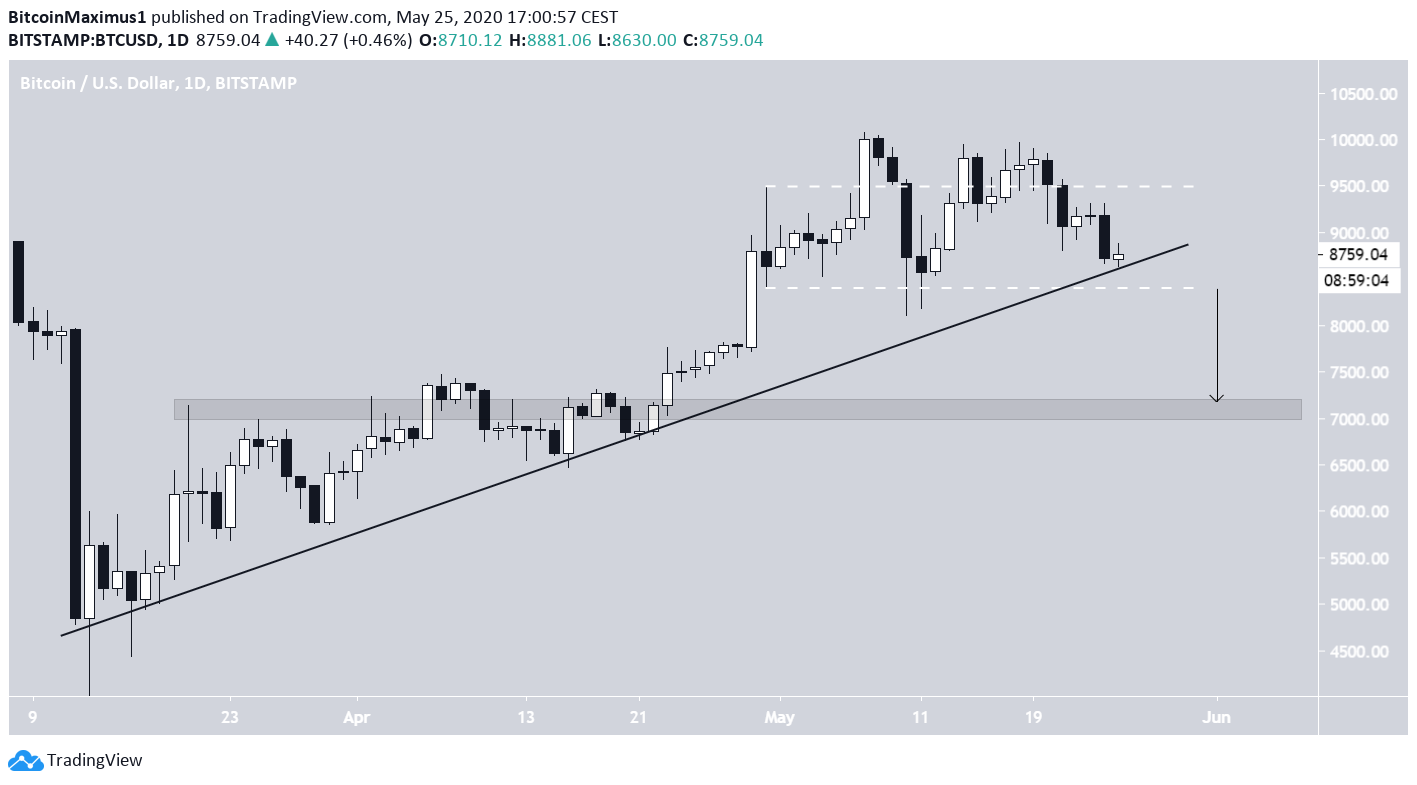
The BTC price has been following an ascending support line since reaching a bottom on March 13. At the time of writing, it was trading right at this support line.
If the proposed movement in the previous section occurs, it would cause BTC to break down below this support line. This would likely cause an accelerated decrease all the way to the closest support level at $7,000, confirming the bearish Wyckoff distribution.