
The Bitcoin (BTC) price has broken out from a crucial resistance area and invalidated a number of bearish wave counts.
This makes it likely that BTC has begun a new upward wave that takes it above the current yearly highs.
Bitcoin’s Monthly Close
During the month of August, Bitcoin created a small bullish Doji that came after a bullish engulfing candlestick in September. While this is a bullish development, the price has yet to clear the wick highs of July 2019. Furthermore, there is a considerable bearish divergence in the RSI. However, both the MACD and Stochastic RSI are increasing, and none of the RSIs are overbought. Therefore, we have mixed signals in the monthly time-frame.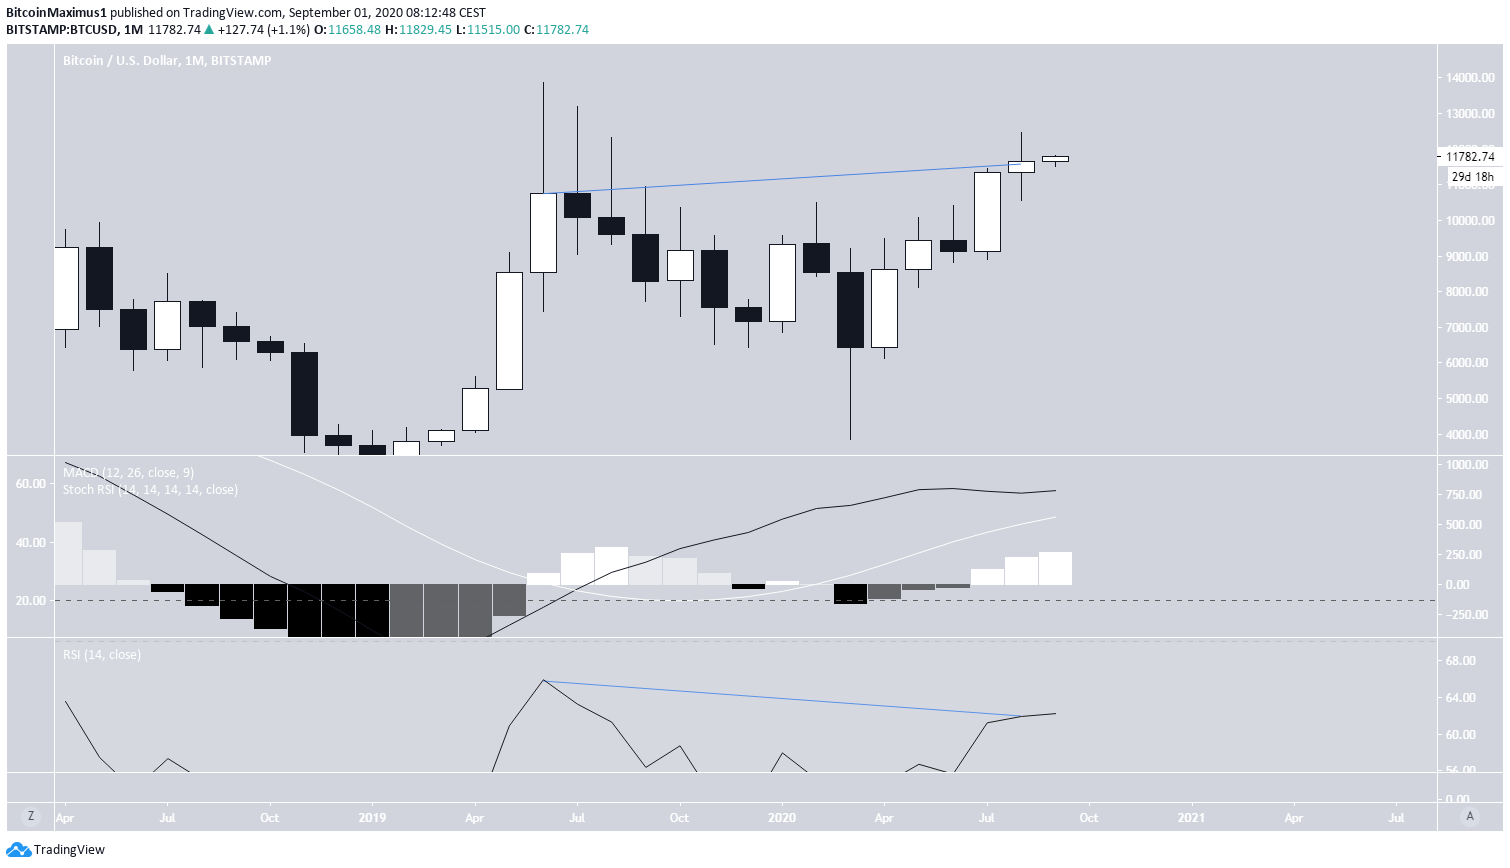
Bullish Daily Time-Frame
The daily chart shows that BTC has just increased above the resistance from the bearish engulfing candlestick of Aug 25. This is a sign that the price is heading upwards, possibly towards the next resistance area, which is found at $12,300. Conversely, the closest support area is found at $11,300.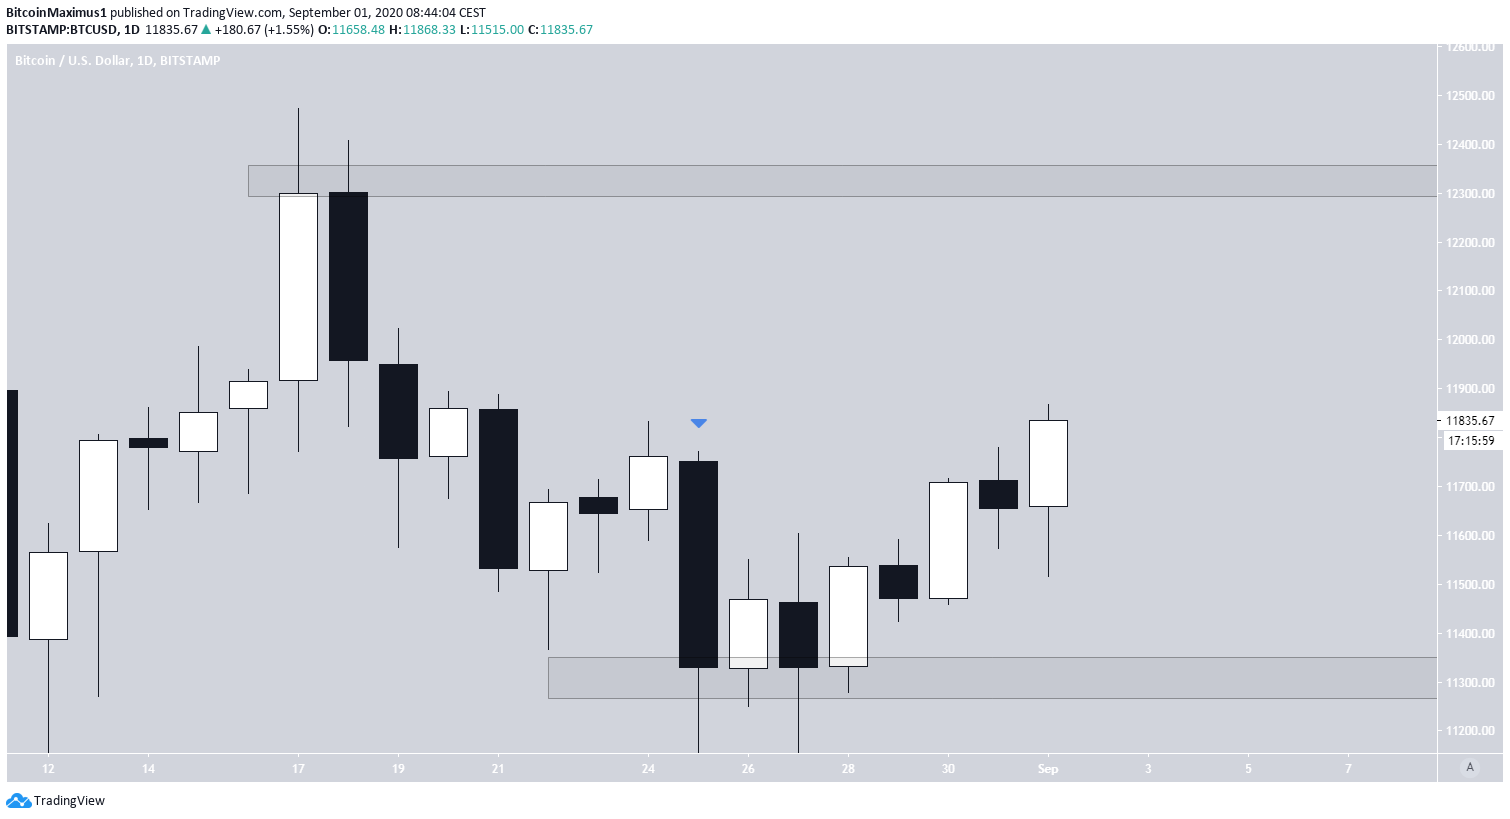
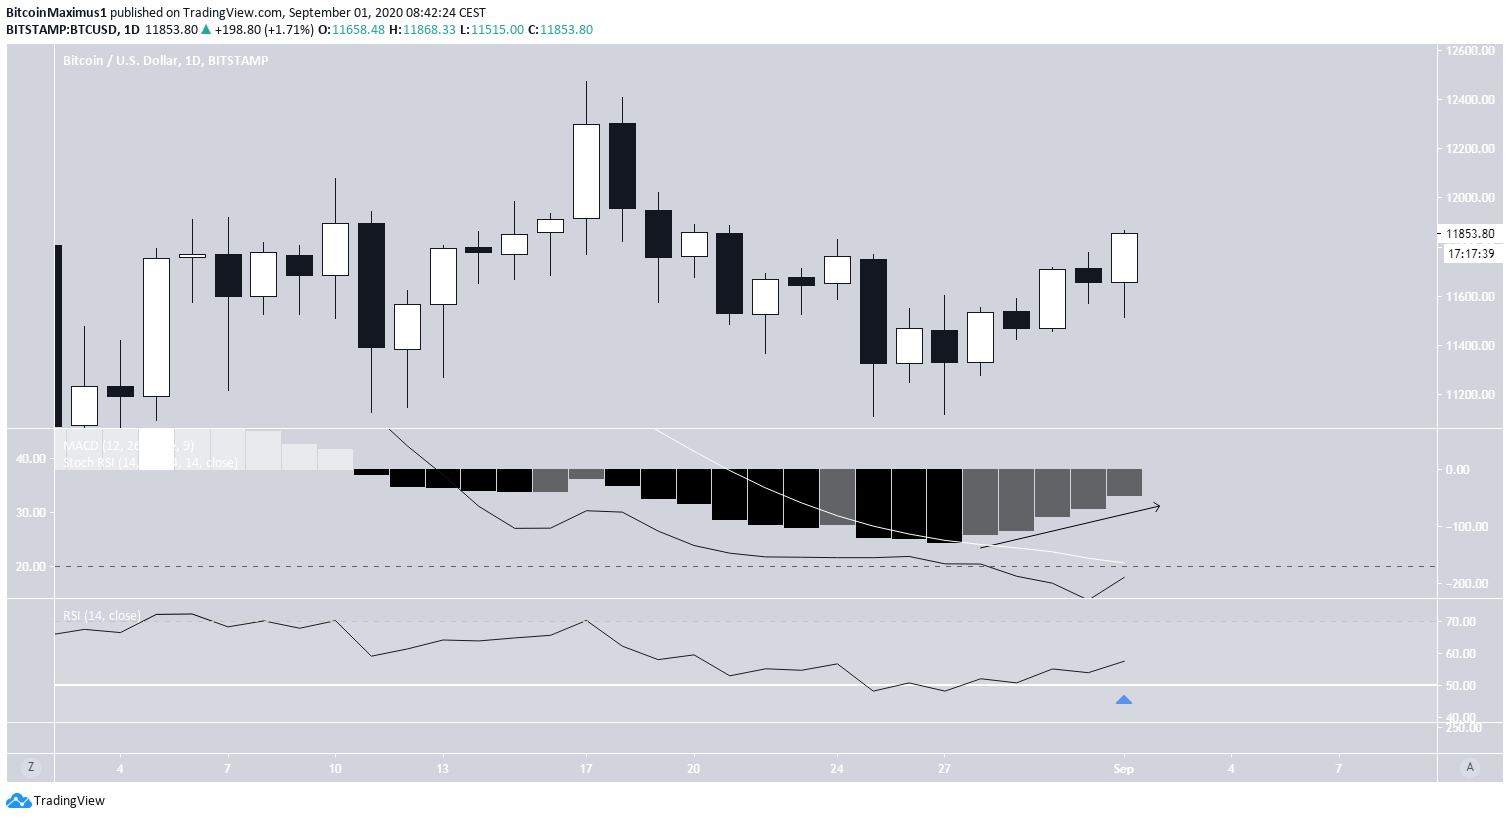
Short-Term Weakness
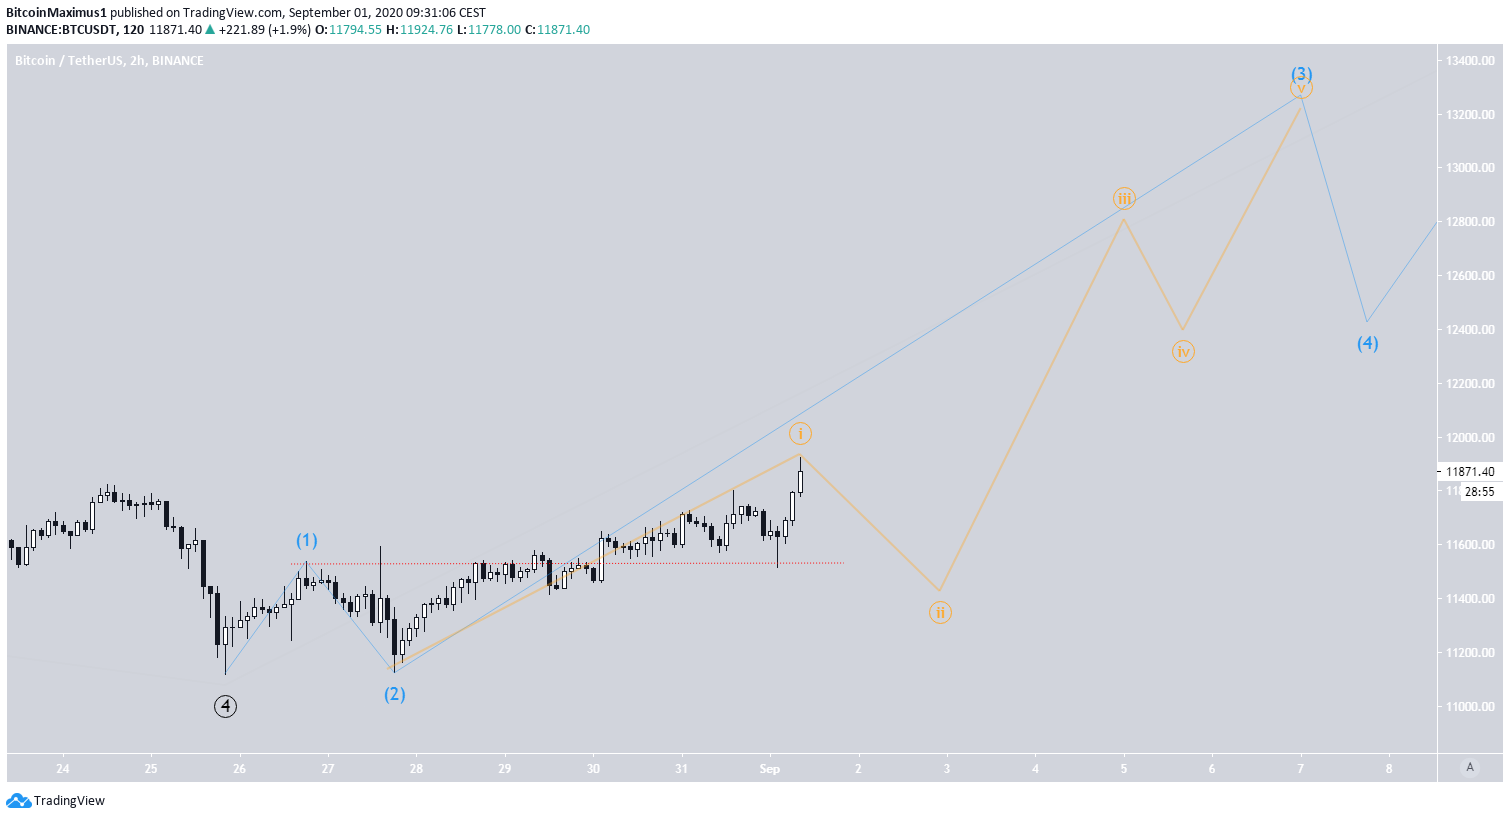
As outlined in BeInCrypto’s Aug 30 wave count analysis, the invalidation of the bearish count falls at $11,825 (red line in the chart below). The Bitcoin price already invalidated it today, so it’s now likely that wave 4 (in black) has ended and is now in wave 5. Wave 4 had an unusual correction (blue) known as a running flat, in which the B wave breaches the top of the A wave, but C does not breach the lows of the A wave. Using the length of waves 1-3, we can make the assumption that wave 5 will end near $13,100 or $14,169, the 0.618, and 1 Fib levels of waves 1-3. If wave 5 extends, which is possible, the price could go even higher.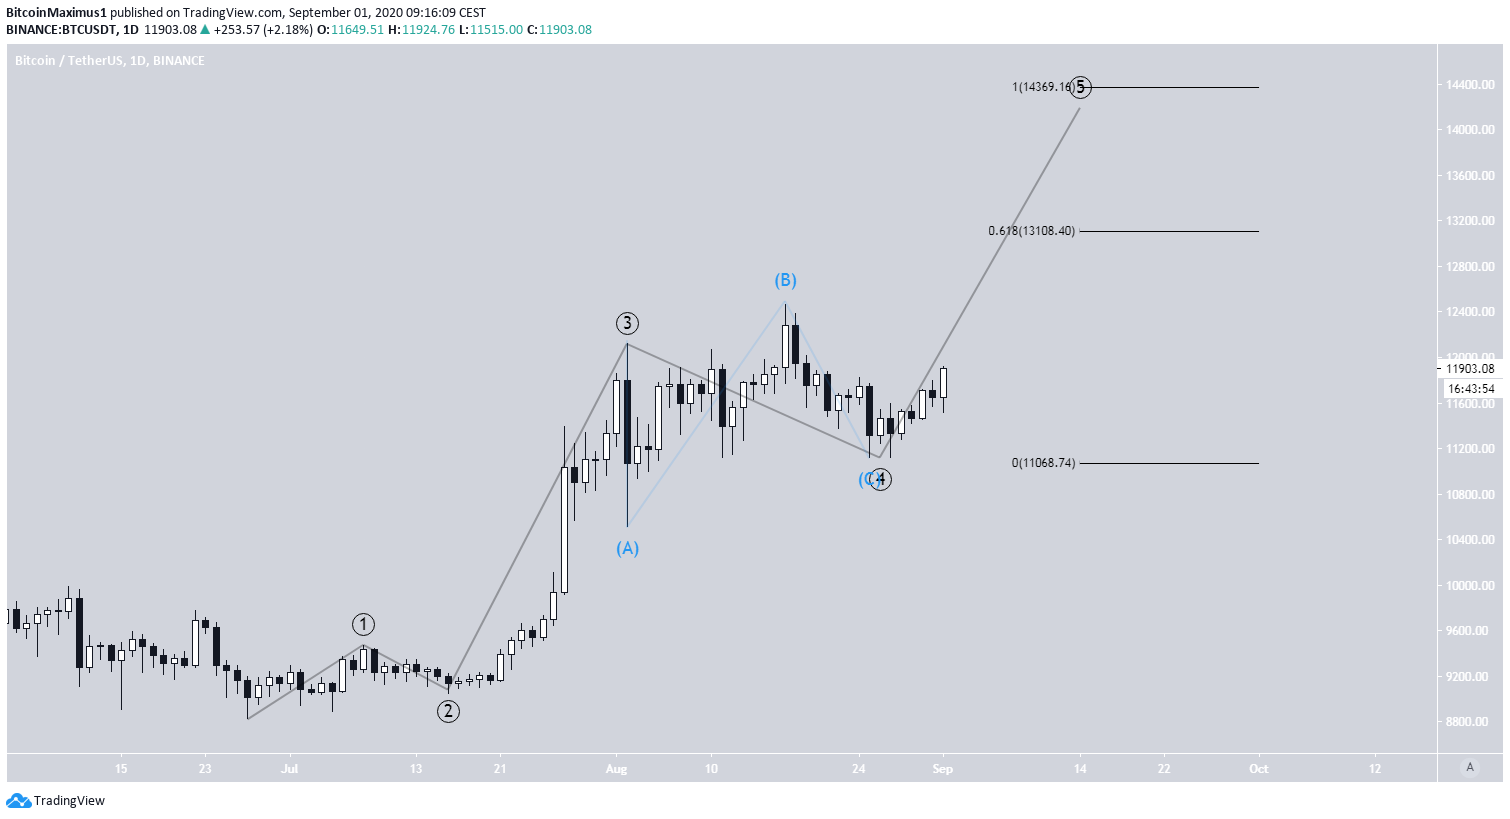
Disclaimer
In line with the Trust Project guidelines, this price analysis article is for informational purposes only and should not be considered financial or investment advice. BeInCrypto is committed to accurate, unbiased reporting, but market conditions are subject to change without notice. Always conduct your own research and consult with a professional before making any financial decisions. Please note that our Terms and Conditions, Privacy Policy, and Disclaimers have been updated.

Valdrin Tahiri
Valdrin discovered cryptocurrencies while he was getting his MSc in Financial Markets from the Barcelona School of Economics. Shortly after graduating, he began writing for several different cryptocurrency related websites as a freelancer before eventually taking on the role of BeInCrypto's Senior Analyst.
(I do not have a discord and will not contact you first there. Beware of scammers)
READ FULL BIO
Sponsored
Sponsored