

Bitcoin (BTC) decreased considerably on July 2, dropping from a high of $9,255 to $8,940 in a span of fewer than three hours.
The decrease also created a bearish engulfing candlestick on the daily time-frame, causing the price to drop below an important moving average (MA).
Bitcoin Limbos Lower
The Bitcoin price had been increasing since it broke out from a descending resistance line on June 29. The increase continued until July 1, when the price began a gradual decrease, which intensified the next day. The price reached a low of $8,940, validating the descending resistance line it had previously broken out from. However, the price bounced upwards and proceeded to reach a close above the minor $9,030 support area. Technical indicators are bearish. While the price initially moved above the 200-hour moving average (black), it proceeded to fall back below and is now facing resistance from the 200 and 50-hour MAs. Furthermore, the RSI has fallen considerably below 50 and is now possibly facing resistance from the line. The volume pattern is also bearish, being the highest during the hourly bearish engulfing candlestick yesterday. While volume has been slightly higher on two occasions since May 25, they occurred during long lower-wicks, which were not present during yesterday’s decrease. Finally, the rally after the sharp drop ended exactly at the 0.618 Fib level, which is a common reversal level. This could indicate that the bounce was a corrective movement and the price could soon continue its downward move.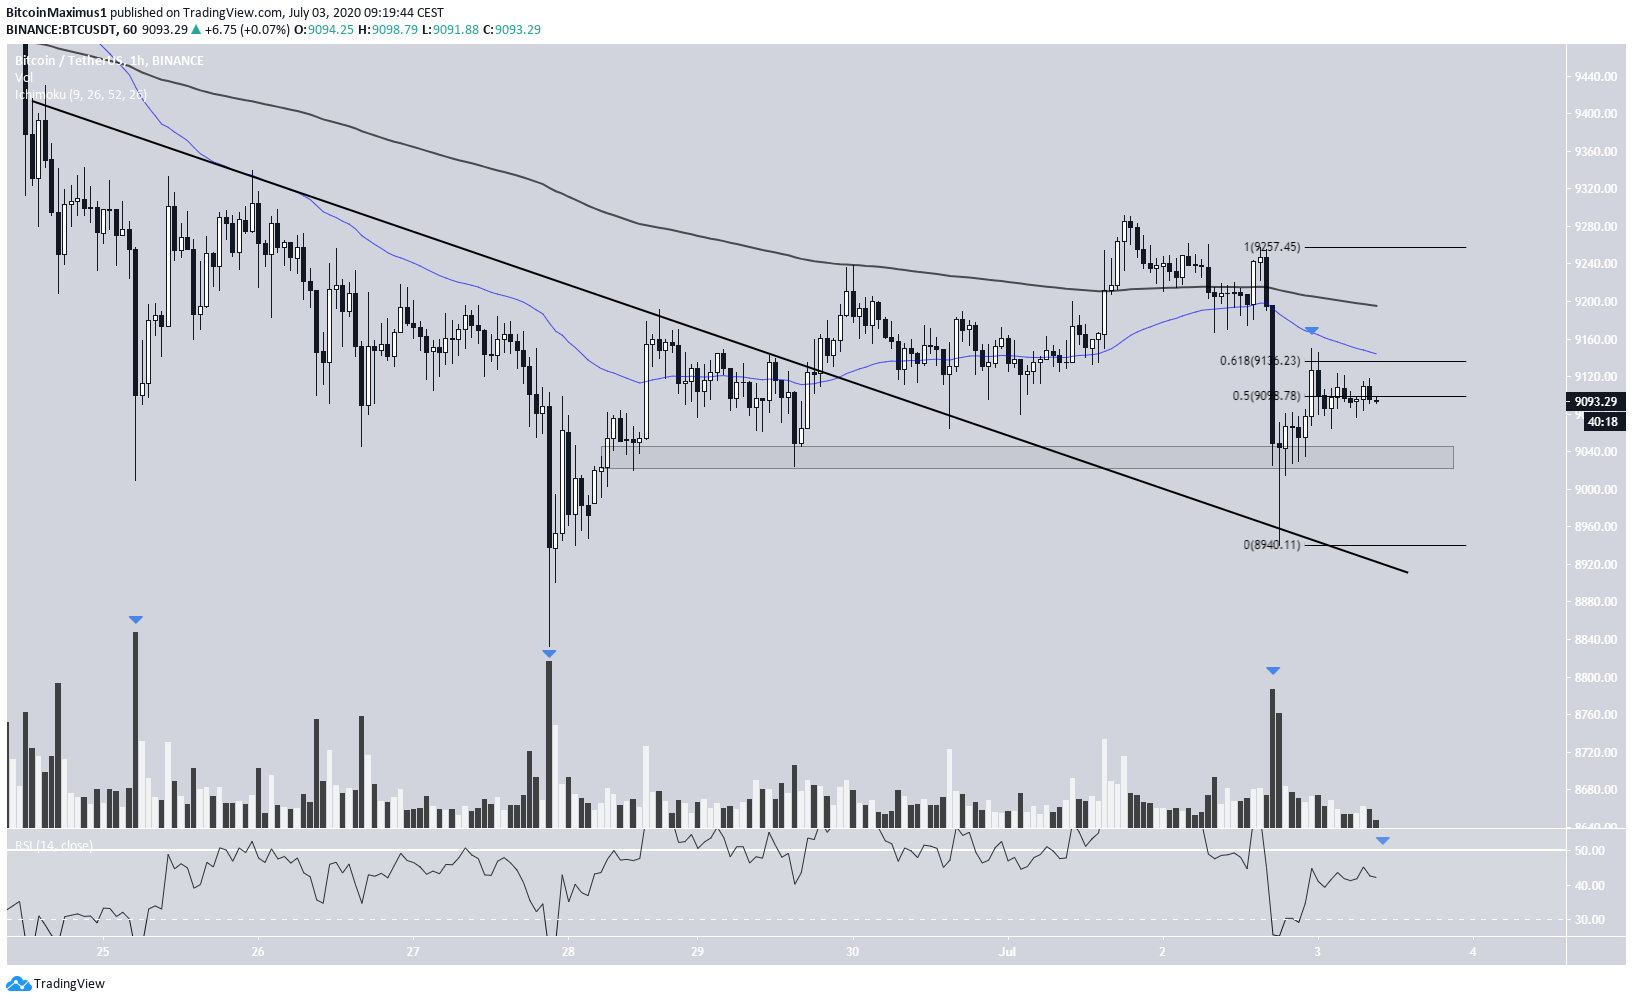
Daily Time-Frame
The daily chart reveals that the price barely failed to reach the 0.5 Fib level of the entire decrease beginning on June 22. Instead, the price decreased and created a bearish engulfing candlestick yesterday. The decrease also caused the price to drop below its 50-day MA, which had previously acted as support. This same MA is now likely to act as resistance in the future. If the price continues its downward movement, it would be expected to decrease all the way to the range low at $8,550.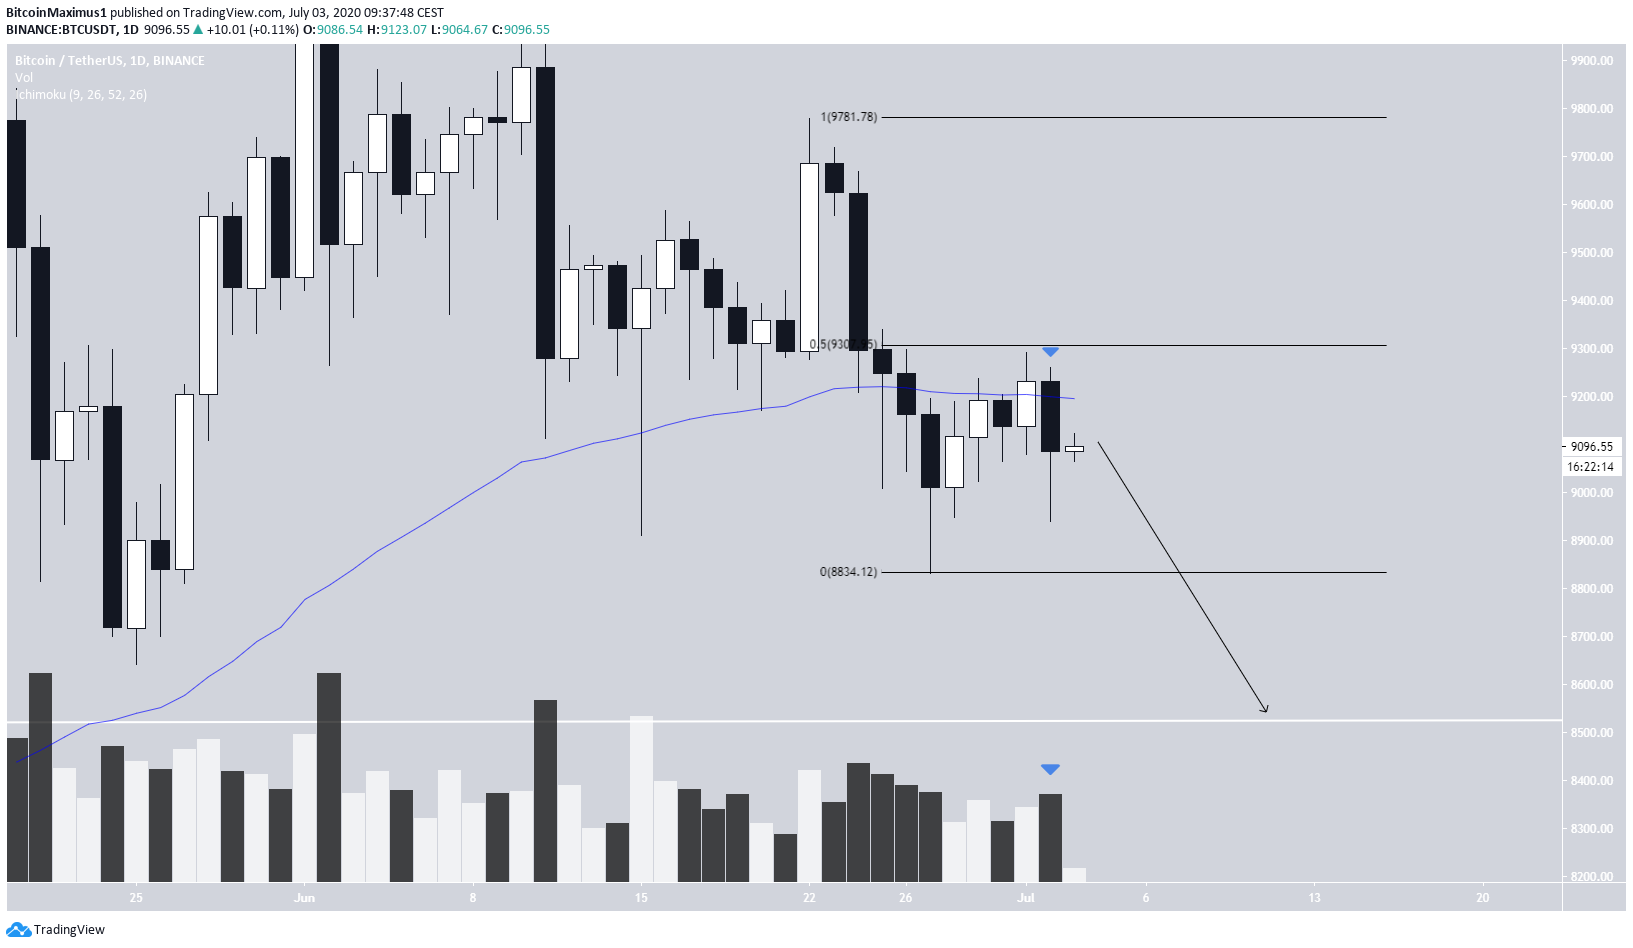 For our previous analysis, click here.
Top crypto projects in the US | April 2024
Trusted
Disclaimer
In line with the Trust Project guidelines, this price analysis article is for informational purposes only and should not be considered financial or investment advice. BeInCrypto is committed to accurate, unbiased reporting, but market conditions are subject to change without notice. Always conduct your own research and consult with a professional before making any financial decisions. Please note that our Terms and Conditions, Privacy Policy, and Disclaimers have been updated.

Valdrin Tahiri
Valdrin discovered cryptocurrencies while he was getting his MSc in Financial Markets from the Barcelona School of Economics. Shortly after graduating, he began writing for several different cryptocurrency related websites as a freelancer before eventually taking on the role of BeInCrypto's Senior Analyst.
(I do not have a discord and will not contact you first there. Beware of scammers)
READ FULL BIO
Sponsored
Sponsored