


The Bitcoin price has had three major upward moves from inception until the present. Interestingly, the conclusion of these movements caused them to retrace to very similar levels, prior to beginning the next bullish trend. Even with the recent decrease, the BTC price has yet to drop below this important support level.
Bitcoin (BTC) Price Highlights
- The price has returned to the 0.382 Fib level of the previous upward move.
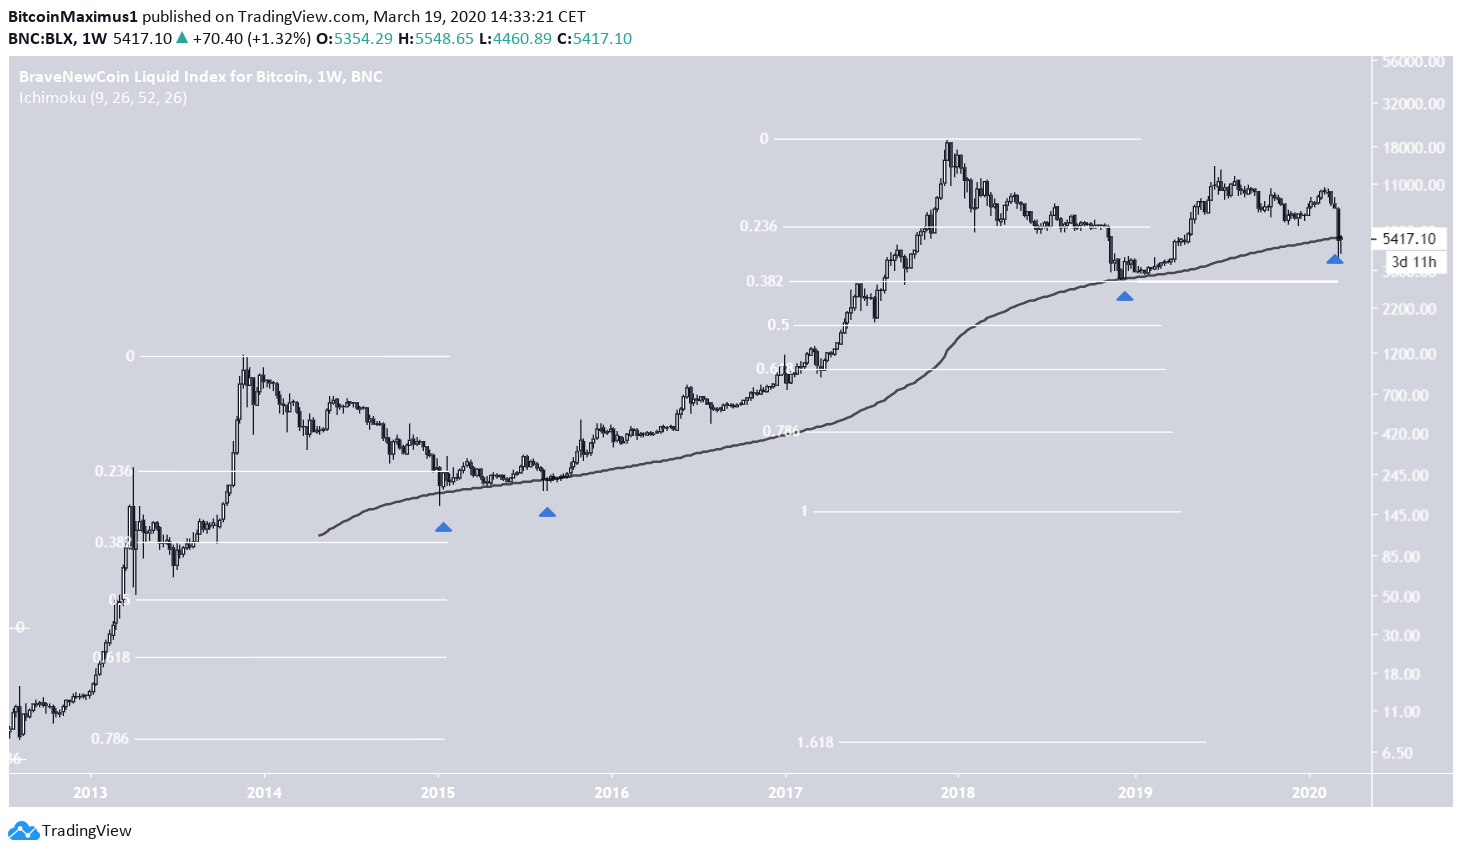
- It has reached its 200-week moving average (MA).
- There is support near $3,200.
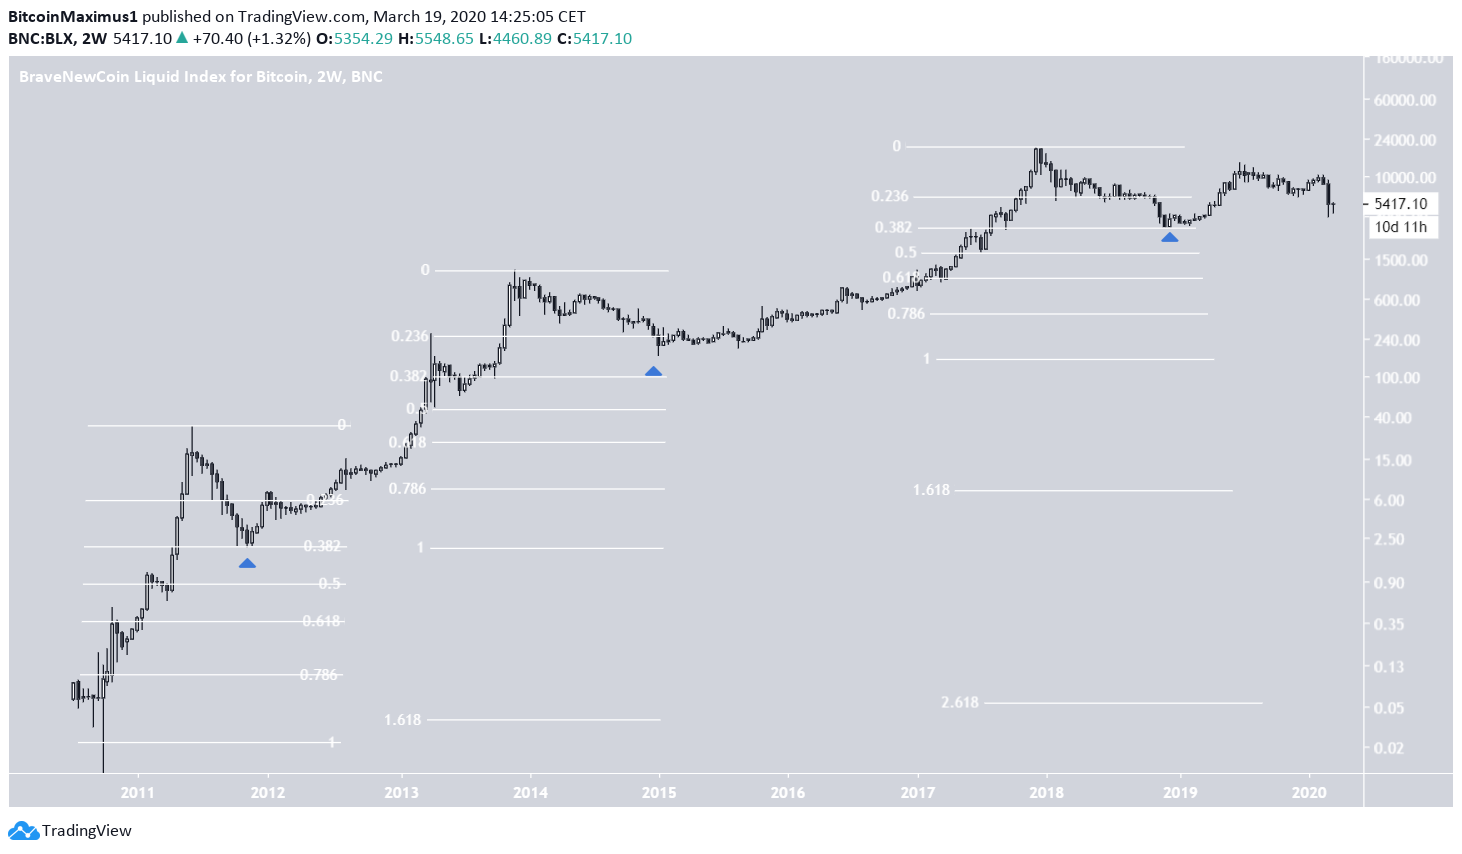
Well-known cryptocurrency trader @davthewave tweeted a BTC chart that shows a Fibonacci retracement tool on all three of the upward movements in Bitcoin’s history. These transpired in 2011, 2014, and 2017 respectively. During the two previous moves, the 0.382 Fib level marked the end of the downward move and the local bottom.
The real values not the nominal ones.🧐 pic.twitter.com/X7Jjy9NZJt
— dave the wave🌊🌓 (@davthewave) March 19, 2020
Fibonacci Levels
The Bitcoin price has had three major upward moves until now. Their respective highs were reached in :
- June 2011
- November 2013
- December 2017
All of these moves have one shared characteristic — they all reached a bottom close to the 0.382 levels of the previous rallies. While the low after the November 2013 high was slightly above this level, it was close enough that we can consider it significant.
The December 2018 bottom also fell exactly to this level at around $3,200.
Another similarity between the current movement and that of 2013 is the relationship of the price and its 200-week moving average (MA).
In 2013, the price bounced on the MA twice, with an extended period in between prior to resuming its upward movement.
In the current setting, the price bounced on the MA in December 2018 and reached it once again last week. Therefore, unless the price breaks down from the MA support, the two movements are very closely mirroring each other.
Even if the price were to break down, it would be expected to bounce near the 0.382 Fib level. A decrease below would invalidate the similarities between these upward moves.
To conclude, the BTC price has shown similar retracement levels throughout its prior two historical upward moves. As long as the price does not decrease below $3000, the similarities are still valid.


